
Class 12 AHSEC 2020 Economics Question Paper Solved English Medium, AHSEC Class 12 Economics Question Paper Solved PDF Download, to each Paper is Assam Board Exam in the list of AHSEC so that you can easily browse through different subjects and select needs one. AHSEC Class 12 Economics Previous Years Question Paper Solved in English can be of great value to excel in the examination.
Class 12 AHSEC 2020 Economics Question Paper Solved English Medium
AHSEC Old Question Paper provided is as per the 2020 AHSEC Board Exam and covers all the questions from the AHSEC Class 12 Economics Solved Question Paper 2020 English Medium. Access the detailed Class 12 Economics 2020 Previous Years Question Paper Solved provided here and get a good grip on the subject. AHSEC 2020 Economics Question Paper Solved Access the AHSEC 2020 Economics Old Question Paper Solved, AHSEC Class 12 Economics Solved Question Paper 2020 of English in Page Format. Make use of them during your practice and score well in the exams.
ECONOMICS
2020
ECONOMICS OLD QUESTION PAPER SOLVED
1. (a) What does a Production Possibility Curve indicate?
Ans: Production Possibility Curve is a curve which shows all Possible Combinations of two goods that can be produced by making full use of given resources and technology in an economy.
(b) If an increase in the price of good X increases the demand for good Y, then how are the two goods related?
Ans: The two goods are related to substitute goods.
(c) Total Variable Cost (TVC) will be_____ When total product is zero.
Ans: Zero.
(d) A firm earns normal Profit when——-.
(i) AR>AC
(ii) AR=AC
(iii) AR<AC
(iv) MR=MC
Ans: (ii) AR=AC.
(e) In a centrally Planned economy , which of the following takes all economic decisions?
(i) Central Bank
(ii) Market
(iii) Government
(iii) Both Government and Central Bank
Ans: (iii) Government.
(f) What are the shapes of AR and MR curves for a firm under non-competitive Market structure?
Ans: AR is downward sloping, MR lies below AR curve and is twice as steep as the AR curve.
2. Mention two reasons that give rise to economic problems.
Ans: The Economic Problem basically called the central economic problem. Economic Problem is the Problem of resource allocation or Making choices in the use of scarce resources having alternative uses.
The two reasons for rising economic problem is:
(i) Limited resources. and
(ii) Unlimited wants.
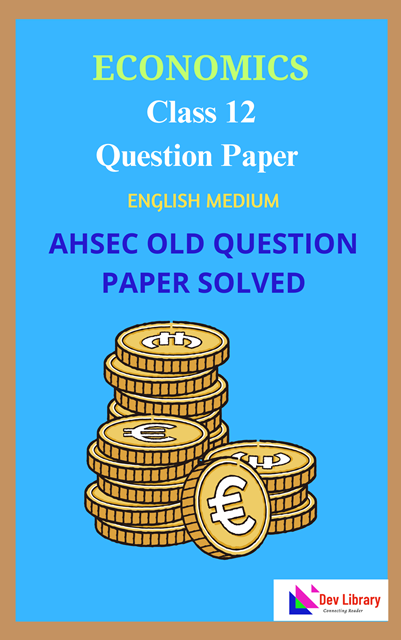
3. What is a budget line? Why does it slope downward?
Ans: It shows all those combinations of two goods which a consumer can buy spending his entire money income on the two goods at their given prices.
Symbolically, the budget line can be written algebraically as follow:
PxX +PyY =M
Where
Px = price of good X
Py =price of good Y
X = good X
Y = good Y
In this diagram, the two-commodity case is discussed. The consumer spends his entire income on these two goods. With his entire income, the consumer can either purchase OA amount of Good Y or OB amount of Good X or he can purchase any combination of good X and Y that lies on the Budget Line as shown by a linear downward sloping curve AB in the figure.
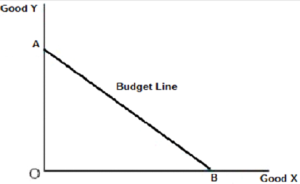
4. If a unit tax is imposed, how does it impact the short-run supply curve of a firm ? show with the help of diagrams.
Ans: When Governments imposed tax to individuals or firms in order to increase its revenue. Considering taxes to firms, these taxes will increase the price of goods being produced and sold, which translates into a welfare loss. However, a distinction between the loss in consumer and producer surplus must be made. The impact on both surpluses depends on the period analysed.
Now,
We understand with the help of diagrams in the short-run say this tax imposed on the firm. both consumers and producers suffer from the tax imposed. The new tax increases the price of goods. The price of goods will increase to cover these losses. The supply curve shifts to the left and demand remains unchanged.
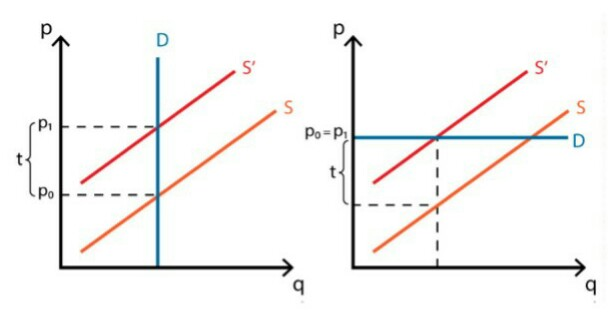
5. What is the “break-even point” of a firm? At which point of the AC curve, a firm under perfect competition breaks-even?
Ans: Break event point for a firm is determined at the level of output where TR=TC OR its AR=AC.
This is also known as “no profit no loss” or “normal Profit” situation Graphically, it is represented as in fig.
It would be seen quantity from figure:
(i) Equilibrium point = E
(ii) Equilibrium output = OQ.
6. What does price elasticity of supply mean? Briefly explain.
Ans: Elasticity of supply is a relative measure of the responsiveness oa supply to change in the price of a commodity. It measures the percentage change in the quantity supplies due to a change in the price of the commodity.
Price elasticity of supply is defined as the percentage change in quantity supplied caused by a given percentage change in own price of the commodity. It is measured as the ratio between the percentage change in quantity supplied and the percentage change in the price of the commodity.
7. What is a monopolistic competitive market?
Ans: Monopolistic competition exists when many companies offer competing products or services that are similar, but not perfect, substitutes.
The barriers to entry in a monopolistic competitive industry are low, and the decisions of any one firm do not directly affect its competitors. The competing companies differentiate themselves based on pricing and marketing decisions.
8. Discuss four features of the indifference curve.
Ans: The four properties of indifference curves are:
(1) indifference curves can never cross,
(2) the farther out an indifference curve lies, the higher the utility it indicates,
(3) indifference curves always slope downwards, and
(4) indifference curves are convex.
9. Define and draw average cost and average variable cost curve. Why these two curve cannot touch each other?
Ans: The shape of the average cost (AC) and average variable (AVC) cost curve depends upon the shape of the Average fixed cost (AFC) curve.
AC = AFC + AVC
AC = Total Cost/Output
AVC = TVC/output
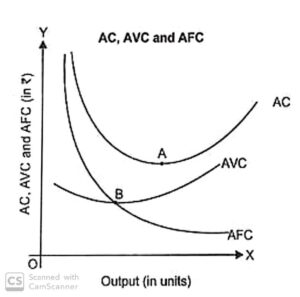
In the beginning, we find that as output increases average variable cost (AVC) and average fixed cost (AFC) both fall, average cost (AC) curve falls sharply. When AVC has started raising and AFC is falling , AC and AVC ( costs such as wages or cost of supplies) curves continue to fall with increase in output because the gap between them is AFC, which continues to decline with rise in output. Not only this, initially, with the increase in output, AVC falls. So, AC must fall .
Or
The Total Cost (TC) schedule of a production unit is given below. Find out TFC, TVC, AC and MC.
Ans:
At zero unit of quantity TC = TFC and TFC is fixed. So than TFC is 10.
TVC = TC – TFC
ATC = TC / Q
MC = TCn – TCn-1
10. Mention four differences between perfect competition and monopoly.
Ans: The differences between perfect competition and monopoly are as follows:
| Perfect Competition | Monopoly |
| It is a market situation where a large number of buyers and sellers deal in a homogeneous product at a fixed price set by the market. | It is a market situation where there is only one seller in the market selling a product with no close substitutes. |
| This market has a very large number of sellers. | This market has a single seller. |
| This market has homogeneous products. | There are no close substitutes in this market. |
| There is freedom of entry and exit in this market. | There is a restriction on the entry of new firms and exit of old firms. |
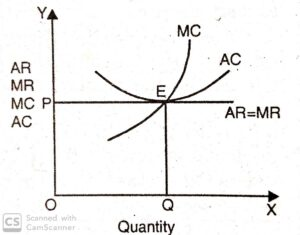
11. Explain with the help of a diagram, how shifting of the supply curve of a commodity affects its equilibrium price and output.
Ans: shifting of the supply curve of a commodity affects its equilibrium price and output.
Now,
we understands with the help of diagram given below:
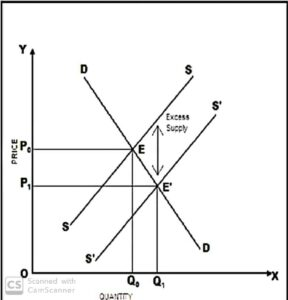
The supply curves SS and S’S’ show the effect of an increase in supply as a result of a favorable change in the conditions of supply (such as a reduction in the costs of production because of productivity improvements)- S’S’ being the new supply curve. Before the increase in supply, the equilibrium price was P0 and the equilibrium output was Q 0.
As a result of the increase in supply, excess supply occurs at the price P0, causing suppliers to lower the price in order to expand demand. A new equilibrium price is established at P1 with a higher equilibrium output at Q1. Notice again that a change in conditions of supply does not cause a shift in the demand curve.
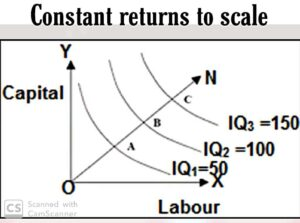
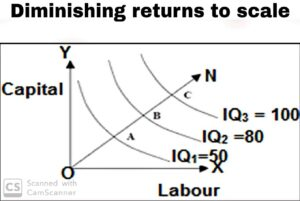
12. What do you understand by returns to a scale? Write the meaning of constant, increasing and decreasing returns to scale.
Ans: When all factors or inputs required for the production of a goods are increased in the same proportion, the increase in output so obtained represents returns to scale. Because it is only in the long run that all factors can be suitably increased, returns to scale are relevant for the long run.
(a) Constant returns to scale: if all factors used for the production of commodities are increased in a given proportion and output increases in the same proportion, returns to scale are said to be constant.
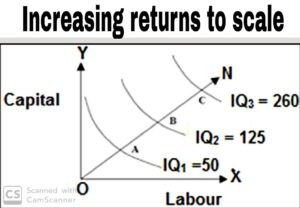
(b) Increasing Returns to Scale: increasing returns to scale occurs when a given percentage change in all the factors of production (say z) causes output to increase in a greater proportion.
(c) Diminishing Returns to Scale: it refers to a situation when the quantity of factors of production is increased in such a way that proportion of factors remains unchanged, and output increases in a smaller proportion as compared to increase in the quantity of factors of production. It is a case of diminishing returns to scale. Diminishing returns to scale implies increasing costs.
Or
State the reasons behind the working of the law of diminishing marginal product.
Ans: The law of diminishing marginal productivity involves marginal increases in production return per unit produced. It can also be known as the law of diminishing marginal product or the law of diminishing marginal return. In general, it aligns with most economic theories using marginal analysis. Marginal increases are commonly found in economics, showing a diminishing rate of satisfaction or gain obtained from additional units of consumption or production.
The law of diminishing marginal productivity suggests that managers find a marginally diminishing rate of production return per unit produced after making advantageous adjustments to inputs driving production. When mathematically graphed this creates a concave chart showing total production return gained from aggregate unit production gradually increasing until leveling off and potentially starting to fall.
Different than some other economic laws, the law of diminishing marginal productivity involves marginal product calculations that can usually be relatively easy to quantify. Companies may choose to alter various inputs in the factors of production for various reasons, many of which are focused on costs. In some situations, it may be more cost-efficient to alter the inputs of one variable while keeping others constant. However, in practice, all changes to input variables require close analysis. The law of diminishing marginal productivity says that these changes to inputs will have a marginally positive effect on outputs. Thus, each additional unit produced will report a marginally smaller production return than the unit before it as production goes on.
13. State and explain the law of demand with the help of an imaginary schedule and diagram.
Ans: law of demand: We know that demand is always at point. Demand for any commodity has no meaning unless it is stated in terms of price. We generally see that the demand for any commodity is relatively low at higher price and it increases with the decrease in price. It is called the law of demand in economics. This law explains the functional relationship between the quantity demanded and price. Prof. Marshall has defined it as, “If other things remain the same, the amount demanded increases with a fall in price and diminishes with a rise in price.” Hence there exists an inverse relationship between the price and quantity demanded. This law can be explained with the help of the following demand schedule and diagram.
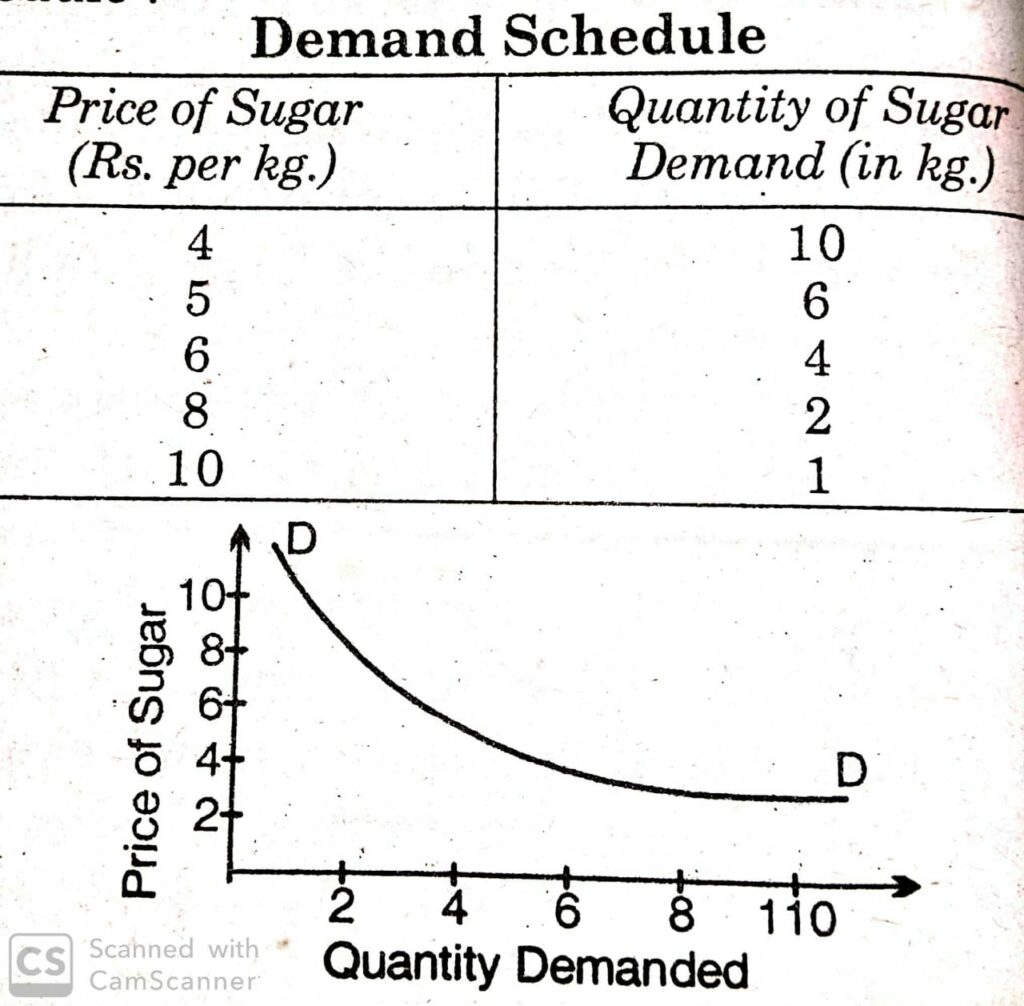
This schedule and diagram shows that the demand for sugar of a household will be more at lower prices and less at higher price.
Or
Calculate price elasticity of demand by expenditure method:
(1) If an increase in price from Rs. 10 to Rs. 12 per unit lowers quantity demanded from 25 units to 20 units.
Ans: Student Do Yourself.
(2) If an increase in price per unit from Rs. 8 to Rs. 10 lowers quantity demanded from 20 to 16 units.
Ans: Student Do Yourself.
(3) If a decrease in price from Rs. 12 to Rs. 8 per unit increases quantity demanded from 20 to 28 units.
Ans: Student Do Yourself.
14. Define:
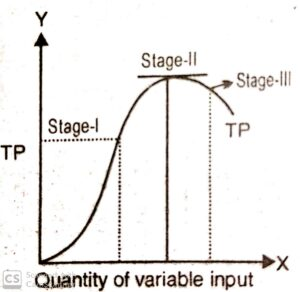
(i) Total Product (TP)
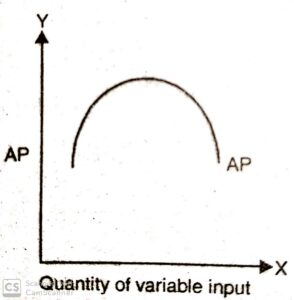
(ii) Average Product (AP)
(iii) Marginal Product (MP)
Explain the relation between AP and MP with the help of suitable diagram.
Ans: (i) Total Product (TP): Total product is the total physical output corresponding to each set of input, Total product rises at an increasing rate first then it keeps increasing at a diminishing rate and for further increasing in input it starts declining. The shape of the total product is shown in Fig.
(ii) Average Product (AP): Average product is equal to total product divided by the amount of the variable factor (L).
AP=TP/L
Average product curve is inverted U-shaped. It increases as the variable factor increases and then it falls. The shape of the average product is shown in Fig.
(iii) Marginal Product (MP): Marginal product is the addition to total product by the employment of an additional factor input.
MPa=TPa-TPa-1
It can be also be written as MPa=ΔTP/ΔL
If labour (L) is the variable factor input. The shape of the Marginal product is shown in Fig.
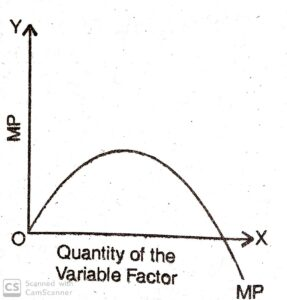
The relation between AP and MP are as follows:
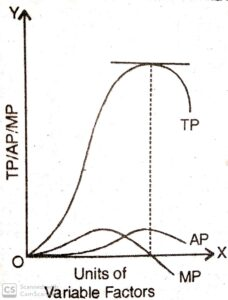
(a) The highest point of the total product curve coincides with the point where the marginal product becomes zero.
(b) When the marginal product becomes negative, then the contribution of the additional unit of the factor becomes negative then the total product starts falling. Average product keeps on increasing as long as the marginal product is higher than it.
(c) When a marginal product cuts it and becomes less than it, the Average product starts falling.
Or
(i) What is a production function?
Ans: The production is the name of the relation between physical inputs and physical outputs of a firm.
Y=f(L,K,S)
(ii) What do you mean by fixed factor and variable factor of production? Give Examples.
Ans: Variable factors are the factors of production which vary with the level of output. For example, Labour and Raw material. Fixed factors are the factors which remain fixed throughout the production process. For example, Land and Machinery.
(i) It does not change with change in quantity of output.
(ii) Explains are rent, wages of permanent staff insurance charges are examples of fixed cost.
(iii) The production function of a firm is given by Q=2L2K2.
Find out the maximum possible output that the firm can produce with 5 units of L and 2 Units of K. What is the maximum possible output the firm can possible with zero (0) units of L and 10 units of K?
Ans:
Given,
Q = 2L2K2
Q = 2(5)2 (2)2
= 2x25x4
= 200
The maximum possible output that the firm can produce with 5 units of L and 2 units of K is 200.
15. (a) What is the relation between MPC and MPS?
Ans: Relation between MPC and MPS : MPS+MPC=1 OR MPC=1-MPS OR MPS=1-MPC
(b) What is the investment?
Ans: Investment refers to expenditure incurred by the producers on the purchase of capital goods during a year. Three important elements of investment are revenues, cost and expectations.
(c) What do you mean by “velocity of circulation” of money?
Ans: Velocity of Circulation of money refers to the average number of times a single unit of money changes hands in an economy during a given period of time. It can also be called velocity of money or the velocity of circulation of money.
(d) Who is known as the “lender of last resort”?
Ans: This function of the central bank originated out of the rediscounting function performed by the central bank. Their discount facility raises the liquidity of the credit structure. It provides additional funds to banks for converting the same of their earning assets into cash, when the cash reserves fall drastically.
(e) What is the government budget?
Ans: Budget is a statement of estimates of the government receipts and government expenditure during the period of the financial year. The finance Minister presents the budget both in the Lok Sabha and Rajya sabha.
(f) In which year GST came into effect in India?
Ans: 1 July 2017.
16. Define intermediate good. How are intermediate goods different from capital goods?
Ans: Intermediate goods: These goods are used for the production of other goods. They are not available for immediate consumption.
Intermediate goods are used for the production of other goods and Capital goods are defined as all goods produced for use in future production processes.
17. What is an investment multiplier? If Rs 200 crore increase in investment increases income by 800 crore, then what will be the value of investment multiplier?
Ans: It is believed that an initial increment in investment leads to a greater increase in income. Multiplier express the relationship between increase in investment due to increase in income.
Multiplier (k) = Change in income / Change in investment
Or
Multiplier(k) = ΔY / ΔI
ΔY = 800
ΔI = 200
Multiplier (k) = Change in income / Change in investment
= 800 / 200
= 4
18. Write the differences between ex-ante investment and ex-post investment.
Ans: The differences between ex-ante investment and ex-post investment are as followers:
| Ex-ante Investment | Ex-post Investment |
| It refers to the planned or intended investment during a particular period of time. | It refers to the actual level of investment during a particular period of time. |
| It is imaginary (intended), in which a firm assumes the level of investment on its own. | It is factual or original that signifies the existing investment of a particular time. |
| It is planned on the basis of future expectations. | It is the actual result of variables. |
19. Mention two points of superiority of selective Credit Measures over Quantitative Credit Control measures.
Ans: Selective credit control is meant to control the credit creation by means of qualitative control methods. So as to control the inflationary pressure in a country by checking the bank credit to non-essential uses
(i) These controls can correct the sectoral imbalances arising out of economic progress. They can also stabilize the relative prices.
(ii) It has got flexibility which makes the Selective Credit Controls (SCCs) very popular to control the stresses and strains of a growing economy.
(iii) The SCCs can Control the demand for loans and supply of loans. They have significantly widened the scope of monetary policy.
(iv) Undesirable activities like speculation hoarding and unwanted development of some sectors can be restricted by the adoption of SCCs.
20. Write two differences between revenue expenditure and capital expenditure.
Ans: Difference between Capital Expenditure and Revenue Expenditure:
| Capital Expenditure | Revenue Expenditure |
| Expenditure is incurred to acquire assets, and enhance the capacity of an existing asset resulting in increasing its lifespan | Expense incurred to maintain the day to day business activities |
| Enhances the existing asset value | Does not enhance the existing asset value |
21. What do you mean by devaluation of currency? How does it affect the import of a country?
Ans: When any government intentionally declares its own currency cheaper in terms of the foreign currency than the process is called devaluation of currency. In different words, this is also called as the reduction of the reduction value in currency.
A country’s importing and exporting activity can influence its GDP, its exchange rate, and its level of inflation and interest rates. A rising level of imports and a growing trade deficit can have a negative effect on a country’s exchange rate.
22. Define GDP, Can GDP be used as an index of welfare of a country? Justify your answer.
Ans: Gross Domestic Product (GDP) is the price value of all the goods and services produced in a country in the past year.
The limitations of using GDP as an index of welfare of a country can be divided under following headings:
(i) Non monetary exchanges
GDP measures the goods and services produced in an economy during a particular period of time. However, it does not take into account those transactions that do not come under monetary terms. In less developed countries there are non-monetary exchanges, particularly in rural areas. Hence, these transactions remain outside the domain of GDP. The household sector and volunteer sectors get ignored in GDP.
(ii) Inflation
GDP does not take into account the level of prices in a country. Because of inflation, the cost of living increases leading to a decrease in the standard of living. The loss of welfare due to this decrease is not taken into consideration by GDP as an index of welfare.
(iii) Externalities
Increase in the national income is associated with increased levels of pollution, accidents, disasters, shortage and depletion of natural resources, etc. These factors affect human health and lead to ecological degradation. GDP fails to consider the costs or valuations of such factors.
(iv) Income pattern
GDP disregards the income distribution pattern. The increase in aggregate national income may be a result of the increase in income of a few individuals. Thus, this may lead to false interpretation of social welfare.
(v) Welfare
GDP ignores the welfare component as the goods and services produced may or may not add to the welfare to a society. For example, the production of goods, like guns, narcotic drugs, high-end luxurious goods increase the monetary value of production, but they do not add to the welfare of the majority of population.
23. How does the central bank use its quantitative credit control measures to control inflationary situation of an economy?
Ans: Quantitative credit control policy of central bank refers to the monetary policy which includes those instruments that focus on the overall supply of the money. It includes :-
A. Two Policy Rates: Bank rate is the rate charged on the loans offered by the Central bank to the commercial banks without any collateral. It is increased at the time of inflation to reduce the money supply in the economy and vice versa.
Repo rate is the rate charged on the secured loans offered by the Central bank to the commercial banks that includes collateral. It is increased at the time of inflation to reduce the money supply in the economy and vice versa.
B. Two Policy Ratio: Statutory Liquidity Ratio (SLR) refers to liquid assets that the commercial banks must hold on daily basis as a percentage of their total deposits. SLR is determined by the central bank and is a legal requirement to be fulfilled by the commercial banks. It is increased at the time of inflation to reduce the money supply in the economy and vice versa.
Cash Reserves Ratio (CRR) refers to the proportion of total deposits of the commercial banks which they must have keep as cash reserves with the central bank. The ratio is fixed by the central bank and is varied from time to time to control the supply of money in the economy depending upon the prevailing situation of inflation or deflation.
C. Open Market Operations: Open market operation (OMO) is a monetary policy by the central bank in which the bank deals in the sale and purchase of securities in the open market to control the supply of money in the economy. By selling the securities, the central bank soaks liquidity from the economy and by buying the securities, the central bank releases liquidity.
Or
Write a note on ‘demonetization’.
Ans: The term demonetisation refers to the act of stripping a currency unit of its status as legal tender. In simple terms, you can say that when demonetisation of a currency occurs, the currency loses its face value and is no longer of the status to be used as legal money for any kind of transactions. This usually happens when there is change of any national currency, which involves withdrawal of the existing form or forms of money that is currently being circulated and replacement of those forms with new notes or coins. Rarely, it may happen that a country will entirely replace its old currency with new currency.
Demonetisation is often considered as a drastic intervention in the country’s economy as it involves removing the legal tender status of the currency and can affect the day to day business activities in the economy. If demonetisation goes wrong, it can cause a chaos or serious downturn in an economy. The chances of this happening are even more when demonetisation is announced suddenly, without any prior warning. The process that is opposite to demonetisation is called remonetisation which refers to the act of restoring a payment form as a legal tender.
Demonetisation is often believed to bring stability to a country’s currency and used as a tool to fight inflation, facilitate trade and give the economy a better access to the markets which will allow it to push informal economic activities into becoming more transparent and get them away from black and grey markets.
As we have already discussed above, demonetisation is used by economies for various reasons that they find valid for the progress and development of their nation. Although demonetisation can be harmful if gone wrong, it has also proved beneficial many times when used across the globe by different countries and their economies.
The Coinage Act, 1873 in the USA, demonetised silver as its legal tender and fully adopted gold standard. This was done to fight disruptive inflation which was as significant as the new silver deposits discovered in the Western America. The act suspended the circulation of various coins, including two-cent piece, three cent piece and half dime. This act that removed silver from being circulated in the economy led to contraction of money supply which in turn contributed to the downturn of the economy throughout the country. This is the reason why silver was remonetised as a legal tender through the Bland-Allison act in the year 1878. This remonissation was done in an effort to put an end to recession and political stress that was going around among farmers and silver miners.
24. What is a Deficit Budget? Why is deficit budget is considered beneficial than a surplus budget for a developing economy?
Ans: A deficit budget occurs when expenses exceed revenue and can indicate the financial health of a country. The term is commonly used to refer to government spending rather than businesses or individuals.
Budget deficits affect the national debt, the sum of annual budget deficits, and the cumulative total a country owes to creditors.
Deficit budget is one where the estimated government expenditure is more than expected revenue. Today almost all the countries of the world follow deficit budget instead of surplus or balanced budget.
Deficit Budget solves the problem of recession and depression which occurs mainly due to lack of effective demand. Increase in total expenditure of the government, increases employment and income of the people. As a result, the aggregate demand for consumer goods increases. Increase in total expenditure tends to expand aggregate economic activity in the economy.
The term budget surplus refers to a situation that occurs when income exceeds expenditures. The term is often used to describe a corporation or government’s financial state, unlike individuals who have savings instead of budget surpluses. A surplus indicates that a government’s finances are being effectively managed. The opposite of a budget surplus is a budget deficit, which commonly occurs when spending exceeds income.
25. Mention four differences between Direct taxes and Indirect taxes.
Ans: Differences between Direct taxes and Indirect taxes:
| Direct Tax | Indirect Tax |
| Paid directly to the government | Paid to the government via intermediary |
| Profits and income | Goods and services |
| Individuals, HUFs and businesses | End-consumers of products, goods and services. |
| Directly depends on income and profits | Same for everyone |
26. (i) What is balance of payment?
Ans: The balance of payments (BOP) is the method countries use to monitor all international monetary transactions at a specific period. Usually, the BOP is calculated every quarter and every calendar year.
All trades conducted by both the private and public sectors are accounted for in the BOP to determine how much money is going in and out of a country. If a country has received money, this is known as a credit, and if a country has paid or given money, the transaction is counted as a debit.
(ii) What are the two main components of balance of payment?
Ans: The two main components of a balance of payment account are:
(i) Current account
(ii) Capital account
(iii) Write two differences between balance of payment and balance of trade.
Ans: differences between balance of payment and balance of trade:
| Balance of payment | Balance of trade |
| Balance of Trade is a statement that captures the country’s export and import of goods with the remaining world. | Balance of Payment is a statement that keeps track of all economic transactions done by the country with the remaining world. |
| Transactions related to goods only. | Transactions related to both goods and services are recorded. |
Or
Write briefly about:
(i) Open Economy.
Ans: An open economy is a type of economy where not only domestic factors but also entities in other countries engage in trade of products (goods and services). Trade can take the form of managerial exchange, technology transfers, and all kinds of goods and services. Certain exceptions exist that cannot be exchanged; the railway services of a country, for example, cannot be traded with another country to avail the service.
It contrasts with a closed economy in which international trade and finance cannot take place. The act of selling goods or services to a foreign country is called exporting. The act of buying goods or services from a foreign country is called importing. Exporting and importing are collectively called international trade.
(ii) Exchange Rate.
Ans: An exchange rate is a rate at which one currency will be exchanged for another currency and affects trade and the movement of money between countries.
Exchange rates are impacted by both the domestic currency value and the foreign currency value. In July 2022, the exchange rate from U.S. Dollars to the Euro was 1.02, meaning it takes $1.02 to buy €1.
27. Explain the procedure of calculating National Income by value-added method.
Ans: National income refers to the value of goods & services produced by a nation during a particular financial year. Therefore, it is the net result of all the economic activities that take place during a financial year and is valued in monetary terms. It includes payments made to various resources either in form of rents, wages, interests and profits. A country’s progress can be estimated by the growth of its national income.
According to Marshall, “The labor and capital of a country acting on its natural resources produce annually a certain net aggregate of commodities, material and immaterial including services of all kinds. This is the true net annual income or revenue of the country or national dividend.”
Identify and classify the production units into primary, secondary and tertiary sectors.
Estimate Gross Domestic Product at Market Price: Sum of Gross Value Added at MP = GDP at MP.
Calculate Domestic Income (NDP at FC), NDP at FC = GDP at MP – Depreciation – Net Indirect Taxes.
Estimate Net Factor Income from Abroad (NFIA) to arrive at National Income. NNP at FC = NDP at FC + NFIA.
The value-added method for calculating national income is also known as:
(i) Product Method
(ii) Inventory Method
(iii) Net Output Method
(iv) Industry Origin Method, and
(v) Commodity Service Method
Or
From the data given below calculated:
(1) GDP at factor cost.
(2) GNP at market price.
(3) NNP at factor cost.
| (a) Consumption Expenditure(b) Investment Expenditure(c) Government Expenditure(d) Export(e) Import(f) Net factor income from abroad(g) Indirect taxes(h) Subsidies(i) Depreciation | Rs. 2,000 croresRs. 1,200 croresRs. 450 croresRs. 80 croresRs. 95 croresRs. 60 croresRs. 90 croresRs. 80 croresRs. 30 crores |
Ans: Student do Yourself.
28. Explain the process of equilibrium income determination of an economy with the use of aggregate demand and aggregate supply curves.
Ans: Equilibrium means the state of balance or state of no change. By equilibrium of national income we refer to that level of national income which remains unchanged at a particular level. In a simple economy, there are two elements of national income consumption and investment. An economy is said to be in equilibrium when aggregate expenditure equals aggregate income or aggregate money value of all goods and services.
There are two alternative approaches of national income determination and the first approach determines equilibrium level by the equality of aggregate demand and aggregate supply of output.
Under this approach, the equilibrium level of income is determined at the point where Aggregate Demand (AD) is equal to Aggregate Supply (AS).
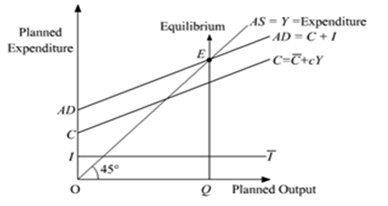
In the diagram, consumption curve is depicted by C and the investment curve is depicted by the horizontal straight line parallel to the output/income axis. Summing-up the investment curve and consumption curve, we get the Aggregate Demand curve represented by AD = C + I. The Aggregate Supply curve is represented by the 45° line. Throughout this line, the planned expenditure is equal to the planned output. The point E is the equilibrium point, where the planned level of expenditure (AD) is equal to the planned level of output (AS). Accordingly, the equilibrium level of output (income) is OQ.
In case, if AD > AS, then it implies a situation, where the total demand for goods and services is more than the total supply of the goods and services. This implies a situation of excess demand. Due to the excess demand, the producers draw down their inventory and increase production. The increase in production requires hiring more factors of production, thereby increases employment level and income. Finally, the income will rise sufficiently to equate the AD with AS, thus the equilibrium is restored back.
On the other hand, In case, if AS > AD, then it implies a situation, where the total supply of goods and services is more than the total demand for the goods and services. This implies a situation of deficit demand. Due to the deficit demand, the producers experience piling-up of stock of unsold goods, i.e. inventory accumulation. This would force the producers to cut-back the production, thereby results in the reduced employment of factors of production. This leads to fall in the income and output. Finally, the income and output will fall sufficiently to equate the AD with AS, thus the equilibrium is restored back.
Or
What is aggregate demand? Discuss the components of aggregate demand.
Ans: The word aggregate in the Aggregate Demand means ‘Total’, therefore, Aggregate Demand indicates the total demand of an economy. Aggregate Demand refers to the total demand for finished goods and services in the economy over a specific period. It also refers to a country’s Gross Domestic Product (GDP) demand. Aggregate demand is also known as Aggregate Expenditure (AE) as AE is the total expenditure incurred by all the sectors of the economy. The aggregate demand includes factors such as personal consumption, investment, government demand, and net exports. An economy’s aggregate demand increases when the variables’ sum increases.
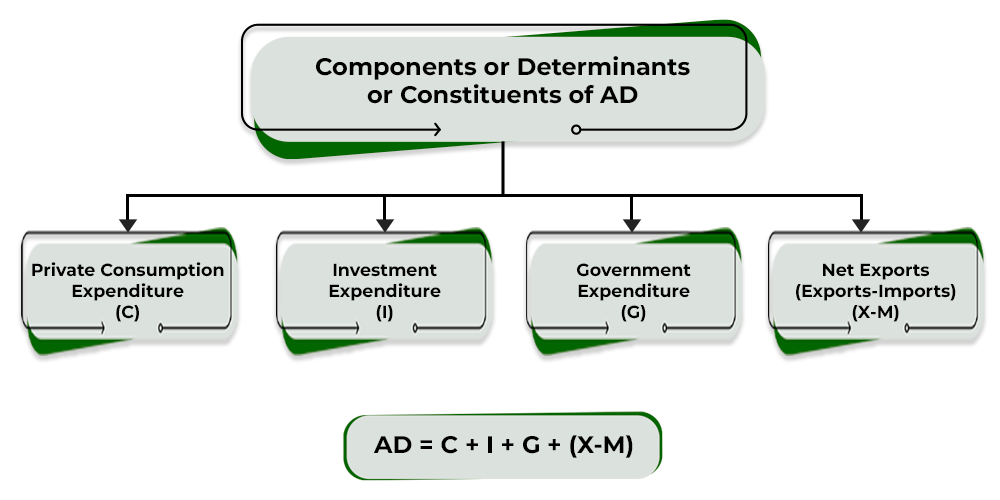
The Aggregate Demand of an economy is typically a sum of four components; viz., Government Expenditure (G), Consumption Expenditure (C), Investment Expenditure (I), and Net Export (X – M).

Hi! my Name is Parimal Roy. I have completed my Bachelor’s degree in Philosophy (B.A.) from Silapathar General College. Currently, I am working as an HR Manager at Dev Library. It is a website that provides study materials for students from Class 3 to 12, including SCERT and NCERT notes. It also offers resources for BA, B.Com, B.Sc, and Computer Science, along with postgraduate notes. Besides study materials, the website has novels, eBooks, health and finance articles, biographies, quotes, and more.


 Buy Now