Class 12 Geography Chapter 11 Population Structure of India The answer to each chapter is provided in the list so that you can easily browse throughout different chapters SCERT Class 12 Geography Chapter 11 Population Structure of India and select need one.
Class 12 Geography Chapter 11 Population Structure of India
Also, you can read the SCERT book online in these sections Solutions by Expert Teachers as per SCERT (CBSE) Book guidelines. These solutions are part of SCERT All Subject Solutions. Here we have given Assam Board/NCERT Class 12 Geography Chapter 11 Population Structure of India Solutions for All Subject, You can practice these here…
Population Structure of India
Chapter: 11
PART-2
GEOGRAPHY
TEXTUAL QUESTION & ANSWER
Q.1. The percentage figure of India’s geographical area of the world is
(a) 2.2%
(b) 4.31%
(c) 16%
(d) 22%
Ans :- (a) 2.2%
Q.2. The total population of India as per 2001 Census is
(a) 1027 million
(b) 201 million
(c) 7201 million
(d) 127 million
Ans :- (a) 1027 million.
Q.3. Which one of the following Indian states has the highest density of population?
(a) Assam
(b) West Bengal
(c) Punjab
(d) Kerala
Ans :- (b) West Bengal
Q.4. Which one of the following states records the highest proportion of urban population?
(a) Arunachal Pradesh
(b) Bihar
(c) Maharashtra
(d) Gujarat
Ans :- (c) Maharashtra
Q.5. Which one of the following is the largest linguistic group of India?
(a) Austric
(b) Indo-Aryan
(c) Sino-Tibetan
(d) Dravidian” r
Ans :- Indo-Aryan
VERY SHORT TYPE QUESTION & ANSWER
Q.6. Name two states of India, which have more than 30 districts.
Ans :- Maharashtra and Bihar.
Q.7. Name two states of India experiencing very wet climates.
Ans :- Meghalaya and Sikkim.
Q.8. Name two very cold regions of India.
Ans :- Kashmir and Tawang.
Q.9. Name the two union territories, which have geographical area more than 1000 square kilometers.
Ans :- Delhi and Goa.
Q.10. Name the two union territories, which have geographical areas less than 200 square kilometers.
Ans :- Chandigarh and Daman and Dice.
Q.11. Why could India have not emerged as a strong economic power?
Ans :- India has not emerged as a strong economic power because of its increased population growth rate.
Q.12. How is India a land of villages? What are its implications?
Ans :- India is a land of villages because over 72.2% of the population lives in more than 58% lakh villages of different sizes.It is a gigantic task to provide social services and amenities to all these village settlements.
SHORT TYPE QUESTION & ANSWER : (MARKS -3)
Q.13. Give a note on the population growth in India.
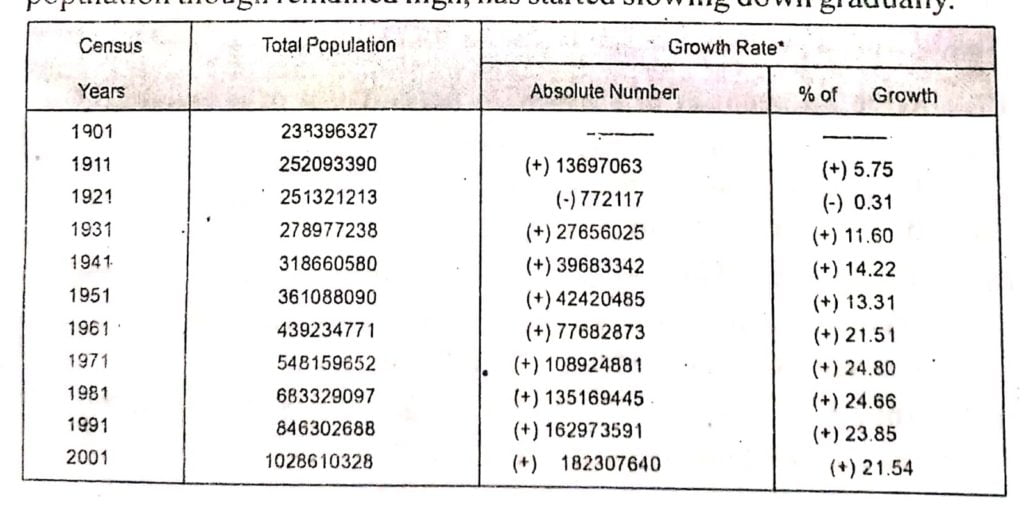
Ans :- Growth of population is the change in the number of people living in a particular area between two points of time. Its rate is expressed in percentage. It has two components, namely natural and induced. The growth of population in India is both very high and steadily increasing overtime. The annual growth rate of the country’s population is 2.4 percent. At this current rate of increase it is estimated that the country’s population will double itself in another 36 years and even surpass the population of China. The growth rate of population in India over the last one century has been caused by annual birth rate and death rate and rate of migration and thereby shows different trends. There are four distinct phases of growth identified within this period.
Phase – I : The period from 1901- 1921, is referred to as a period of stagnant or stationary phase of growth of India’s population, since in this period growth rate was very low even recording a negative growth rate during 1911-1921.
Phase – II : The decades 1921-1951, are referred to as the period of steady population growth.
Phase – III : The decades 1921-1951, are referred to as the period of population explosion in India.
Phase – IV : In the post 1981 till present the growth rate of the country’s population though remained high, has started slowing down gradually.

Q.14. Discuss in short the working population of India.
Ans :- It is observed that in India, the proportion of workers (both main and marginal) is only 39 percent (2001) leaving a vast majority of 61 percent as non-workers. This indicates an economic status in which there is a larger proportion of dependent population, further indicating possible existence of a large number of unemployed or underemployed people.
The proportion of working population of the states and Union Territories show a moderate variation from about 25 percent in Goa to about 53 percent in Mizoram.
About 58.2 percent of total working population are cultivators and agricultural labourers, whereas only 4.2% of workers are engaged in household industries and 37.6% are other workers including non-household industries, trade, commerce, construction and repair and other services.
Q.15. Give a note on the population density pattern in India.
Ans :- Density of population is expressed as man-land ratio or number of persons per unit area. It helps in getting a better understanding of the spatial distribution of population in relation to land. Density of population in India (2001, census) is 324 persons per sq. km. There has been a steady increase of about 200 persons per sq. km over the last 50 years as the density of population increased from 117 person / sq. km in 1951 to 324 persons / sq. km in 200%.
Q.16. Give a brief note on the population growth pattern of India.
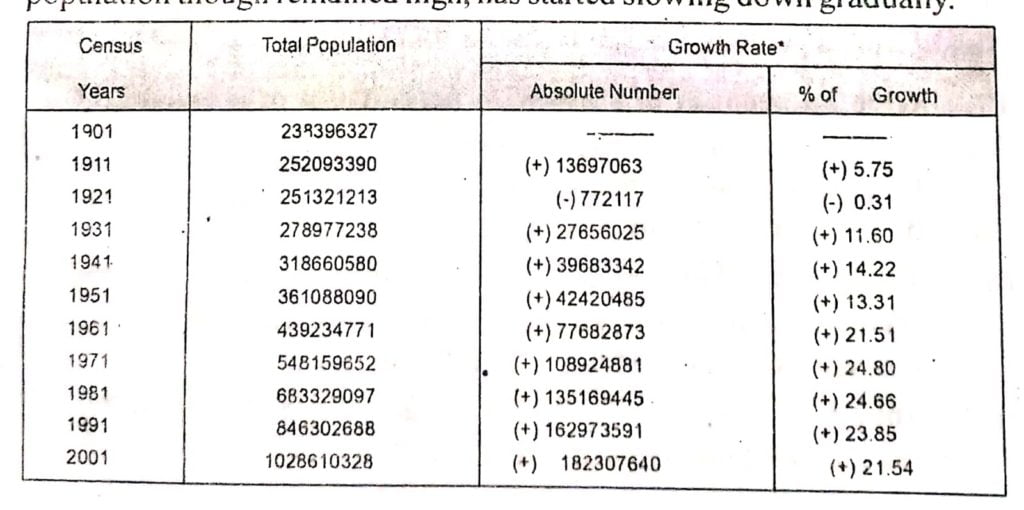
Ans :- Growth of population is the change in the number of people living in a particular area between two points of time. Its rate is expressed in percentage. It has two components, namely natural and induced. The growth of population in India is both very high and steadily increasing overtime. The annual growth rate of the country’s population is 2.4 percent. At this current rate of increase it is estimated that the country’s population will double itself in another 36 years and even surpass the population of China. The growth rate of population in India over the last one century has been caused by annual birth rate and death rate and rate of migration and thereby shows different trends. There are four distinct phases of growth identified within this period.
Phase – I : The period from 1901- 1921, is referred to as a period of stagnant or stationary phase of growth of India’s population, since in this period growth rate was very low even recording a negative growth rate during 1911-1921.
Phase – II : The decades 1921-1951, are referred to as the period of steady population growth.
Phase – III : The decades 1921-1951, are referred to as the period of population explosion in India.
Phase – IV : In the post 1981 till present the growth rate of the country’s population though remained high, has started slowing down gradually.

Q.17. Give an account of state wise proportion of workers.
Ans :- State-wise proportion of workers :
(i) Proportion of workers is about 25% in Goa.
(ii) It is 53% in Mizoram.
(iii) The states with larger percentages of workers are Himachal Pradesh, Sikkim, Chattisgarh. Andhra Pradesh, Karnataka, Arunachal Pradesh, Nagaland, Manipur and Meghalaya.
(iv) Among the Union Territories, Dadra and Nagar Haveli and Woman and Diu have higher participation rates.
The work participation rate tends to be higher in the areas of lower levels of economic development since a number of manual workers are needed to perform the subsidence or near subsistence economic activities.
(IV) About 58.2% of the total working population are cultivators and agricultural labourers.
Q.18. Give a note on the urban-rural differences.
Ans :- It may be noted that contrary to rural population, the proportion of urban population (27.8%) in India is quite low but its showing a much faster rate of growth over the decades. In fact since 1931, the growth rate of urban population has accelerated due to enhanced economic development and improvement in health and hygienic conditions. People from rural areas migrate to urban areas in large numbers. Hence growth has always been lower in rural areas as compared to urban areas.
See Next Page No Below…

Hi, I’m Dev Kirtonia, Founder & CEO of Dev Library. A website that provides all SCERT, NCERT 3 to 12, and BA, B.com, B.Sc, and Computer Science with Post Graduate Notes & Suggestions, Novel, eBooks, Biography, Quotes, Study Materials, and more.


