
SEBA Class 10 Maths Chapter 13 Statistics Solutions English Medium As Per New Syllabus. to each chapter is provided in the list so that you can easily browse through different chapters SEBA Class 10 Maths Chapter 13 Statistics Notes and select need one. SEBA Class 10 Maths Chapter 13 Statistics Question Answers Download PDF. SEBA Class 10 General Mathematics Solutions.
SEBA Class 10 Maths Chapter 13 Statistics
Also, you can read the SEBA book online in these sections Solutions by Expert Teachers as per Board of Secondary Education, Assam (SEBA) Book guidelines. SEBA Class 10 Maths Chapter 13 Statistics are part of All Subject Solutions. Here we have given SEBA Solutions For Class 10 Maths for All Chapters, You can practice these here.
Class 10 Mathematics Video Classes
Step-by-step easy concept explanation aur full questions Answer ke liye watch karein ya app download karein:

Statistics
Chapter: 13
| Exercise 13.1 |
1. A survey was conducted by a group of students as a part of their environment awareness programme, in which they collected the following data regarding the number of plants in 20 houses in a locality. Find the mean number of plants per house.
| Number of plants | 0 – 2 | 2 – 4 | 4 – 6 | 6 – 8 | 8 – 10 | 10 – 12 | 12 – 14 |
| Number of houses | 1 | 2 | 1 | 5 | 6 | 2 | 3 |
Which method did you use for finding the mean, and why?
Ans: To find the class mark (xi) for each interval, the following relation is used.
Class mark 𝒙1 =𝑼𝒑𝒑𝒆𝒓 𝒍𝒊𝒎𝒊𝒕+𝑳𝒐𝒘𝒆𝒓 𝒍𝒊𝒎𝒊𝒕/ 2
| Number of plants | Number of houses (f1) | x1 | f1xx1 |
| 0 − 2 | 1 | 1 | 1 × 1 = 1 |
| 2 − 4 | 2 | 3 | 2 × 3 = 6 |
| 4 − 6 | 1 | 5 | 1 × 5 = 5 |
| 6 − 8 | 5 | 7 | 5 × 7 = 35 |
| 8 − 10 | 6 | 9 | 6 × 9 = 54 |
| 10 − 12 | 2 | 11 | 2 ×11 = 22 |
| 12 − 14 | 3 | 13 | 3 × 13 = 39 |
| Total | 20 | 162 |
From the table, it can be observed that:
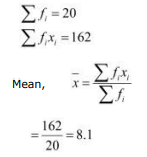
Therefore, the mean number of plants per house is 8.1.
2. Consider the following distribution of daily wages of 50 workers of a factory.
| Daily wages (in Rs) | 100 − 120 | 120 − 140 | 140 −1 60 | 160 − 180 | 180 − 200 |
| Number of workers | 12 | 14 | 8 | 6 | 10 |
Ans: To find the class mark for each interval, the following relation is used.
X1 = upper limit + Lower Limit/2
Class size (h) of this data = 20
Taking 150 as assured mean (a), di, ui and fiui can be calculated as follows
| Daily wages (in Rs) | Number of workers (fi) | xi | di = xi − 150 | 𝒖𝒊 = 𝒅𝒊 /20=x1-150/20 | fiui |
| 100 −120 | 12 | 110 | − 40 | -2 | -24 |
| 120 − 140 | 14 | 130 | − 20 | -1 | -14 |
| 140 − 160 | 8 | 150 | 0 | 0 | 0 |
| 160 −180 | 6 | 170 | 20 | 1 | 6 |
| 180 − 200 | 10 | 190 | 40 | 2 | 20 |
| Total | 50 | -12 |
From the table, it can be observed that:
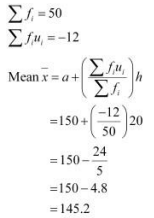
Therefore, the mean daily wage of the workers of the factory is Rs. 145.20
3. The following distribution shows the daily pocket allowance of children of a locality. The mean pocket allowance is Rs.18. Find the missing frequency f.
| Daily pocket allowance (in Rs) | 11 − 13 | 13 − 15 | 15 −17 | 17 − 19 | 19 − 21 | 21 − 23 | 23 − 25 |
| Number of workers | 7 | 6 | 9 | 13 | f | 5 | 4 |
Ans: To find the class mark (xi) for each interval, the following relation is used
X1 = Upper limit + Lower limit/2
Given that, mean pocket allowance,
Taking 18 as assured mean (a), di and f1d1 are calculated as follows.
| Daily pocket allowance (in Rs) | Number of children fi | Class mark xi | di = xi − 18 | fidi |
| 11 −13 | 7 | 12 | -6 | -42 |
| 13 − 15 | 6 | 14 | -4 | -24 |
| 15 − 17 | 9 | 16 | -2 | -18 |
| 17 −19 | 13 | 18 | 0 | 0 |
| 19 − 21 | f | 20 | 2 | 2f |
| 21 − 23 | 5 | 22 | 4 | 20 |
| 23 − 25 | 4 | 24 | 6 | 24 |
| Total | 2f-40 |
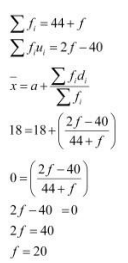
Hence, the missing frequency, f, is 20.
4. Thirty women were examined in a hospital by a doctor and the number of heart beats per minute were recorded and summarized as follows. Find the mean heart beats per minute for these women, choosing a suitable method.
| Number of heart beats per minute | 65 − 68 | 68 − 71 | 71 −74 | 74 − 77 | 77 − 80 | 80 − 83 | 83 − 8 |
| Number of women | 2 | 4 | 3 | 8 | 7 | 4 | 2 |
Ans: To find the class mark of each interval (xi), the following relation is used.
X1 = Upper limit + Lower limit/2
Class size, h, of this data = 3
Taking 75.5 as assumed mean (a) assumed (a) ui, f1u1 are calculated as follows.
| Number of heart beats per minute | Number of women fi | xi | di = xi − 75.5 | 𝒖𝒊 = 𝒅𝒊/3 | fiui |
| 65 − 68 | 2 | 66.5 | − 9 | -3 | -6 |
| 68 − 71 | 4 | 69.5 | − 6 | -2 | -8 |
| 71 − 74 | 3 | 69.5 | − 3 | -1 | -3 |
| 74 − 77 | 8 | 75.5 | 0 | 0 | 0 |
| 77 − 80 | 7 | 78.5 | 3 | 3 | 7 |
| 80 − 83 | 4 | 81.5 6 | 6 | 6 | 8 |
| 83 − 86 | 2 | 84.5 | 9 | 9 | 6 |
Therefore, mean heart beats per minute for these women are 75.9 beats per minute.
5. In a retail market, fruit vendors were selling mangoes kept in packing boxes. These boxes contained a varying number of mangoes. The following was the distribution of mangoes according to the number of boxes.
| Number of mangoes | 50 − 52 | 53 − 55 | 56 − 58 | 59 − 61 | 62 − 64 |
| Number of boxes | 15 | 110 | 135 | 115 | 25 |
Find the mean number of mangoes kept in a packing box. Which method of finding the mean did you choose?
Ans: It can be observed that class intervals are not continuous. There is a gap of 1 between two class intervals. Therefore, 1/2 has to be added to the upper class limit
and 1/2 has to be subtracted from the lower class limit of each interval.
Class mark (xi) can be obtained by using the following relation.
xi = Upper limit + Lower limit/2
Class size (h) of this data = 3
Taking 57 as assumed mean (a), di, ui, f1u1are calculated as follows
| Class interval | fi | xi | di = xi − 57 | 𝒖𝒊 = xi-57i/3 | fiui |
| 49.5 − 52.5 | 15 | 51 | -6 | -2 | -30 |
| 52.5 − 55.5 | 110 | 54 | -3 | -1 | -110 |
| 55.5 − 58.5 | 135 | 57 | 0 | 0 | 0 |
| 58.5 − 61.5 | 115 | 60 | 3 | 1 | 115 |
| 61.5 − 64.5 | 25 | 63 | 6 | 2 | 50 |
| Total 4 | 400 |
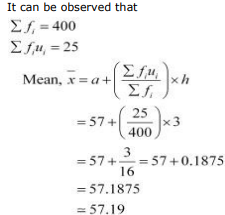
Mean number of mangoes kept in a packing box is 57.19. Step deviation method is used here as the values of fi, di are big and also, there is a common multiple between all.
6. The table below shows the daily expenditure on food of 25 households in a locality.
| Daily expenditure (in Rs) | 100 − 150 | 150 − 200 | 200 − 250 | 250 − 300 | 300 − 350 |
| Number of households | 4 | 5 | 12 | 2 | 2 |
Find the mean daily expenditure on food by a suitable method.
Ans: To find the class mark (xi) for each interval, the following relation is used.
xi = Upper limit + Lower limit/2
Class size = 50
Taking 225 as assumed mean (a), di, ui, f1u1are calculated as follows.
| Daily expenditure (in Rs) | f1 | xi | di = xi − 225 | 𝒖𝒊 = x𝒊-225/50 | f1u1 |
| 100 − 150 | 4 | 125 | -100 | -2 | -8 |
| 100 − 200 | 5 | 175 | -50 | -1 | -5 |
| 200 − 250 | 12 | 225 | 0 | 0 | 0 |
| 250 − 300 | 2 | 275 | 50 | 1 | 2 |
| 300 − 350 | 2 | 325 | 100 | 2 | 4 |
| Total | 25 | -7 |
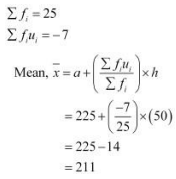
Therefore, mean daily expenditure on food is Rs 211.
7. To find out the concentration of SO2 in the air (in parts per million, i.e., ppm), the data was collected for 30 localities in a certain city and is presented below:
| Concentration of SO2 (in ppm) | Frequency |
| 0.00 − 0.04 | 4 |
| 0.04 − 0.08 | 9 |
| 0.08 − 0.12 | 9 |
| 0.12 − 0.16 | 2 |
| 0.16 − 0.20 | 4 |
| 0.20 − 0.24 | 2 |
Find the mean concentration of the SO2 in the air.
Ans:
| Concentration of SO2 (in ppm) | Frequency f | Class mark xi | di = xi − 0.14 | 𝒖𝒊 = x𝒊 -0.01/0.04 | fiui |
| 0.00 − 0.04 | 4 | 0.02 | -0.12 | − 3 | − 12 |
| 0.04 − 0.08 | 9 | 0.06 | -0.08 | − 2 | − 18 |
| 0.08 − 0.12 | 9 | 0.10 | -0.04 | − 1 | − 9 |
| 0.12 − 0.16 | 2 | 0.14 | 0 | 0 | 0 |
| 0.16 − 0.20 | 4 | 0.18 | 1 | 1 | 4 |
| 0.20 − 0.24 | 2 | 0.22 | 2 | 2 | 4 |
| Total | 30 | −31 |
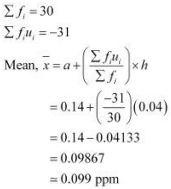
Therefore, the mean concentration of SO2 in the air is 0.099 ppm.
8. A class teacher has the following absentee record of 40 students of a class for the whole term. Find the mean number of days a student was absent.
| Number of days | 0 − 6 | 6 − 10 | 10 − 14 | 14 − 20 | 20 − 28 | 20 − 28 | 38 − 40 |
| Number of students | 11 | 10 | 7 | 4 | 4 | 3 | 1 |
Ans:
| Number of days | Number of students fi | Class-mark xi | fi xi |
| 0 – 6 | 11 | 3 | 33 |
| 6 – 10 | 10 | 8 | 80 |
| 10 – 14 | 7 | 12 | 84 |
| 14 – 20 | 4 | 17 | 68 |
| 20 – 28 | 4 | 24 | 96 |
| 28 – 38 | 3 | 33 | 99 |
| 38 – 40 | 1 | 39 | 39 |
| Total | ∑fi = 40 | ∑fixi = 499 |
Here, we use direct method to find the required mean.
Using the direct method, we have
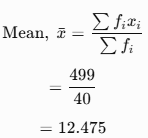
Therefore, the required mean number of days a student was absent is 12.475.
9.The following table gives the literacy rate (in percentage) of 35 cities. Find the mean literacy rate.
| Literacy rate (in %) | 45 − 55 | 55 − 65 | 65 − 75 | 75 − 85 | 85 − 95 |
| Number of cities | 3 | 10 | 11 | 8 | 3 |
Ans: To find the class marks, the following relation is used.
xi = Upper limit + Lower limit/2
Class size (h) for this data = 10
Taking 70 as assumed mean (a), di, ui, and fiui are calculated as follows.
| Literacy rate (in %) | Number of cities fi | x1 | di = x1 − 70 | 𝒖𝒊 = x𝒊 -70/10 | f1 u1 |
| 45 − 55 | 3 | 50 | -20 | -2 | -6 |
| 55 − 65 | 10 | 60 | -10 | -10 | -10 |
| 65 − 75 | 11 | 70 | -0 | 0 | 0 |
| 75 − 85 | 8 | 80 | 10 | 1 | 8 |
| 85 − 95 | 3 | 90 | 20 | 2 | 6 |
| Total | 35 | −2 |
From the table, we obtain
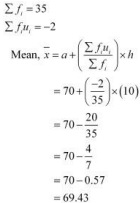
Therefore, the mean literacy rate is 69.43%.
10. Mean of 10 observations is 2.5. If one observation, namely 2.5 is deleted, determine the new mean.
Ans: Total of 10 observation
= 2.5 × 10
= 25
When 2.5 is deleted
Total of 9 observation
= 25 − 2.5
= 22.5
∴ New mean = 22.5/9
9 observation =2.5
11. If the mean of marks of five students is 33 and that of the marks of first four of them is 32.5, then find the marks obtained by the 5th student.
Ans: Mean of five students = 33
∴ Total marks obtained by 5 students = 5 × 33 = 165
Mean of four students = 32.5
∴ Total marks obtained by 4 students = 4 × 32.5 = 130
∴ Marks obtained by 5th student = 165 − 130 = 35
12. Mean of 25 observations was found to be 78.4. But later on it was discovered that 96 was misread as 69. Find the correct mean.
Ans: Mean of 25 observation = 78.4
∴ Total of 25 observation = 25 × 78.4 = 1960
Corrected value = 96 − 69
= 27
Corrected Total = 1960 + 27 = 1987
Mean of 25 observation when corrected = 1987/25 = 79.48
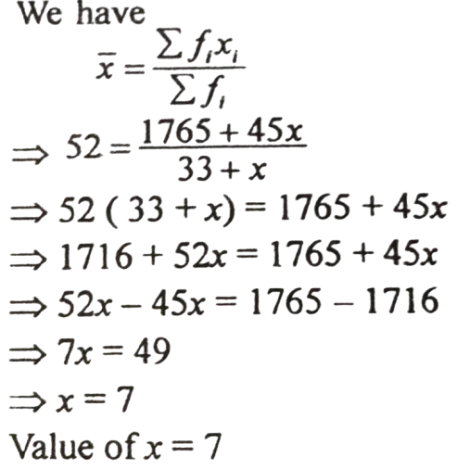
13. In the following frequency distribution, the frequency of the class interval (40–50) is missing. It is known that the mean of the distribution is 52. Find the missing frequency.
| Wages (in Rs) | No of workers |
| 10-20 | 5 |
| 20-30 | 3 |
| 30-40 | 4 |
| 40-50 | – |
| 50-60 | 2 |
| 60-70 | 6 |
| 70-80 | 13 |
Ans:
| C.I | f1 | x1 | f1x1 |
| 10-20 | 5 | 15 | 75 |
| 20-30 | 3 | 25 | 75 |
| 30-40 | 4 | 35 | 140 |
| 40-50 | x | 45 | 45x |
| 50-60 | 2 | 55 | 110 |
| 60-70 | 6 | 65 | 390 |
| 70-80 | 13 | 75 | 975 |
| ∑ f1 = 33 + x | ∑fixi = 1765 + 45x |
14. If be the mean of x1, x2 ……x, then the mean of x1 + a , x2 + a,……. xn + a, is
(a)
(b) – a
(c) + na
(d) + a
Ans: (d) + a
15. If the mean of x, x + 3, x + 6, x + 9 and x + 12 is 10, then the value of x is
(a) 5
(b) 4
(c) 9
(d) 8
Ans: (b) 4
Subject Ka Complete Video Solution Dekhein
Step-by-step easy concept explanation aur full questions Answer ke liye watch karein ya app download karein:

 Buy Now