
NCERT Class 6 Mathematics Chapter 4 Data Handling and Presentation Solutions in English Medium As Per CBSE New Syllabus to each chapter is provided in the list so that you can easily browse through different chapters NCERT Class 6 Mathematics Chapter 4 Data Handling and Presentation Notes and select need one. NCERT Class 6 Mathematics Chapter 4 Data Handling and Presentation Question Answers Download PDF. NCERT Class 6 Solutions for Maths in English Medium.
NCERT Class 6 Mathematics Chapter 4 Data Handling and Presentation
Also, you can read the NCERT book online in these sections Solutions by Expert Teachers as per Central Board of Secondary Education (CBSE) Book guidelines. NCERT Class 6 Mathematics Chapter 4 Data Handling and Presentation Textual Solutions are part of All Subject Solutions. Here we have given NCERT Class 6 Maths in English Medium Solutions. CBSE Class 6 Mathematics Textbook Solutions in English for All Chapters, You can practice these here.
Data Handling and Presentation
Chapter: 4
| TEXTUAL SOLUTIONS |
| Figure it Out (Page No. 75 – 76) |
1. What would you do to find the most popular game among Naresh’s and Navya’s classmates?
Ans: By organizing the data collected, using tally marks.
2. What is the most popular game in their class?
Ans: The most popular game in their class is hockey.
3. Try to find out the most popular game among your classmates.
Ans: Hockey.
4. Pari wants to respond to the questions given below. Put a tick (✓) for the questions where she needs to carry out data collection and put a cross (✗) for the questions where she doesn’t need to collect data. Discuss your answers in the classroom.
(a) What is the most popular TV show among her classmates?
Ans: What is the most popular TV show among her classmates?
(b) When did India get independence?
Ans: When did India get independence?
(c) How much water is getting wasted in her locality?
Ans: How much water is getting wasted in her locality?
(d) What is the capital of India?
Ans: What is the capital of India?
| Figure it Out (Page No. 76 – 77) |
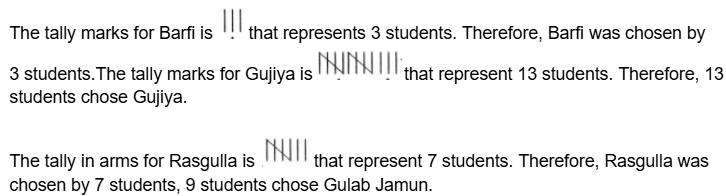
1. Complete the table to help Shri Nilesh to purchase the correct numbers of sweets:
Ans: From the given table, the number of students against Jalebi is 6. Therefore, 6 students chose Jalebi.
2. Is the above table sufficient to distribute each type of sweet to the correct student? Explain. If it is not sufficient, what is the alternative?
Ans: No, the table is not sufficient to distribute each type of sweet to the correct student. The table only shows the total number of students who like each sweet but does not specify which individual prefers which sweet.
To ensure each student receives the correct sweet, we need a more detailed list that includes each student’s name along with their preferred sweet.
| Figure it Out (Page No. 77 – 79) |
1. Sushri Sandhya asked her students about the sizes of the shoes they wear. She noted the data on the board.
| 4 | 5 | 3 | 4 | 3 | 4 | 5 | 5 | 4 |
| 5 | 5 | 4 | 5 | 6 | 4 | 3 | 5 | 6 |
| 4 | 6 | 4 | 5 | 7 | 5 | 6 | 4 | 5 |
She then arranged the shoe sizes of the students in ascending order.
3, 3, 3, 4, 4, 4, 4, 4, 4, 4, 4, 4, 5, 5, 5, 5, 5, 5, 5, 5, 5, 5, 6, 6, 6, 6, 7
Help her to figure out the following.
(a) The largest shoe size in the class is ________.
Ans: The largest shoe size in the class is 7.
(b) The smallest shoe size in the class is ________.
Ans: The smallest shoe size in the class is 3.
(c) There are ________ students who wear shoe size 5.
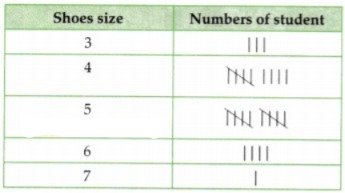
Ans: There are 10 students who wear shoe size 5.
(d) There are ________ students who wear shoe sizes larger than 4.
Ans: There are 15 students who wear shoe sizes larger than 4.
2. How did arranging the data in ascending order help to answer these questions?
Ans: Let’s arrange the data in ascending order:
3, 3, 3, 4, 4, 4, 4, 4, 4, 4, 4, 4, 5, 5, 5, 5, 5, 5, 5, 5, 5, 5, 6, 6, 6, 6, 7
It takes a bit more time to answer as compared to the frequency table.
3. Are there other ways to arrange the data?
Ans: Yes, the given data can also be arranged in a frequency distribution table using tally marks.
4. Write the names of a few trees you see around you. When you observe a tree on the way from your home to school (or while walking from one place to another place), record the data and fill in the following table-
| Tree | No of Trees |
| Peepal | |
| Neem | |
| … | |
| …. |
(a) Which tree was found in the greatest number?
(b) Which tree was found in the smallest number?
(c) Were there any two trees found in the same numbers?
Ans: Do it by yourself.
Questions (Page 80)
1. Which mode of travel is used by the most number of students?
Ans: In the table given on Page 79, the number of symbols for the school bus is maximum. Therefore, the school bus is used as a mode of travel by the most number of students.
2. Which mode of travel is used by the least number of students?
Ans: In the table, given on Page 79, the number of symbols for cycle is minimum. Therefore, the cycle is used as a mode of travel by the least number of students.
| Figure it Out (Page No. 83 – 85) |
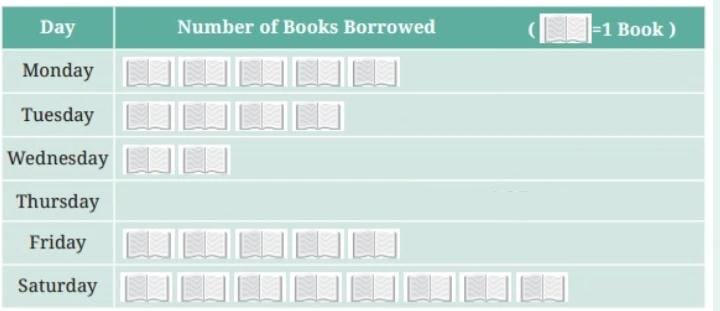
1. The following pictograph shows the number of books borrowed by students, in a week, from the library of Middle School, Ginnori-
(a) On which day was the minimum number of books borrowed?
(b) What was the total number of books borrowed during the week?
(c) On which day were the maximum number of books borrowed? What may be the possible reason?
Ans: (a) Thursday.
(b) Total number of books borrowed = 5 + 4 + 2 + 0 + 5 + 8 = 24 books.
(c) Saturday.
As the next day is the school holiday, they would have enough time to read the books.
2. Magan Bhai sells kites at Jamnagar. Six shopkeepers from nearby villages come to purchase kites from him. The number of kites he sold to these six shopkeepers are given below:
| Shopkeeper | Number of Kites sold |
| Chaman | 250 |
| Rani | 300 |
| Rukhsana | 100 |
| Jasmeet | 450 |
| Jetha Lal | 250 |
| Poonam Ben | 700 |
Prepare a pictograph using the symbol to represent 100 kites.
Answer the following questions:
(a) How many symbols represent the kites that Rani purchased?
(b) Who purchased the maximum number of kites?
(c) Who purchased more kites, Jasmeet or Chaman?
(d) Rukhsana says Poonam Ben purchased more than double the number of kites that Rani purchased. Is she correct? Why?
Ans: Pictograph.
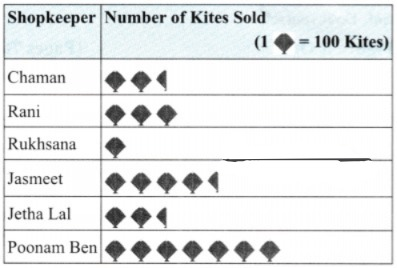
(a) 3 symbols represent the kites that Rani purchased.
(b) Poonam Ben purchased the maximum number of kites.
(c) In the pictograph the number of symbols for Jasmeet is more than the number of symbols for Chaman. Therefore, Jasmeet purchased more kites than Chaman.
(d) Yes, Rukhsana is correct.
Kites purchased by Poonam Ben = 700 Kites purchased by Rani = 300 Double of 300 is 600. Clearly, 700 is more than 600.
Hence, Poonam Ben purchased more than double the number of kites that Rani purchased.
Questions (Page 86)
Answer the following questions using the bar graph:
1. In Class 2, _______ students were absent that day.
Ans: In Class 2, 5 students were absent that day.
2. In which class were the maximum number of students absent? _______.
Ans: The bar for class 8 is the highest. Therefore, in class 8, the maximum number of students were absent.
3. Which class had full attendance that day? _______.
Ans: There is no bar for class 5. It means bar length for class 5 is 0. Therefore, class 5 had full attendance that day.
| Figure it Out (Page No. 88) |
1. How many total cars passed through the crossing between 6 am and noon?
Ans: Total cars passed = 600 + 700 + 800 + 1000 + 1200 + 150 = 4450 cars
2. Why do you think so little traffic occurred during the hours of 6-7 am, as compared to the other hours from 7 am to noon?
Ans: The traffic that occurs during the hours 6-7 am is very little, as it is early morning time and there are very few office goers. Also, there are very few.
3. Why do you think the traffic was the heaviest between 7 am and 8 am?
Ans: Traffic was heaviest between 7 am and 8 am as there were more people using their vehicles to reach their office or work place. Also, there are many school buses carrying children to their school.
4. Why do you think the traffic was lesser and lesser each hour after 8am all the way until noon?
Ans: Traffic was laser each hour after 8 am all the way until noon, because there were no school buses on road. Also, number of people going to their work place is decreasing continuously.
Use the bar graph (page 92) to answer the following questions:
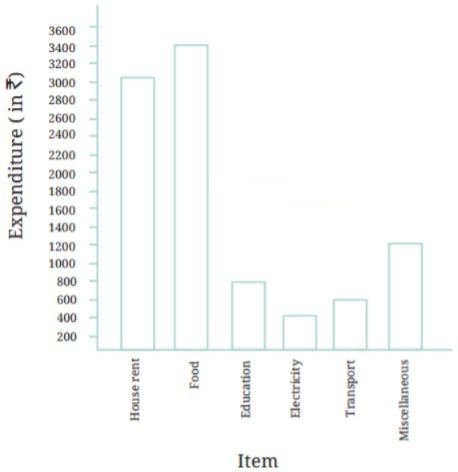
1. On which item does Imran’s family spend the most and the second most?
Ans: The highest bar is for food and the second highest is for the house rent. Therefore, Imran’s family spends the most on food and the second most on house rent.
2. Is the cost of electricity about one-half the cost of education?
Ans: In the bar graph, the height of the bar for electricity is 400 and the height of the bar for education 800. Therefore, the cost of electricity is one-half the cost of education.
3. Is the cost of education less than one-fourth the cost of food?
Ans: In the bar graph, the height of the bar for food (3400) is more than 4 times the height for the bar for education (800). Therefore, the cost of education is less than one- fourth the cost of food.
| Figure it Out (Page No. 93 – 99) |
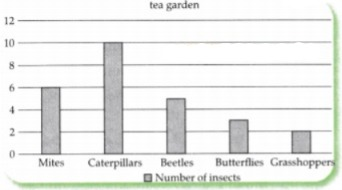
1. Samantha visited a tea garden and collected data of the insects and critters she saw there. Here is the data she collected-

| Mites | Caterpillars | Beetles | Butterflies | Grasshoppers |
| 6 | 10 | 5 | 3 | 2 |
Help her prepare a bar graph representing this data.
Ans:
2. Pooja collected data on the number of tickets sold at the Bhopal railway station for a few different cities of Madhya Pradesh over a 2-hour period.
| City | Vidisha | Jabalpur | Seoni | Indore | Sagar |
| Number of Tickets | 24 | 20 | 16 | 28 | 16 |
She used this data and prepared a bar graph on the board to discuss the data with her students, but someone erased a portion of the graph.
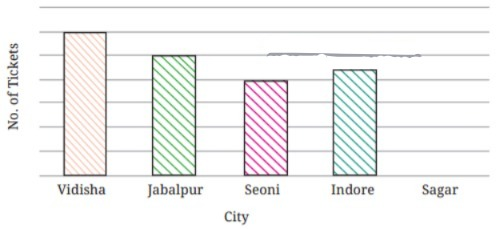
(i) Write the number of tickets sold for Vidisha above the bar.
(ii) Write the number of tickets sold for Jabalpur above the bar.
(iii) The bar for Vidisha is 6 unit lengths and the bar for Jabalpur is 5 unit lengths. What is the scale for this graph?
(iv) Draw the correct bar for Sagar.
(v) Add the scale of the bar graph by placing the correct numbers on the vertical axis.
(vi) Are the bars for Seoni and Indore correct in this graph? If not, draw the correct bar(s).
Ans: (i) The number of tickets sold for Vidisha is 24.
(ii) The data shows that 20 tickets were sold for Jabalpur. This number should be written above the corresponding bar on the graph.
Hence, the number of tickets sold for Jabalpur is 20.
(iii) If the bar for Vidisha (which represents 24 tickets) is 6 units long, then each unit represents 4 tickets.
Similarly, for Jabalpur, 20 tickets divided by 5 units, also equals 4 tickets per unit.
Hence, the scale for this graph is 4 tickets per unit length.
(iv) The bar for Sagar should be draw with a height of 4 units because 16 tickets were sold for Sagar and the scale is 4 tickets per unit.
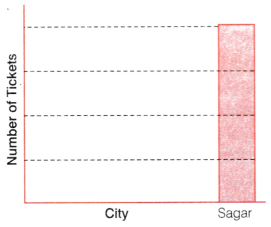
(v) The seals should be labeled on the vertical axis with each unit representing 4 tickets.
The numbers would be marked as 4, 8, 12,16, 20, 24, 28 and so on.
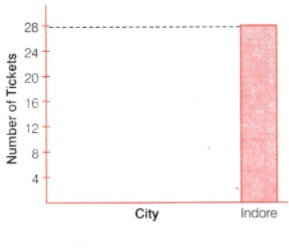
(vi) Seoni sold 16 tickets, so the bar should be 4 units high which is correct and Indore sold 28 tickets, so the bar should be 7 units high. Therefore, the bar for Indore is not correct.
The correct bar for Indone is given below.
3. China listed the various means of transport that passed across the road in front of his house from 9 am to 10 am:
| bike | car | bike | bus | bike | bike |
| bike | auto | bicycle | bullock cart | bicycle | auto |
| car | scooter | car | auto | bicycle | bike |
| car | auto | bike | scooter | bike | car |
| bicycle | scooter | bicycle | scooter | bike | bus |
| auto | auto | bike | bicycle | bus | bike |
| bicycle | scooter | car | scooter | auto | bike |
| scooter | bicycle | bike | bullock cart | auto | scooter |
| car | scooter | ||||
(a) Prepare a frequency distribution table for the data.
(b) Which means of transport was used the most?
(c) If you were there to collect this data, how could you do it?
Write the steps or process.
Ans: (a)
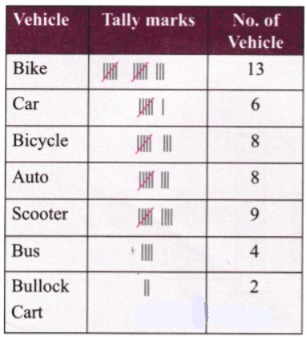
(b) Bike.
(c) Only like this.
4. Roll a die 30 times and record the number you obtain each time. Prepare a frequency distribution table using tally marks. Find the number that appeared:
(i) The minimum number of times.
(ii) The maximum number of times.
(iii) Find numbers that appeared an equal number of times.
Ans: Do yourself.
5. Faiz prepared a frequency distribution table of data on the number of wickets taken by Jaspreet Bumrah in his last 30 matches:
| Wickets Taken | Number of Matches |
| 0 | 2 |
| 1 | 4 |
| 2 | 6 |
| 3 | 8 |
| 4 | 3 |
| 5 | 5 |
| 6 | 1 |
| 7 | 1 |
(i) What information is this table giving?
Ans: The table shows the frequency of different numbers of wickets taken by jaspreet Bumrah in his last 30 matches.
(ii) What may be the title of this table?
Ans: ‘Number of wickets taken by Jaspreet Bumrah in his last 30 matches’ may be the title of this table.
(iii) What caught your attention in this table?
Ans: It is interesting to see which number of wickets he most commonly took.
The most striking part is that Bumrah took 3 wickets in 8 matches which is the highest frequency.
(iv) In how many matches has Bumrah taken 4 wickets?
Ans: Bumrah took 4 wickets in 3 matches.
(v) Mayank says ‘If we want to know the total number of wickets he has taken in his last 30 matches, we have to add the numbers 0,1, 2, 3 …, upto. Can Mayank get the total number of wickets taken in this way? Why?
Ans: No, Mayank cannot get the total number of wickets just by adding the numbers 0,1, 2, 3, upto 7 because he needs to multiply each number by its corresponding frequency first, then add those results.
(vi) How would you correctly figure out the total number of wickets taken by Bumrah in his last 30 matches, using this table?
Ans: To find the total number of wickets Multiply the number of wickets by the number of matches for each row.
Then, add up all these products.
e.g. (0 × 2) + (1 × 4) + (2 × 6) + (3 × 8) + (4 × 3) + (5 × 5) + (6 × 1) + (7 × 1) = 90
This will give us the total number of wickets taken across all 30 matches.
6. The following pictograph shows the number of tractors in five different villages.
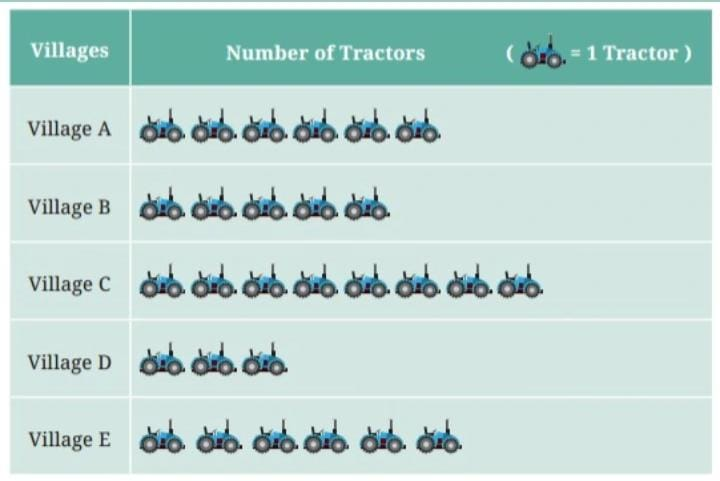
Observe the pictograph and answer the following questions-
(a) Which village has the smallest number of tractors?
(b) Which village has the most tractors?
(c) How many more tractors does Village C have than Village B?
(d) Komal says, “Village D has half the number of tractors as Village E.” Is she right?
Ans: (a) Village D
(b) Village C
(c) 3 more tractors
(d) Yes.
7. The number of female students in each class of a school is depicted by a pictograph:
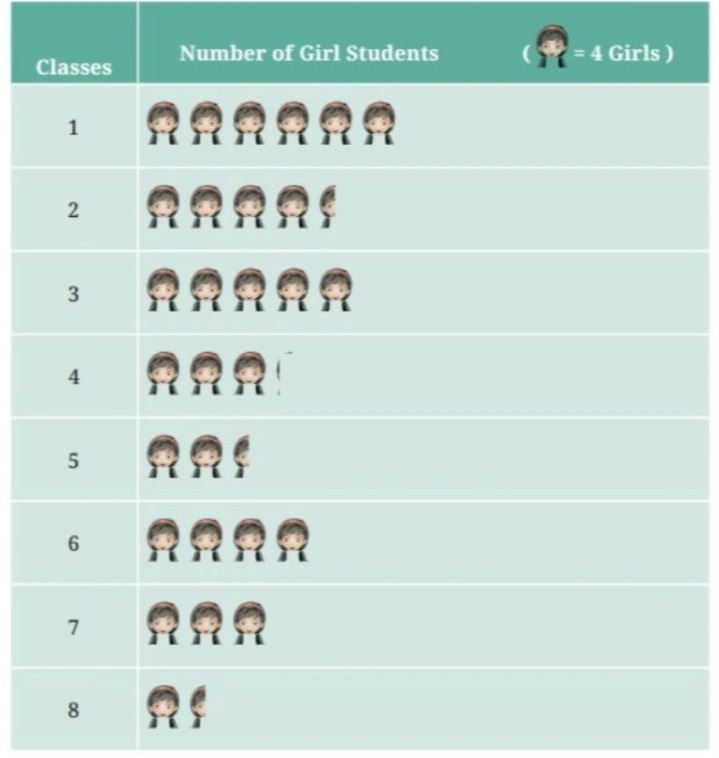
Observe this pictograph and answer the following questions:
(a) Which class has the least number of girl students?
(b) What is the difference between the number of girls in Classes 5 and 6?
(c) If 2 more girls were admitted in Class 2, how would the graph change?
(d) How many girls are there in Class 7?
Ans: (a) Class 8
(b) Number of Girls in class 6 = 4 × 4 = 16
Number of Girls in class 5 = 4 × 3.5 = 14
Hence difference = 16 – 14 = 2
(c) Five full symbols of a girl
(d) 3 × 4 = 12 girls.
8. Mudhol Hounds (a type of breed of Indian dogs) are largely found in North Karnataka’s Bagalkote and Vijaypura districts. The government took an initiative to protect this breed by providing support to those who adopted these dogs. Due to this initiative, the number of these dogs increased. The number of Mudhol dogs in six villages of Karnataka are as follows-
Village A : 18, Village B : 36, Village C : 12, Village D : 48,
Village E : 18, Village F : 24
Prepare a pictograph and answer the following questions:
(i) What will be a useful scale or key to draw this pictograph?
(ii) How many symbols will you use to represent the dogs in Village B?
(iii) Kamini said that the number of dogs in Village B and Village D together will be more than the number of dogs in the other 4 villages. Is she right? Give reasons for your response.
Ans: Pictograph [Image = 6 dogs]
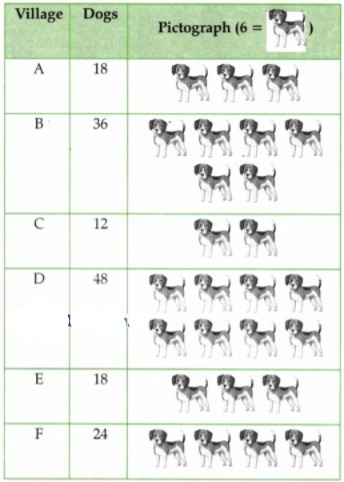
(i) The useful scale or key to draw this pictograph is 6 dogs = 1 symbol.
(ii) 6
(iii) Yes, Kamini is correct. The number of dogs in Village B and Village D together (36 + 48) = 84 and then the number of dogs in the other 4 villages were 18 + 12 + 18 + 24 = 72. Therefore 84 is greater 72.
9. A survey of 120 school students was conducted to find out which activity they preferred to do in their free time.
| Preferred Activity | Number of Students |
| Playing | 45 |
| Reading story books | 30 |
| Watching TV | 20 |
| Listening to music | 10 |
| Painting | 15 |
Draw a bar graph to illustrate the above data taking the scale of 1 unit length = 5 students. Which activity is preferred by most students, other than playing?
Ans: Required bar graph is given below.
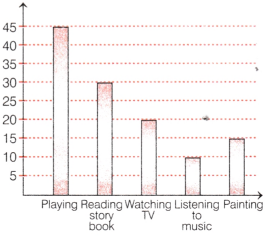
From the bar graph, it is clear that ‘Reading story book’ is the most preferred activity after playing.
10. Students and teachers of a primary school decided to plant tree saplings in the school campus and in the surrounding village during the first week of July. Details of the saplings they planted are as follows-
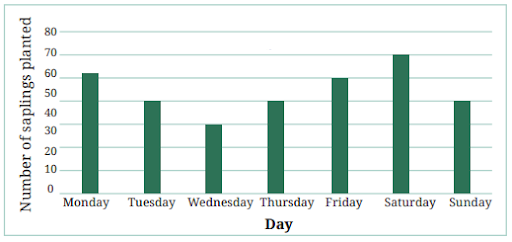
(a) The total number of saplings planted on Wednesday and Thursday is ________.
(b) The total number of saplings planted during the whole week is _______.
(c) The greatest number of saplings were planted on _____,and the least number of saplings were planted on _____.
Why do you think that is the case? Why were more saplings planted on certain days of the week and less on others? Can you think of possible explanations or reasons? How could you try and figure out whether your explanations are correct?
Ans: (a) 30 + 40 = 70 saplings
(b) 52 + 40 + 30 + 40 + 50 + 60 + 40 = 312 saplings
(c) Saturday, Wednesday.
11. The number of tigers in India went down drastically between 1900 and 1970. Project Tiger was launched in 1973 to track and protect tigers in India. Starting in 2006, the exact number of tigers in India was tracked. Shagufta and Divya looked up information about the number of tigers in India between 2006 and 2022 in 4-year intervals. They prepared a frequency table for this data and a bar graph to present this data, but there are a few mistakes in the graph. Can you find those mistakes and fix them?
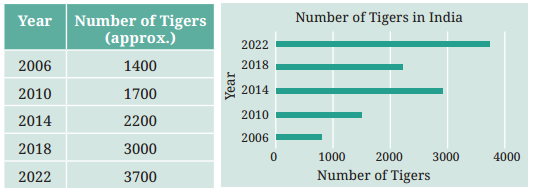
Ans: To correct the bar graph, follow the steps given below.
(i) Ensure that the bars are drawn with the correct heights corresponding to the number in the table.
2006 1400 (bar height should correspond to 1400)
2010 1700 (bar height should correspond to 1700)
2014 2200 (bar height should correspond to 2200)
2018 3000 (bar height should correspond to 3000)
2022 3700 (bar height should correspond to 3700)
(ii) Check that the scale on the X-axis, match the numbers provided.
(iii) Correct any inconsistencies in the graph, where the height of the bars does not match the number of tigers.
| Figure it Out (Page No. 103) |
1. If you wanted to visually represent the data of the heights of the tallest persons in each class in your school, would you use a graph with vertical bars or horizontal bars? Why?
Ans: To visually represent the data of the heights of tallest persons in each class, a bar graph with vertical bars is used. Because, it is more intuitive and visually appealing to represent heights which are measured upwards from the ground, using bar graphs that have vertical bars.
2. If you were making a table of the longest rivers on each continent and their lengths, would you prefer to use a bar graph with vertical bars or with horizontal bars? Why? Try finding out this information, and then make the corresponding table and bar graph! Which continents have the longest- rivers?
Ans: For making a table of the longest rivers on each continent and their lengths, bar graph with horizontal bars is used. This is because the length that are parallel to the ground, are usually best represented using bar graphs with horizontal bars.
Subject Ka Complete Video Solution Dekhein
Step-by-step easy concept explanation aur full questions Answer ke liye watch karein ya app download karein:


 Buy Now