NIOS Class 12 Economics Chapter 26 Consumption, Saving And Investment, Solutions to each chapter is provided in the list so that you can easily browse through different chapters NIOS Class 12 Economics Chapter 26 Consumption, Saving And Investment and select need one. NIOS Class 12 Economics Chapter 26 Consumption, Saving And Investment Question Answers Download PDF. NIOS Study Material of Class 12 Economics Notes Paper 318.
NIOS Class 12 Economics Chapter 26 Consumption, Saving And Investment
Also, you can read the NIOS book online in these sections Solutions by Expert Teachers as per National Institute of Open Schooling (NIOS) Book guidelines. These solutions are part of NIOS All Subject Solutions. Here we have given NIOS Class 12 Economics Chapter 26 Consumption, Saving And Investment, NIOS Senior Secondary Course Economics Solutions for All Chapters, You can practice these here.
Consumption, Saving And Investment
Chapter: 26
Module – X: Theory of Income And Employment
TEXT BOOK QUESTIONS WITH ANSWERS
INTEXT QUESTIONS 26.1.
Q. 1. Consumption depends on:
(a) Saving.
(b) Disposable income.
(c) Needs.
(d) None.
Ans. (b) Disposable income.
Q. 2. A person pay 20 per cent of his income as tax. If income is 2000, find out disposable income.
Ans. Tax = 2000 × (20/100)
= 400
Disposable income = 2000 – 400 = 1600.
Q. 3. Total income is same as disposable income if:
(a) Consumption = 0.
(b) Saving = 0.
(c) Tax and fines = 0.
(d) Income = 0.
Ans. (c) Tax and fine = 0.
Q. 4. Given that consumption is 500 and income in 700. Find out APC.
Ans. APC = 500/700 = 0.71
Q. 5. Give to increase in income from 100 to 1500, consumption has increased, from 750 to 900. Find out MPC.
Ans. MPC = 900 – 750/ 1500-1000
= 150/500
= 0.33
INTEXT QUESTIONS 26.2.
Q. 1. Write the equation for consumption function, C given that fixed consumption amount is 100, MPC = 0.75 and income is denoted as Y.
Ans. C = 100 + 0.75 y.
Q. 2. If fixed consumption is 50, MPC = 0.8 and income is 200, what will be the value of consumption?
Ans. C = 210.
Q. 3. What is the slope of consumption function called?
Ans. Consumption of function is a straight line originating from a point on the vertical axis and slopping upward from left to right rising at an angle equal to MPC.
Q. 4. Consumption function is a downward sloping line. (True or False)
Ans. False.
Q. 5. The distance between the origin and the point from which the consumption function starts on the vertical axis is a measure of:
(a) saving.
(b) income.
(c) fixed consumption.
(d) disposable income.
Ans. (c) fixed consumption.
INTEXT QUESTIONS 26.3.
Q. 1. Name two factor influencing consumption behaviour in the economy.
Ans. Wealth and distribution of income.
Q. 2. IMPC = 0.8 and fixed consumption ‘a’ is 200, write the saving equation.
Ans. 5 = 200 + (1 – 0.8)y = 200+ 0.2y.
Q. 3. APC = 1 – MPS. (True or False)
Ans. False.
Q. 4. MPS = 1 – APS. (True or False)
Ans. False.
Q. 5. MPC = 1 – MPS. (True or False)
Ans. True.
Q. 6. Given income as 500 and consumption as 300, find out APC.
Ans. 3/5 = 0.6.
Q. 7. Change in income is 150. Saving changes from 200 to 280. Find out MPS.
Ans. 8/15 = 0.53.
Q. 8. At break even point, consumption equal zero. (True or False)
Ans. False.
Q. 9. Give the relationship between propensity to consume and save.
Ans. The terms “marginal propensity to save” and “marginal propensity to consume” are economic terms used to discuss how an entity deals with surplus income. These terms are especially important components of Keynesian economics. Small business owners who understand them and their implications can use the terms to analyze how their businesses handle extra income.
Marginal Propensity to Consume: The marginal propensity to consume is used to determine what part of an entity’s extra money is consumed, or spent. MPC indicates how consuming changes as income changes. It can be expressed as the ratio of an entity’s change in spending over its change in income. For example, imagine a business began earning 200 extra per month. The business than begins to spend an extra 100 per month. The MPC is 50 per cent; of each extra dollar the company earns, about 50 cents is spent.
Marginal Propensity to Save: The marginal propensity to save, or MPS, is used to determine what part of an entity’s extra income is saved. MPS indicates how saving changes as income changes. MPS is the ratio of an entity’s change in savings to its change in income. For.example, if a business earns $ 200 of extra income a month and begins to save an additional ₹ 100 per month, the MPS is 50 per cent.
MPC and MPS have an inverse relationship. Because they add up to 100 per cent, as MPS increases, MPC decreases and vice-versa. For example, if a company earns an extra ₹200 per month in income and consumes, or spends, ₹100 extra per month, ₹100 per month is saved. The MPS and MPC are both 50 per cent. If the business starts to spend $150 per month, only $50 is saved. The MPC increases to 75 per cent, while the MPS decreases to 25 per cent.
INTEXT QUESTIONS 26.4.
Q. 1. Autonomous investment is independent of the level of income. (True or False)
Ans. True.
Q. 2. Induced investment in influenced by level of income. (True or False)
Ans. True.
TERMINAL EXERCISE
Q. 1. Define consumption function. Relate it with saving function.
Ans. Consumption function is the relationship between consumer spending and the income. The consumption function is however influenced by factors like wealth, expectations about the level and riskness of future income or wealth, interest rates, age, education and family size.
Q. 2. State and explain psychological law of consumption.
Ans. John Maynard Keynes, in 1936, proposed the psychological law in his work. The General Theory of Employment, Interest and Money. The law basically captures and understands the essential spending behaviour of the household sector. Keynes uses the term Psychology’ in his law but the law is just a basic observation of consumer behaviour and consumption. It states the relationship between income and consumption pattern, such as the changes in the aggregate income of the economy and expenditures on consumption by the household sector. The law is thus, a macro framework of the operation of the economy as it applies more to the aggregate economy than to the individuals. Therefore, in Keynesian macroeconomics, the fundamental psychological law underlying the consumption function states that Marginal Propensity to consume (MPC) and marginal propensity to save (MPS) are greater than zero (0) but less than one (1): MPC + MPS = 1; e.g., whenever national income rises by $1 part of this will be consumed and part of this will be saved.
Q. 4. What are the factors that influence propensity to consume? Discuss.
Ans. The factors that influence propensity to consume are:
1. Income: Income is the most important factor which determines the consumption expenditure in a society. The greater the level of disposable income, the higher is the consumption expenditure with a fall in income, the consumption demand of household goes down.
2. Distribution of income: Consumption function depends on the way in which the income is distributed. Greater the inequality in income distribution, lower will be the propensity to consume, greater the equality in income distribution, higher will be the propensity to consume. An equal distribution of income will raise consumption function because the poor people will increase their consumption expenditure more than the expenditure of the rich.
3. Wage level: If the wage rate arises, the consumption function shifts upward. If the rise in price level is more in proportionate to the rise in wage, the real wage will fall and consumption function will shift downward.
4. Rate of interest: A significant rise in interest rate will induce people to consume less and save more in order to gain from the higher rate interest. On the contrary, an increase in the interest rate may diminish investment and reduce income. Will the fall in income saving falls even at a higher rate of interest.
5. Holding of liquid assets: The consumption function also influenced by the holding of liquid assets, (Govt, bond, cash) When people have more liquid assets, they will spend more out of their current income and that their propensity to consume will increase. An increase in the real value of there assets will raise consumption expenditure.
6. Changes in expectation: Changes in future expectation also affect the consumption function. Expectation of emergency and fear of shortage of essential goods will induce people to purchase the goods much in excess of their current needs. This will shift the consumption upward.
7. Wind fall gains and losses: Windfall gains tend to arise the propensity to consume while widespread losses will shift the consumption function downward.
8. Fiscal policy: Heavy indirect taxation, rationing and price control adversely affect the propensity to consume. Progressive tax shifts the consumption function upward by bringing about more equitable distribution of income.
Subjective factors are indigenous or internal to economic system subjective factors determine the form of consumption function.
(i) People save to face, the unforeseen contingencies such as Illness, unemployed, accidents, etc.
(ii) People are induced to save because they want to provide for the future needs, i.e. education of the children, marriages of the children, etc.
(iii) To possess power or to get higher social or political status.
(iv) People are motivated to save so that they can accumulate large wealth which will increase their social states.
(v) To enioy an enlarged future income by investing funds of current income.
Q. 5. What do you mean by break even point? Compare consumption and income before and after that point. Also compare level of saving before and after the break even point.
Ans. When consumption expenditure becomes equal to income and there is no saving, it is called breakeven point.
The relationship between consumption and income is shown in Table and Fig below.
Table: Consumption Schedule
| Income (Y) (₹ Crores) | Consumption (C) (₹Crores) |
| 0 | 40 |
| 100 | 120 |
| 200 | 200 |
| 300 | 280 |
| 400 | 360 |
| 500 | 440 |
| 600 | 520 |
In Fig., national income is measured on X- axis and consumption expenditure on the Y-axis.
Important Observations from Table and Fig.
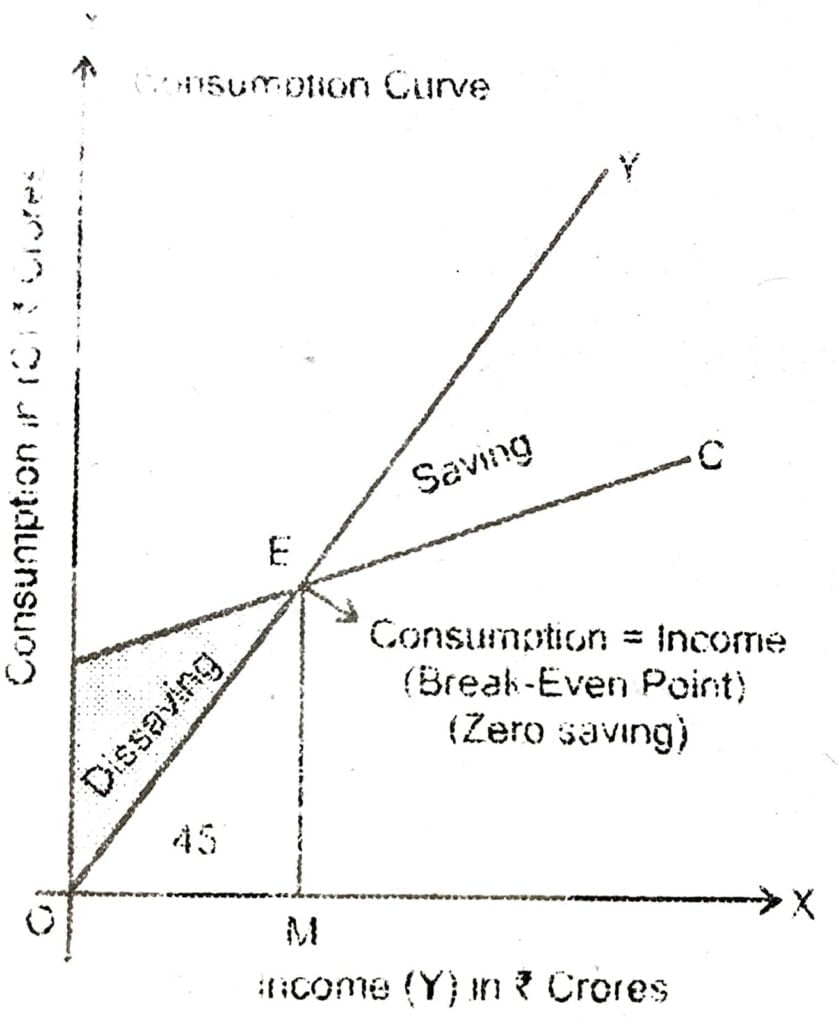
1. Starting Point of Consumption Curve: Consumption curve (CC) starts from point C on the Y-axis. This implies that there is autonomous consumption (c) of OC even when the national income is zero.
2. Slope of Consumption Curve: CC has a positive slope-which indicates that as income increases, consumption also rises. However, proportionate rise in consumption is less than proportionate rise in income as part of income is saved.
3. Income is less than Consumption: When income is less than consumption (i.e., at income levels less than OM in Fig. above and less than 200 crores in Table), the gap is covered by disserving (i.e., by utilizing previous saving). ACOE represents disserving.
4. Break-even point (C – Y): At OM level of income (as represented by point E), consumption becomes equal to income and saving is zero. The point E is known as the ‘Break-even point’. In Table, breakeven point occurs corresponding to income of 200 crores.
Break-Even Point refers to the point at which consumption is equal to national income. At this point, saving is zero.
5. Income is more than Consumption: At points to the right of point E, income is more than consumption. Excess of income leads to saving. The gap between the 45° line and CC line after point E represents positive saving.
6. Significance of 45° line: The 45° line is significant as it indicates whether consumption spending is equal to, greater than, or less than the level of income.
7. Do not confuse Consumption with Consumption Function: Consumption refers to the amount of income which is spent on purchase of goods and services at the given level of income. On the other hand, consumption function refers to the schedule showing consumption expenditures at various levels of income.
Q. 6. If a = 60, MPC 0.75 then write down the consumption and saving equations. Find the value of consumption and saving when income is 200.
Ans. Consumption Function Equation
C = a + bY
If a = 60, MPC = 0.75
C = 60 + 3Y/4
Saving Function Equation
S = – a + (1 – 6)Y
If a = 60, MPC = 0.75
S = – 60 + (1 – 3/4)Y
S = (Y/4) – 60
If income in 200,
Consumption (C)
= 60 + 3/4 (200)
= 60 + 150 = 210
Saving (S) = (200/4) – 60 = -10.
Q. 7. Distinguish between autonomous and induced investment.
Ans. Investment may be autonomous and induced. Usually, investment decision is governed by output and/or the rate of interest.
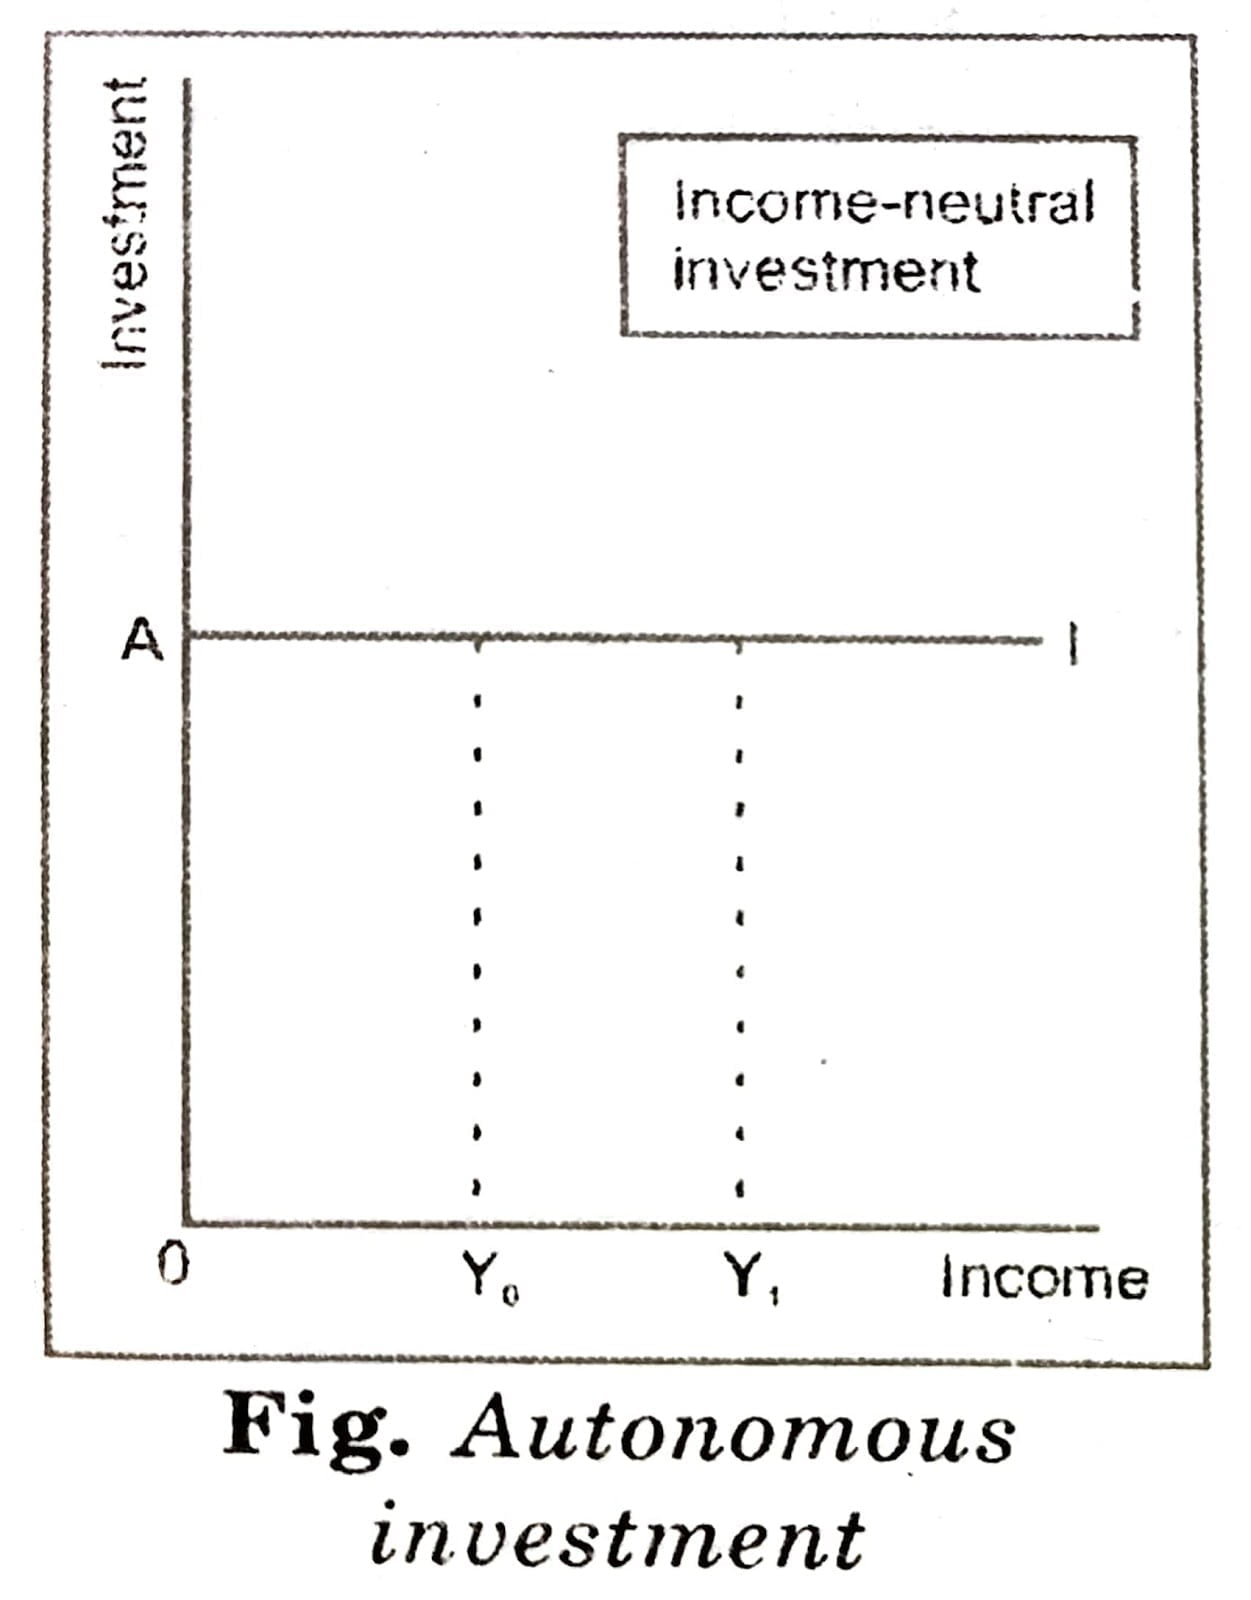
If investment does not depend either on income/output or the rate of interest, then such investment is called autonomous investment. Thus, autonomous investment is independent of the level of income.
It is evident from Fig. that, whatever the level of income, the level of autonomous investment has been fixed at OA. To describe this type of investment we have put a bar sign over the head of the curve I. Thus, autonomous investment, as per Fig., is income-neutral.
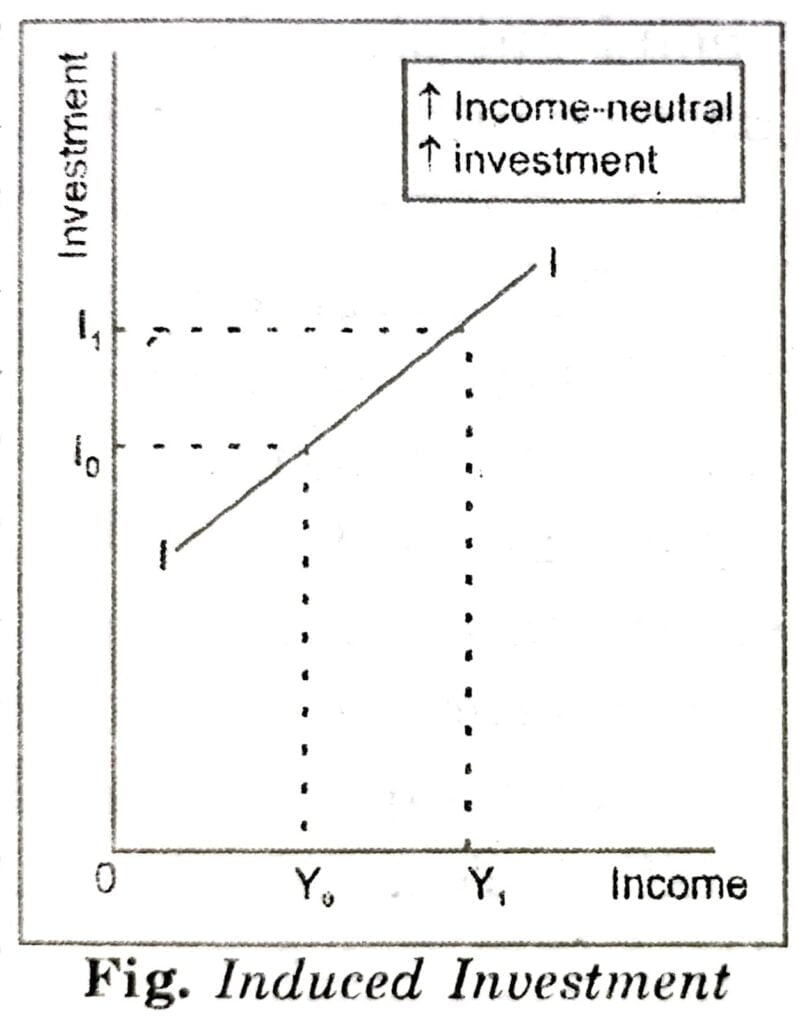
(i) Induced Investment: Investment that is dependent on the level of income or on the rate of interest is called induced investment. Investment that would respond to a change in national income or in the rate of interest is called induced investment. Fig. shows that; as national income rises from OY₀ to OY₁, (induced) investment increases from O1₀ to OI₁. Thus, investment that is income-elastic is called induced investment.
Q. 8. Draw the diagram of consumption function and saving function and explain these diagrams.
Ans. The consumption function refers to income consumption relationship. It is a functional relationship between two aggregates: total consumption and gross national income.
Symbolically, the relationship is represented as = f(Y), where C is consumption, Y is income, and the functional relationship. Thus, the consumption function indicates a functional relationship between and Y, where C is dependent at and Y is the independent variable, i.e., C is determined by Y. This relationship based on the ceteris paribus (other things being equal) assumption, as such only income consumption relationship is considered and all possible influence on consumption are held constant.
In fact, propensity to consume or consumption function is a schedule of the various amounts consumption expenditure corresponding to different levels of income. A hypothetical consumption schedule is given in Table.
Table: Consumption Schedule
| Income (Y) | Consumption C = f(V) |
| 0 | 20 |
| 60 | 70 |
| 120 | 120 |
| 180 | 170 |
| 240 | 220 |
| 300 | 270 |
| 360 | 320 |
Table shows that consumption is an increasing function of income because consumption expenditure increases with increase in income. Here, it is shown that when income is zero during the depression, people spend out of their past savings on consumption because they must eat in order to live.
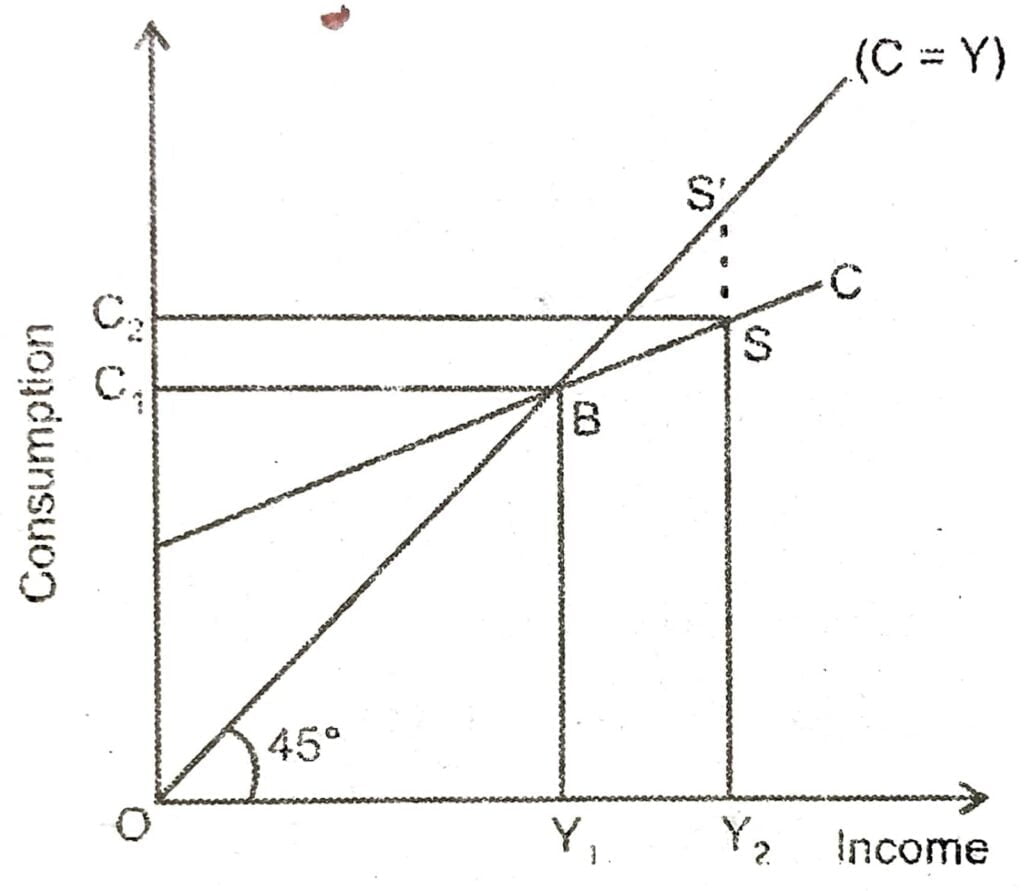
When income is generated in the economy to the extent of ₹60 crores, it is not sufficient to meet the consumption expenditure of the community so that the consumption expenditure of ₹70 crores is still above the income amounting to ₹60 crores (₹10 crores are dissaved). When both consumption expenditure and income equal ₹120 crores, it is the basic consumption level..After this, income is shown to increase by 60 crores and consumption by 50 crores. This implies stable consumption function during the short-run as assumed by Keynes. Figure illustrates the consumption function diagrammatically.
In the diagram, income is measured horizontally and consumption is measured vertically 45° is the unity line where at all levels income and consumption are equal. The curve is a linear consumption function based on the assumption that consumption changes by the same amount (₹ 50 crores).
Its upward slope to the right indicates that consumption is an increasing function of income, is the break-even point where C = Y or OY₁ = OC₁ When income rises to OY₁ consumption also increases to OC₂ but the increase in consumption is less than the increase in income, C₁C₂ < Y₁Y₂. The portion of income not consumed is saved as shown by the vertical distance between 45° line and C curve, i.e., SS’.
“Thus the consumption function measures not only the amount spent on consumption but also the amount saved. This is because the propensity to save is merely the propensity not to consume. The 45° line may therefore be regarded as a zero-saving line, and the shape and position of the curve indicate the division of income between consumption and saving”.
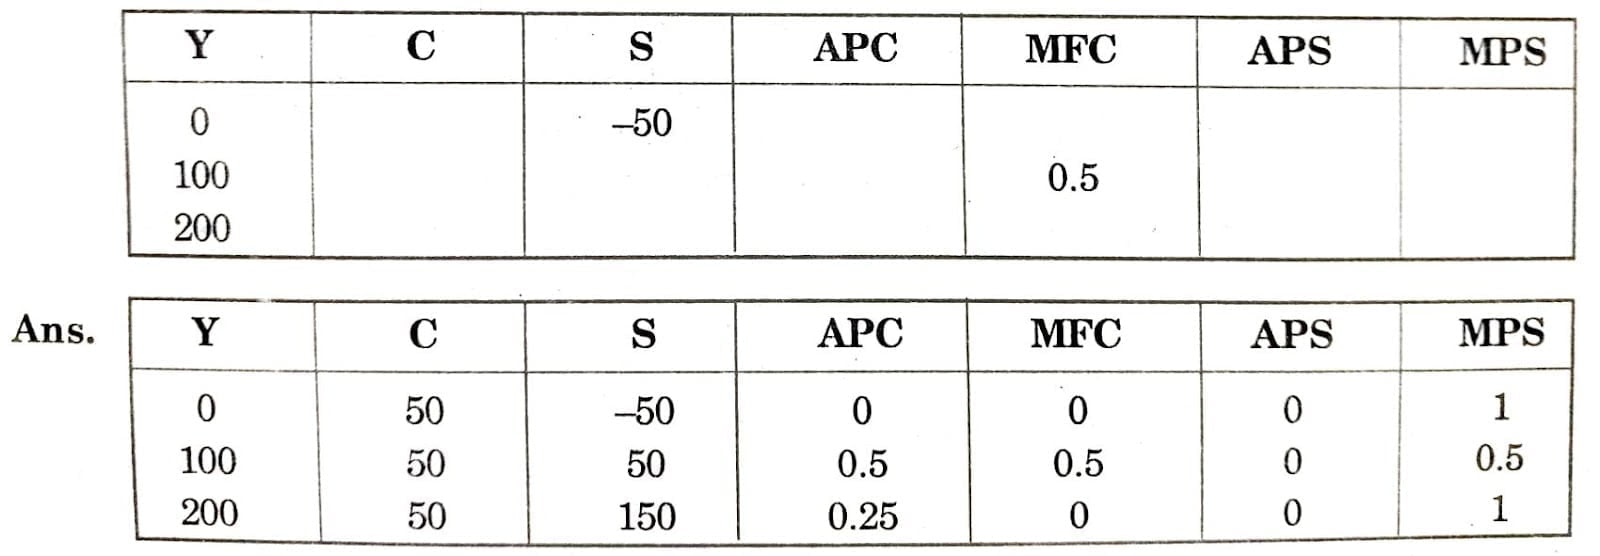
Q.9. Fill in the blanks in the table:
Q. 10. Distinguish between gross and net investment.
Ans. Gross investment refers to the total expenditure on buying capital goods over a specific period of time without considering depreciation. On the other hand, Net investment considers depreciations and is calculated by subtracting depreciation from gross investment. Gross investment refers to the amount invested in purchase or construction of new capital goods.
Net investment is also related to gross investment. It is basically gross investment minus the depreciation on existing capital. This depreciation is related to some investment which needs to be made in order to replace obsoleted or worn out assets like plants and machineries.
Or
we can say that, Net investment = gross investment – depreciation.
If gross investment is greater than depreciation over any period of time then it directly refers that the net investment is positive which further implies that the capital stock has increased.
Similarly, if gross investment is less that depreciation, then in that case the net investment tends to be negative and the capital stock declines.
To understand the difference, one can consider this example, a factory starts the year with 20 machines. It buys 5 machines. 10 machines are worn out. Now, the gross investment refers to the purchase of new machines which is 5, whereas at the end of the year the total number of working machines = 20 + 5 – 4 = 21. This leads to actual gain of 21 – 20 = 1 machine, which reflects the net investment.
Thus, gross investment is the total amount spent on goods in order to produce other goods and services, whereas net investment is the increase in productive stock.

Hi! my Name is Parimal Roy. I have completed my Bachelor’s degree in Philosophy (B.A.) from Silapathar General College. Currently, I am working as an HR Manager at Dev Library. It is a website that provides study materials for students from Class 3 to 12, including SCERT and NCERT notes. It also offers resources for BA, B.Com, B.Sc, and Computer Science, along with postgraduate notes. Besides study materials, the website has novels, eBooks, health and finance articles, biographies, quotes, and more.


