
NIOS Class 12 Economics Chapter 27 Theory of Income Determination, Solutions to each chapter is provided in the list so that you can easily browse through different chapters NIOS Class 12 Economics Chapter 27 Theory of Income Determination and select need one. NIOS Class 12 Economics Chapter 27 Theory of Income Determination Question Answers Download PDF. NIOS Study Material of Class 12 Economics Notes Paper 318.
NIOS Class 12 Economics Chapter 27 Theory of Income Determination


Also, you can read the NIOS book online in these sections Solutions by Expert Teachers as per National Institute of Open Schooling (NIOS) Book guidelines. These solutions are part of NIOS All Subject Solutions. Here we have given NIOS Class 12 Economics Chapter 27 Theory of Income Determination, NIOS Senior Secondary Course Economics Solutions for All Chapters, You can practice these here.
Theory of Income Determination
Chapter: 27
Module – X: Theory of Income And Employment
TEXT BOOK QUESTIONS WITH ANSWERS
INTEXT QUESTIONS 27.1.
Q. 1. Aggregate expenditure is a measure of aggregate demand .True/ false.
Ans. True.
Q. 2. What is the difference between exports and imports of an economy called?
Ans. Import refers to an item coming inside a country from any other country while export refers to an item going out of the country to any other country of the world. Since no country in the world is self sufficient, all countries both import as well as export.
If a country is rich in a particular ore as it has natural reserves of that ore in the form of mines, the country can export that ore to other countries of the world. This is particularly true of oil producing countries that are exporters of crude oil. However, all such countries are dependent on other countries for many other products and services which is why they need to import such items from other countries of the world.
Exports earn money for a country, while imports mean expenses. For example, India is a country that has a huge number of qualified manpower in the IT sector. This manpower exports its services to companies doing business in other countries thus earning foreign currency for India. On the other hand, India is dependent for oil and arms on other countries and needs to import them for its energy requirements as well as its army. It can spend the foreign currency it earns through exports to import goods and services it is deficient in. This is the basic concept behind exports and imports.
It is the endeavour of all countries of the world to achieve parity in their exports and imports. But in reality it is never so and this is where balance of payment creeps in. In an ideal situation, where exports equal imports, a country can utilize the money earned through exports to import goods and services it requires.
Q. 3. Whose demand is called final demand for goods and services.
(a) Firms.
(b) Government.
(c) Households.
(d) Rest of the world.
Ans. (c) Households.
Q. 4. The condition for equilibrium income is given as-
(a) C = S
(b) C + I = C + S
(c) C + S = S + 1
(d) S = Y
Ans. (b) C + I = C + S
INTEXT QUESTIONS 27.2.
Q. 1. What is the difference between aggregate demand and consumption is.called _____________?
Ans. Investment.
Q. 2. The rate at which aggregate demand increases is known as _______________?
Ans. MPC.
Q. 3. Differentiate between aggregate demand (AD) and Effective demand (ED)?
Ans. Aggregate Demand (AD) is the total demand for final goods and services in an economy at a given time. It specifies the amounts of goods and services that will be purchased at all possible price levels. This is the demand for the gross domestic product of a country. The aggregate demand curve is plotted with real output on the horizontal axis and the price level on the vertical axis. The aggregate demand curve illustrates the relationship between two factors-the quantity of output that is demanded and the aggregate price level. Aggregate demand is expressed contingent upon a fixed level of the nominal money supply. There are many factors that can shift the AD curve. Rightward shifts result from increases in the money supply, in government expenditure, or in autonomous components of investment or consumption spending, or from decreases in taxes.
Effective demand is the point where aggregate demand equals the level of output in the short run in a given price level. The equilibrium level of income reflects the effective demand in the economy.
INTEXT QUESTIONS 27.3.
Q. 1. If MPS = 0.5. What us multiplier?
Ans. Multiplier = 1/0.5 = 10/5 = 2
Q. 2. If MPS = 0.8, what is multiplier?
Ans. Multiplier = 1/0.8 = 10/8 = 5/2
Q. 3. If increase in investment is 50 crores and income increases from 1000 crores to 1200 crores then find out multiplier?
Ans. Multiplier = ∆Y/ΔΙ
= 1200 -1000/50 = 200/500 = 4
Q. 4. If MPC is more than multiplier is less. True/ False
Ans. False.
Q. 5. If MPS is higher, then multiplier is lower. True/ False
Ans. True.
Q. 6. Given that MPC = 0.8 and increase in investment in 100 crores find out increases in consumption in the second round? What is total increase in income after the rounds?
Ans. 80 crores, 180 crores.
INTEXT QUESTIONS 27.4.
Q. 1. Excess demand creates inflationary pressure. True/ False
Ans. True.
Q. 2. Deficiency in demand leads to increase in price. True/ False
Ans. False.
Q. 3. Increase in money supply creates excess demand. True/ False
Ans. True.
Q. 4. Decrease in credit supply leads to deflation. True/ False
Ans. True.
Q. 5. Tax policy is a part of monetary policy. True/ False
Ans. False.
Q. 6. Public expenditure should be increased to cure deflation. True/ False
Ans. False.
Q. 7. Reduce public borrowing to cure excess demand. True/ False
Ans. True.
Q. 8. Bank rate must be increased to allow increase in money supply. True/ False
Ans. Flase.
Q. 9. Open market operation is a fiscal policy instrument. True/ False
Ans. True.
TERMINAL EXERCISE
Q. 1. Discuss the various components of aggregate demand in brief?
Ans. Aggregate demand of an economy is defined as the total demand for goods and services at the given price level.
Price are given or fixed because in a short run period prices of goods and services do not change.
A measure of aggregate demand is the aggregate expenditure incurred by the different consuming sectors of the economy on consumption of goods and services at the prevailing price level. Now the Questions arises:
Who are the consuming sectors in the economy? It must be noted that the economy’s total product is used for final consumption as well as for further production. Accordingly, we can identify the following consuming sectors
1. Household.
2. Firm.
3. Government.
4. Rest of the world.
Aggregate demand consists of the demand for goods and services by these sectors taken together.
1. Household consumption demand: Individuals, families and on-profit organisations come under the household consumption demand. They demand both durable as well as non-durable goods. Durable goods include Television, radio, mobile phones, refrigerator and washing machines and non-durable items include food items, vegetables and clothes.
2. Producers or Firm’s Investment Demand: Producers or firms require goods and services for farther production. They get these goods and services as their investment. These are intermediate consumption. When firms consider investment spending, they routinely take into account the nominal interest rate, inflation and the real interest rate. Examples of investment spending include machinery, buildings, education and new housing.
3. Government Expenditure: Government makes purchases for the benefit of public. The government makes immediate purchases. The total amount of money spent by the government is often surprising. In fact, it is not unusual for government spending to constitute upwards of one third of gross domestic product. The level of government spending is a hotly debated topic as political parties vie for their programs in the annual budget.
4. Purchases by Rest of the World: A country makes exports and imports if it is an open economy. Net export is exports minus imports. The net export is the measure of demand for goods and services by rest of the world. It is important to recognize that net exports are dependent upon the real exchange rate. As the real exchange rate rises, domestic currency is relatively more valuable and thus the price of domestic goods is relatively more expensive than the price of foreign goods. In this case, exports fall and imports rise, causing net exports to decline. Interestingly, a thriving domestic economy will result in a higher real exchange rate and thus lower net exports.
Q. 2. Explain determination of equilibrium income, in a two sector economy? Give diagram.
Ans. In a two sector economy, the equilibrium level of national income can be determined by the equality of aggregate demand and aggregate supply or by the equality of saving and investment.
Aggregate demand is the summation of consumption expenditure on newly produced consumer goods by households and on their services (C), and investment expenditure cn newly produced capital goods and inventories by businessmen (I).
It is shown by the following identities:
Y = C + I …(1)
Personal Income:
Yd = C + S …(2)
But Y = Yd
C + I = C + S
or I = S
Where Y= national income,
Yd = disposable income,
C = consumption,
S = saving, and
I = investment.
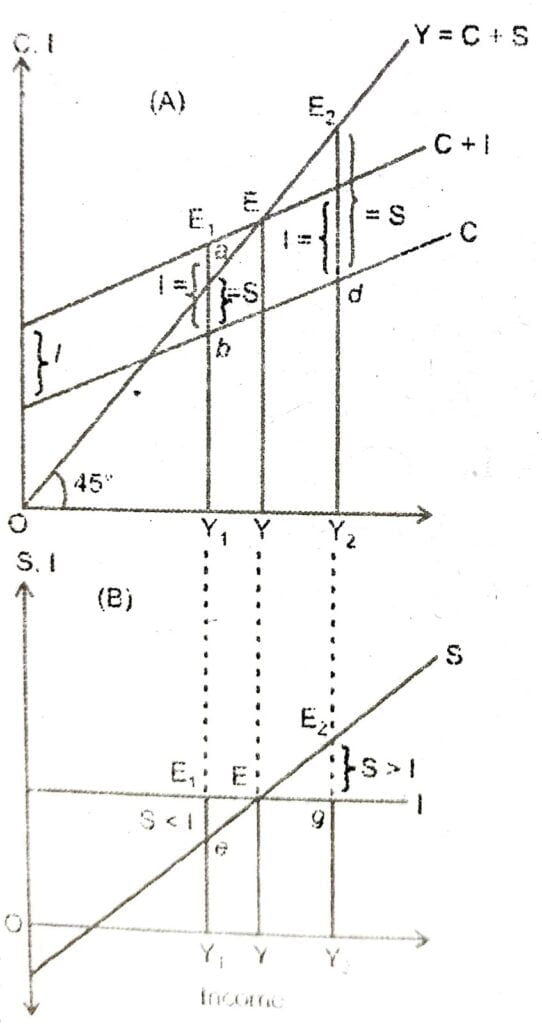
In the above identities, C + 1 relate to consumption and investment expenditures which represent aggregate demand of an economy. C is the consumption function which indicates the relation between income and consumption expenditure.
The consumption function is shown by the slope of the C curve in Fig. which is MFC (marginal propensity to consume). I is investment demand which is autonomous. When investment demands (I) is added to consumption function (C), the aggregate demand, function becomes C + I.
C + S identity is related to the aggregate supply of an economy. That is why, consumer goods and services are produced from total consumption expenditure and aggregate savings are invested in the production of capital goods.
In an economy, the equilibrium level of national income is determined by the equality of aggregate demand and aggregate supply (C + I = C + S) or by the equality of saving and investment (S = I).
Q. 3. Define multiplier and derive its value.
Ans. The concept of multiplier was first of all j developed by F.A. Kahn in the early 1930s. But Keynes 1 later further refined it. F.A. Kahn developed the concept I of multiplier with reference to the increase in employment, I direct as well as indirect, as a result of initial increase in J investment and employment.
Keynes, however, propounded the concept of multiplier with reference to the increase in total income direct as well as indirect, as a result of original increase in investment and income. Therefore, whereas Kahn’s multiplier is known as ’employment multiplier’, Keynes’s multiplier is known as investment or income multiplier.
The essence of multiplier is that total increase in income, output or employment is manifold the orignal increase in investment. For example, if investment equal to 100 crores is made, then the. income will not rise by 100 crores only but a multiple of it.
Q. 4. Explain the working of multiplier through various rounds.
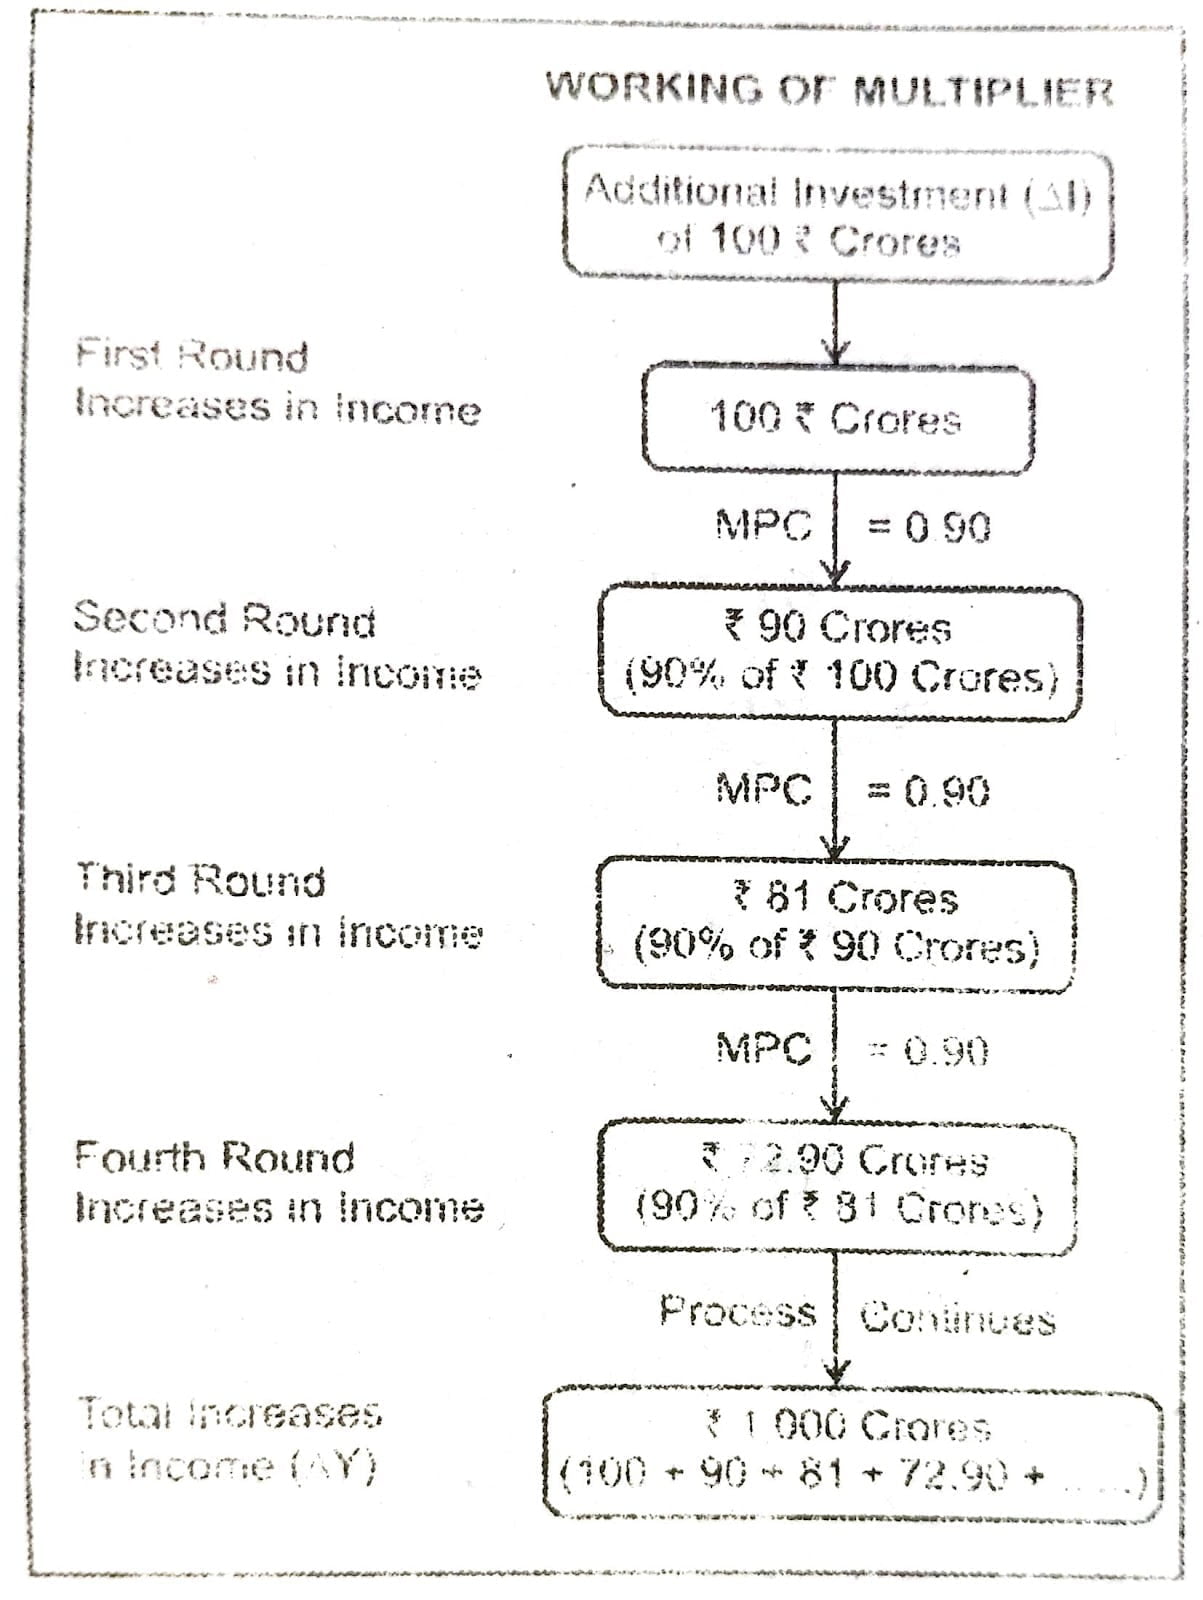
Ans. The working of multiplier is based on the fect that ‘One person’s expenditure is another person’s income’. When an additional investment is made, then income increases many times more than the increase in investment. Let us understand this with the help of an example.
1. Suppose, an additional investment of 100 crore (AI) is made to construct a flyover. This extra investment will generate an extra income of 100 crores in the first round.
2. If MPC is assumed to be 0.90, then recipients, of this additional income will spend 90% of 100 crores, i.e. 90 crores as consumption expenditure and the remaining amount will saved. It will increase the income by 90 crore in the second round.
3. In the next round, 90% of the additional income of 90 crores, i.e. 81 crores will be spent on consumption and the remaining amount will be saved.
4. This multiplier process will go on and the consumption expenditure in every round will be 0.90 times of the additional income received from the previous round. The multiplier process is shown in Table below.
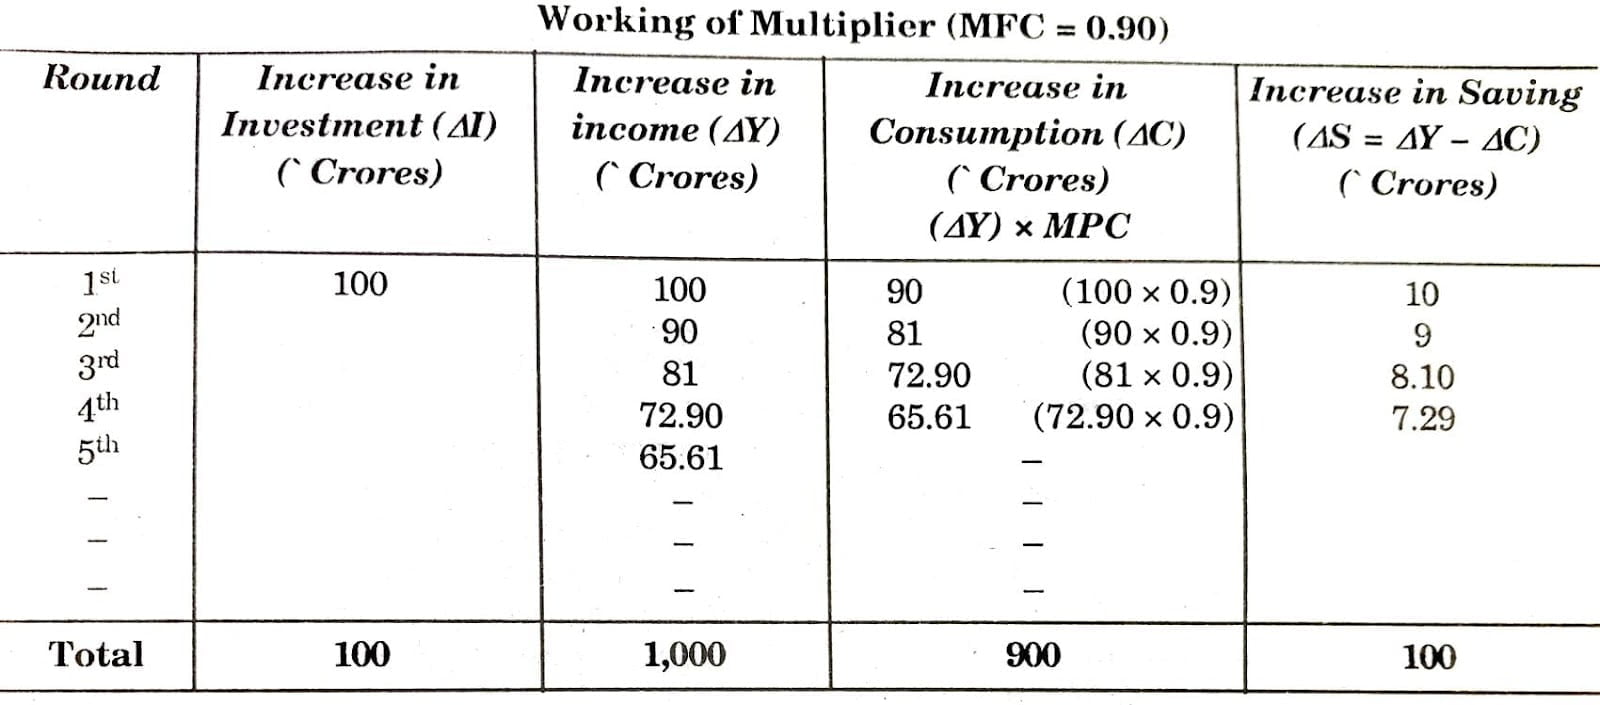
Thus, an initial investment of Rs 100 crores leads to a total increase of Rs 1,000 crors in the income. As a result, Multiplier (K) = ∆Y/∆I = 1000/100 = 10.
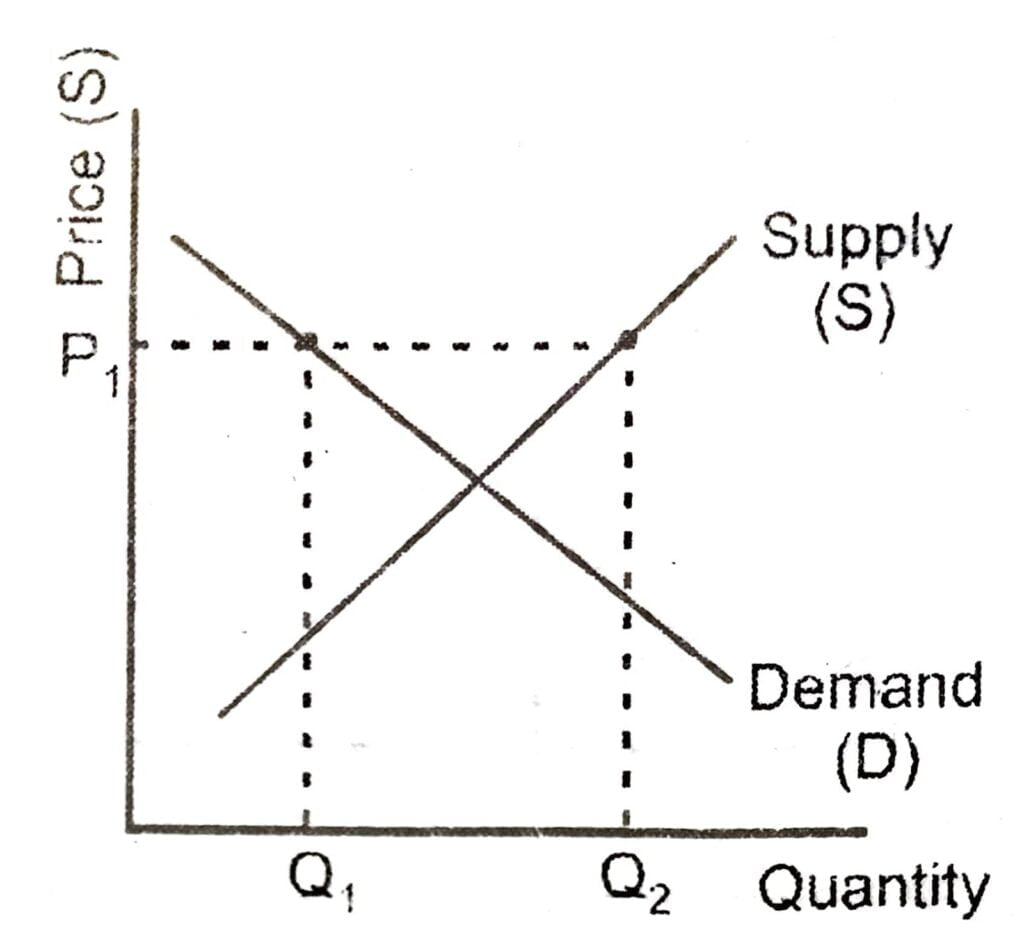
Q. 5. Define excess demand. Explain it by using suitable diagram.
Ans. Excess demand is created when price is set below the equilibrium price. Because the price is so low, too many consumers want the good while producers are not making enough of it.
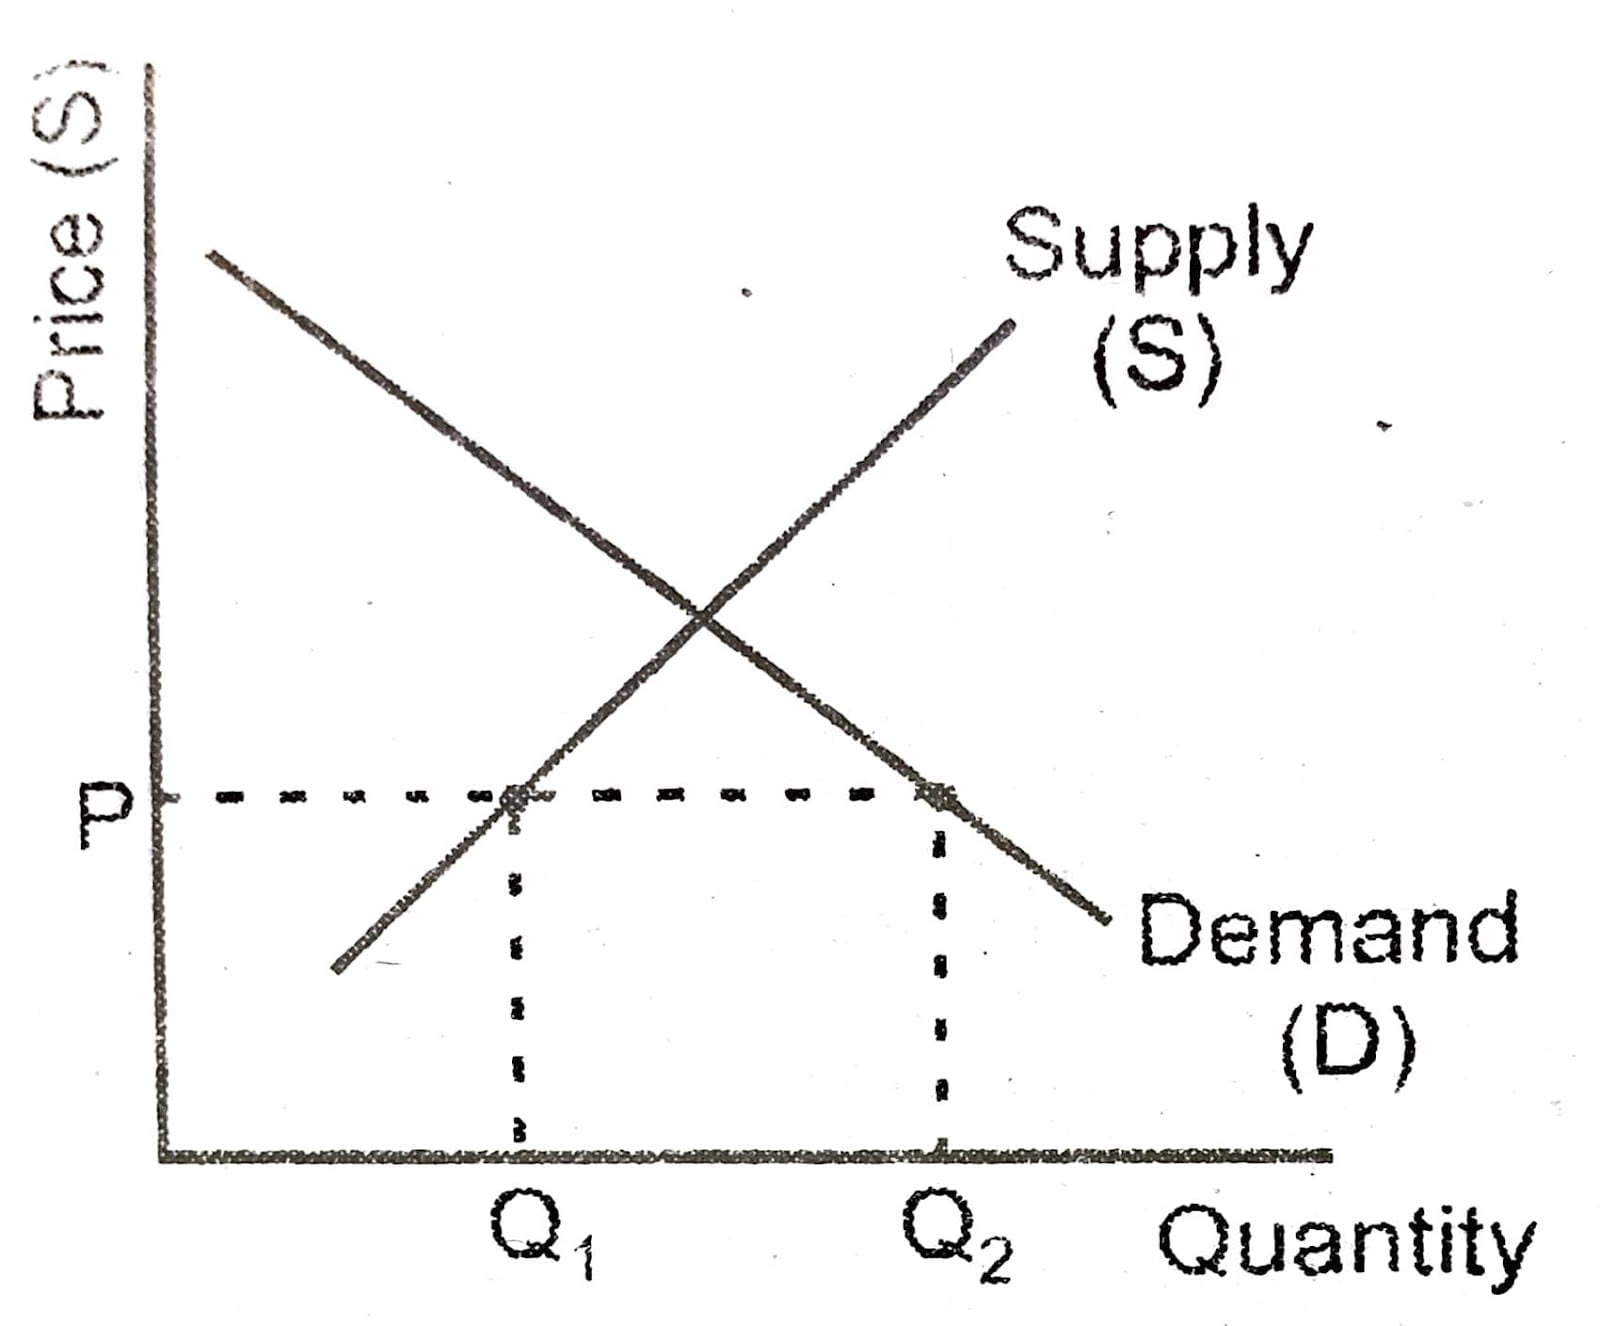
In this situation, at price P,, the quantity of goods demanded by consumers at this price is Q₂. Conversely, the quantity of goods that producers are willing to produce at this price is Q,. Thus, there are too few goods being produced to satisfy the wants (demand) of the consumers. However, as consumers have to compete with one other to buy the good at this price, the demand will push the price up, making suppliers want to supply more and bringing the price closer to its equilibrium.
Q. 6. Define deficiency in demand. Explain it by using suitable diagram.
Ans. Deficient demand is the situation when Aggregate Demand (AD) is less than the Aggregate Supply (AS) corresponding to full employment level of output in the economy.
The situation of deficient demand arises when planned aggregate expenditure falls short of aggregate supply at the full employment level It gives rise to deflationary gap. Diagrammatically, AD line shifts downwards at the level of potential output.
At price P, the quantity of goods that the producers wish to supply is indicated by Q₂. At P., however, the quantity that the consumers want to consume is at QIf a quantity much less than Q₂. Because Q, is greater than Q,, too much is being produced and too little is being consumed. The suppliers are trying to produce more goods, which they hope to sell to increase profits, but those consuming the goods will find the product less attractive and purchase less because the price is too high.
Q. 7. What do you mean by effective demand? Use a suitable diagram to show it.
Ans. When supply and demand are equal the economy is said to be at equilibrium. At this point, the allocation of goods is at its most efficient because the amount of goods being supplied is exactly the same as the amount of goods being demanded. Thus, everyone is satisfied with the current economic condition. At the given price, suppliers are selling all the goods that they have produced and consumers are getting all the goods that they are demanding.
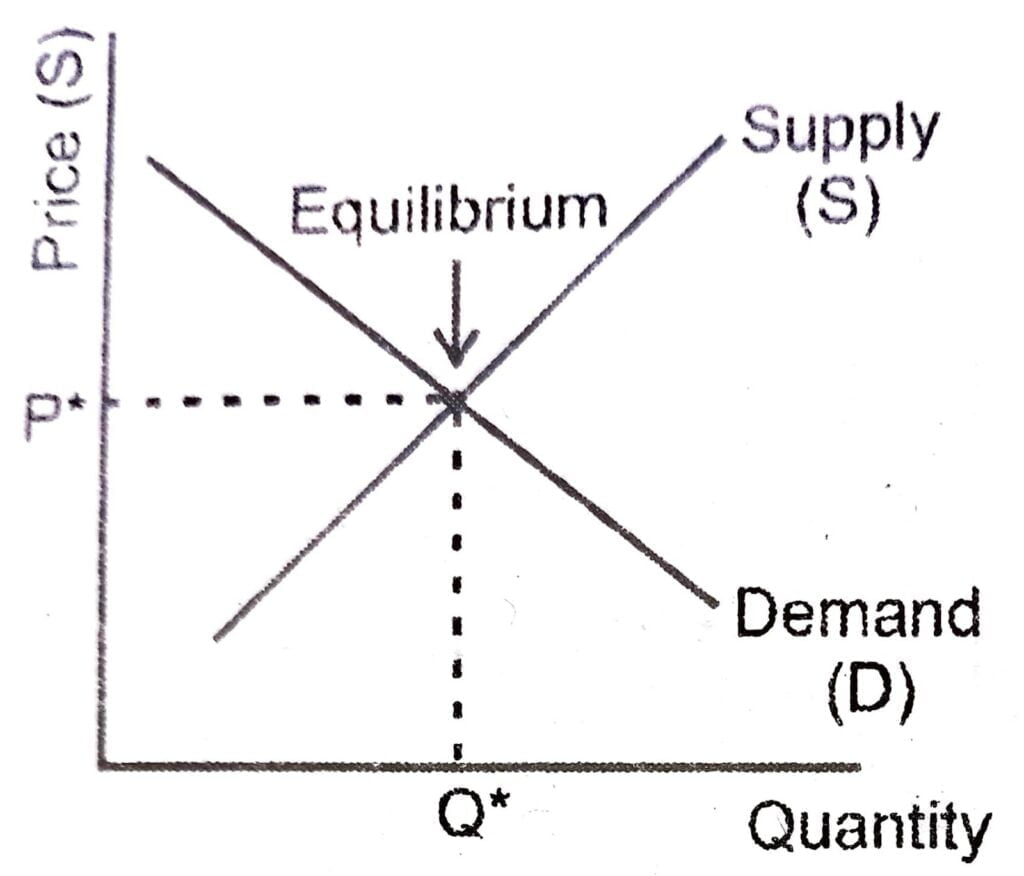
As you can see on the chart, equilibrium occurs at the intersection of the demand and supply curve, which -indicates no allocative inefficiency. At this point, the price of the goods will be P* and the quantity will be Q*. These figures are referred to as equilibrium price and quantity. In the real market place equilibrium can only ever be reached in theory, so the prices of goods and services are constantly changing in relation to fluctuations in demand and supply.
Q. 8. What are the components of fiscal policy?
Ans. Fiscal policy Can be defined as government’s actions to influence an economy through the use of taxation and spending. This type of policy is used when policy-makers believed the economy needs outside help in order to adjust to a desired point. Typically a government has a desire to maintain steady prices, an employment level, and a growing economy. If any of these areas are out of sorts, some type of fiscal policy may be in order.
Fiscal policy can be used in order to either stimulate a sluggish economy or to slow down an economy that is growing at a rate that is getting put of control (which can lead to inflation or asset bubbles). Fiscal policy directly affects the aggregate demand of an economy. Recall that aggregate demand is the total number of final goods and services in an economy, which include consumption, investment, government spending, and net exports.
Aggregate Demand-Consumption + Investment + Government Spending + Net Exports Fiscal policy has an effect on each of these categories. There are two types of fiscal policy: Expansionary and Contractionary.
Expansionary Fiscal Policy
When an economy is in a recession, expansionary fiscal policy is in order. Typically this type of, fiscal policy results in’ increased government spending and/ or lower taxes. A recession results in a recessionary gap – meaning that aggregate demand is at a level lower than it would be in a full employment situation. In order to close this gap, a government will typically increase their spending which will directly increase the aggregate demand curve (since government spending creates demand for goods and services). At the same time, the government may choose to cut taxes, which will indirectly affect the aggregate demand curve by allowing for consumers to have more money at their disposal to consume and invest. The actions of this expansionary fiscal policy would result in a shift of the aggregate demand curve to the right, which would result closing the recessionary gap and helping an economy grow.
Contractionary Fiscal Policy
Contractionary fiscal policy is essentially the opposite of expansionary fiscal policy. When an economy is in a state where growth is at a rate that is getting out of control (causing inflation and asset bubbles), contractionary fiscal policy can be used to rein it in to a more sustainable level. If an economy is growing too fast or for example, if unemployment is too low, an inflationary gap will form. In order to eliminate this inflationary gap a government may reduce government spending and increase taxes. A decrease in spending by the government will aggregate demand curve by reducing government demand for goods and services. Increases in tas levels will also slow growth, as consumers will have less money to consume and invest, thereby indirectly reducing the aggregate demand curve.
Fiscal Policy Summary
To summarize, fiscal policy is a type of economical intervention where the government injects its policies into an economy in order to either expand the economy’s growth or to contract it. By changing the levels of spending and taxation, a government can directly or indirectly affect the aggregate demand, which is %, total amount of goods and services in an economy.
One thing to remember concerning fiscal policy is that a recession is generally defined as a time period of at least two quarters of consecutive reduction in growth. It may take time to even recognize whether or not there is a recession. With fiscal policy, there will be certain levels of lag time in which conditions will deteriorate before being recognised. At the same time, fiscal policy takes time to implement due to legislative and administrative processes, and those same policies’ take time to show results after implementation.
Q.9. How are they used to curb excess demand in the company?
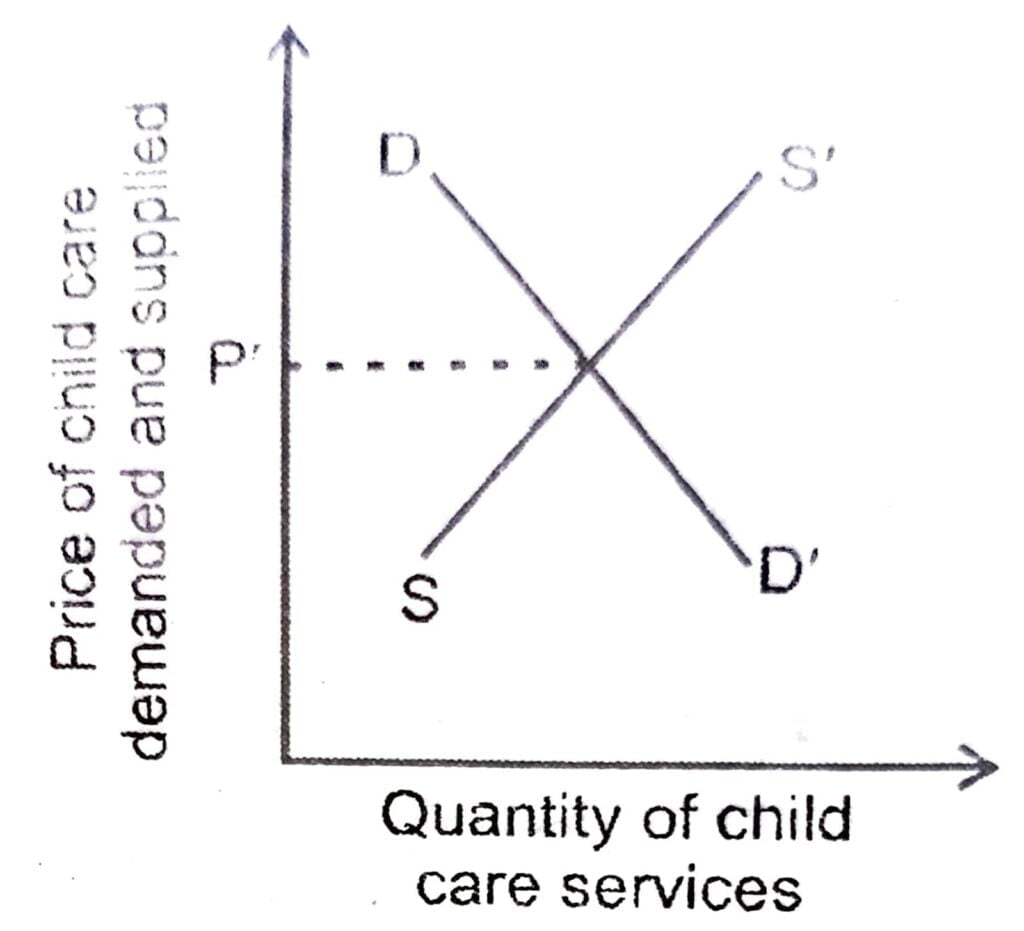
Ans. As a starting point in understanding excess demand, we begin with the traditional supply and demand model, illustrated in Fig. B.
1. In this figure, the price at which child care is demanded or supplied, is represented on the vertical axis; the amount of child care (e.g., number of hours of care per week) is given on’ the horizontal axis. The market demand for child care (curve DD’) depicts the maximum number of hours of child care demanded at each price. This curve is downward sloping indicating that as the price of child care increases, the amount of care demanded declines, because some parents will no longer find it worth their while to work. As a result, they will drop out of the labour market and no longer demand any child care.
Ce The market supply for child care (curve SS’ in ig. B.) represents the minimum price which child care producers (i.e., providers) will supply a given amount of child care. This curve is upward sloping because higher prices needed to attract additional providers into the market. As the price of child care goes up, providing child care will become more and more profitable and hence draw more and more people into becoming child care providers, either by becoming family day care providers or by opening up new day care centers.
Assuming a competitive market, the price of child care services (at a specified level of quality) will be determined by the intersection of the market demand and supply curves. In Fig. B.I, this occurs where the price is equal to P*. At this price, the amount of child care parents are willing to buy exactly equals the amount providers are willing to supply, and the market clears. In other words, there will be neither excess supply nor excess demand.
If the price that parents are willing to pay for child care increases, perhaps because they are earning more, the demand curve will shift upward, and the new equilibrium in the child care market will result in a higher price. The higher price in turn will result in a greater amount of child care services being supplied.
If the price of child care is above the market clearing price, there will be many providers willing to supply child care at that price but few parents willing purchase it. This phenomenon is called the affordability problem (or excess supply). If the price is set below the market clearing price, there will be plenty of parents demanding care but few providers willing to supply care at that price. This is called the availability problem, or excess demand. In a competitive market in which prices are allowed to fluctuate, a condition of excess demand will not remain for very long because parents seeking care will bid up the price until the price reaches the market clearing price and the excess demand has been eliminated. With subsidies of some child care slots, however, the price of these slots can remain below the market clearing price and thus create a permanent excess , demand that clears in nonpecuniary ways (e.g., through waiting lists).

Hi! my Name is Parimal Roy. I have completed my Bachelor’s degree in Philosophy (B.A.) from Silapathar General College. Currently, I am working as an HR Manager at Dev Library. It is a website that provides study materials for students from Class 3 to 12, including SCERT and NCERT notes. It also offers resources for BA, B.Com, B.Sc, and Computer Science, along with postgraduate notes. Besides study materials, the website has novels, eBooks, health and finance articles, biographies, quotes, and more.