
NCERT Class 8 Social Science Chapter 13 Dynamics of Population Solutions English Medium As Per New Syllabus. to each chapter is provided in the list so that you can easily browse through different chapters NCERT Class 8 Social Science Chapter 13 Dynamics of Population Notes and select need one. NCERT Class 8 Social Science Chapter 13 Dynamics of Population Question Answers Download PDF. NCERT Class 8 Social Science Texbook Solutions English Medium.
NCERT Class 8 Social Science Chapter 13 Dynamics of Population
Also, you can read the NCERT book online in these sections Solutions by Expert Teachers as per Central Board of Secondary Education (CBSE) Book guidelines. CBSE Class 8 Social Science Textual Solutions in English Medium are part of All Subject Solutions. Here we have given NCERT Class 8 Social Science Notes, CBSE Class 8 Social Science English Medium Solutions for All Chapters, You can practice these here.
Dynamics of Population
Chapter: 13
| Theme E — Economic Life Around Us |
The Big Questions
1. What is demography?
Ans: Demography is the scientific study of human population, including its size, distribution, composition and changes over time.
2. What are some important concepts of demography?
Ans: (i) Population Size.
(ii) Birth Rate.
(iii) Death Rate.
(iv) Migration.
(v) Population Density.
(vi) Life Expectancy.
(vii) Age Structure.
3. How has the population of India and the world changed over time?
Ans: The population of India and the world has increased rapidly due to improvements in healthcare, sanitation, food production and living conditions.
4. How do population trends shape societies and economies?
Ans: (i) They influence employment and workforce.
(ii) They increase demand for education and healthcare.
(iii) They affect urbanisation.
(iv) They influence economic development.
5. Census figures of 2001 as well as 2011 show the overall number of females per 1,000 males being much less than 1,000. Some states, however, had over 1,000 or near 1,000 (Kerala, Puducherry, Tamil Nadu). What might be the reasons for this? (Page 180)
Ans: (i) Better healthcare and education facilities.
(ii) Less gender discrimination.
(iii) Higher social status of women.
(iv) Better awareness and care for girl children.
(v) Lower female mortality rates.
6. If the replacement rate is less than 2, what will the population pyramid look like? Will there ever be a situation where the number of children is less than the number of aged people? What is likely to happen to the population of such a country over time? (Page 183)
Ans: (i) The population pyramid will have a narrow base and a wider upper portion.
(ii) Yes, the number of children may become less than the number of aged people.
(iii) The population will gradually decrease and become an ageing population.
THINK ABOUT IT
1. If many young people migrate from villages or smaller towns to cities, what changes could take place in their native villages? (Page 177)
Ans: (i) The number of elderly people may increase.
(ii) There may be a shortage of workers.
(iii) Schools and local services may decline.
(iv) Economic growth may slow down.
(v) Traditional customs and cultural activities may weaken.
(vi) Money sent by migrants may improve family living conditions.
2. Indian society has had the concept of āshrama dharma where life is divided into four phases — brahmacharya, gṛihastāshrama, vānaprasta and sanyāsa. Though older people begin to withdraw from economic activities, they continue to play other important roles — share their knowledge and wisdom with family and society as needed. Cultural continuity becomes possible through their guidance in rituals, storytelling, etc. They hold knowledge that may not necessarily be in books. Can you think of all the ways in which older people in your neighbourhood contribute to their family and society? (Page 186)
Ans: (i) They share their knowledge and experience.
(ii) They guide and support younger generations.
(iii) They teach traditional customs, values and rituals.
(iv) They help in taking care of children.
(v) They share stories and cultural traditions.
(vi) They provide emotional support to family members.
Questions and activities
1. Why is it important for a country to study its population through demography?
Ans: (i) It helps understand population size, growth and distribution.
(ii) It helps the government plan education, healthcare and housing facilities.
(iii) It helps identify employment needs and available workforce.
(iv) It supports proper use of natural and economic resources.
(v) It helps the government make better policies for the country’s social and economic development.
2. How can a low fertility rate affect a country’s future economy and workforce?
Ans: (i) The number of young people and future workers may decrease.
(ii) The proportion of elderly people may increase.
(iii) There may be a shortage of workers in different sectors.
(iv) Government spending on pensions and healthcare may increase.
(v) Economic growth may slow down due to a smaller workforce.
3. Do you think a high birth rate is always good for a country? Why or why not?
Ans: No, a high birth rate is not always good for a country because:
(i) It increases pressure on food, water and other resources.
(ii) It creates greater demand for education and healthcare.
(iii) It may increase unemployment and poverty.
(iv) It can put pressure on housing and public services.
4. Do you think it’s better to have more people or fewer people in a country? What are the challenges countries face in the case of a fast-growing or shrinking population?
Ans: Neither a very large nor a very small population is always better. A balanced population is important for a country’s development.
(i) Fast-growing Population: It creates pressure on jobs, education, healthcare and natural resources.
(ii) Shrinking Population: It may cause a shortage of workers, an ageing population and slower economic growth.
(iii) Balanced Population: It helps maintain a proper balance between resources, workforce and economic development.
5. How does the age structure of a country affect the kind of jobs and services it needs? Explain with examples.
Ans: The age structure determines the needs of a country’s population. More children require schools and childcare facilities, working-age people need jobs, and elderly people need better healthcare and pension services.
6. Why do you think families are generally getting smaller? Does having fewer children ensure better education and health for them? How does it affect families and society?
Ans: Families are becoming smaller due to rising living costs, better education, urbanisation and awareness of family planning. Having fewer children allows parents to provide better education, healthcare and care to each child. It also helps reduce population growth and family expenses.
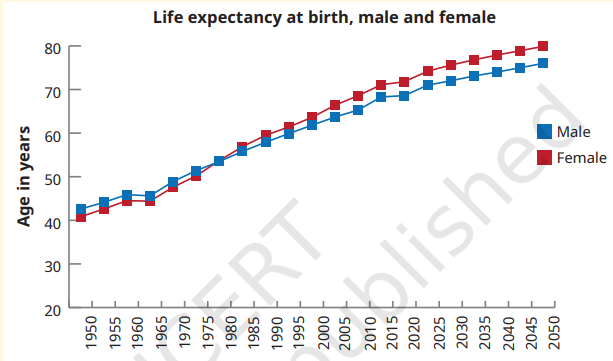
7. Observe the graph below showing changes in life expectancy across gender in India and answer the questions given below:
(a) Has the life expectancy in India increased? If yes, what could be the reasons?
Ans: Yes, life expectancy in India has increased due to better healthcare, improved nutrition, sanitation and living conditions.
(b) What was the life expectancy of males and females in 2010?
Ans: Male – 68 years; Female – 71 years.
8. What is a demographic dividend, and how does it benefit a country? What do you think India needs to do today to make the most of its demographic dividend before 2050?
Ans: Demographic dividend refers to the economic growth potential resulting from a large working-age population. It leads to higher productivity, income and tax revenue.
India needs to invest in quality education, skill development, healthcare and job creation to utilise this opportunity before its population starts ageing after 2050.
9. Choose two countries (for example: India and Japan, or Nigeria and Italy). Find out their:
(i) Population size
(ii) Fertility rate
(iii) Life expectancy
(iv) Age distribution
How are they different? What might be the reasons behind these differences? For instance, find out how countries with ageing populations are managing this.
Ans: India
(i) Population size: India became the world’s most populous country in 2023.
(ii) Fertility rate: India’s fertility rate has declined to around 1.9 in 2025.
(iii) Life expectancy: Life expectancy in India has increased to about 70 years.
(iv) Age distribution: Around 65% of India’s population is in the working-age group, giving it a demographic dividend.
Japan
(i) Population size: Japan’s population is shrinking.
(ii) Fertility rate: Japan has a very low fertility rate, below replacement level.
(iii) Life expectancy: Japan has high life expectancy, resulting in a larger elderly population.
(iv) Age distribution: Japan has an ageing population with fewer young workers.
Differences
(i) India has a young population, while Japan has an ageing population.
(ii) India has a large working-age population, while Japan has a shrinking workforce.
(iii) India enjoys a demographic dividend, while Japan faces challenges in supporting its elderly population.
Reasons for differences:
(i) Declining fertility rates in Japan.
(ii) Higher life expectancy due to better healthcare.
(iii) Differences in economic development, urbanisation, education and women’s employment.
How ageing countries manage this:
(i) Raising the retirement age.
(ii) Using technology and automation to reduce labour shortages.
(iii) Providing better pension and healthcare facilities.
10. Imagine you are a researcher who intends to study migration patterns in your locality. Make a questionnaire to collect data on the following questions.
(i) Name of the person
(ii) Age of the person
(iii) Occupation of the person
(iv) Place of residence
(v) Number of years lived in the place
(vi) Factors contributing to migration, such as lack of facilities, poor infrastructure, limited job opportunities, etc.
Ans: Questionnaire on Migration Patterns
(i) What is your name?
(ii) What is your age?
(iii) What is your occupation?
(iv) Where do you currently live?
(v) How many years have you lived in this place?
(vi) What are the main reasons for migration? (Lack of facilities, poor infrastructure, limited job
opportunities, education, etc.)
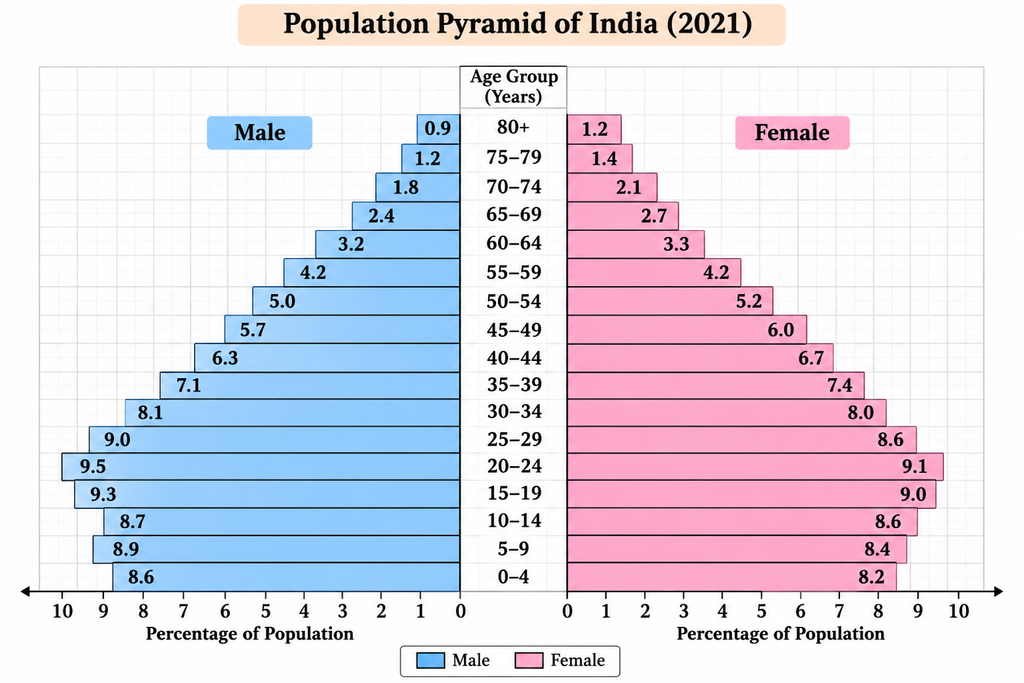
11. Draw a population pyramid on graph paper for India using the data given in the following table. Age-group-wise percentage distribution of population (estimated for 2021)
Age-group-wise percentage distribution of population (estimated for 2021)
| Age Group | Male | Female |
| 0–4 | 8.6 | 8.2 |
| 5–9 | 8.9 | 8.4 |
| 10–14 | 8.7 | 8.6 |
| 15–19 | 9.3 | 9.0 |
| 20–24 | 9.5 | 9.1 |
| 25–29 | 9.0 | 8.6 |
| 30–34 | 8.1 | 8.0 |
| 35–39 | 7.1 | 7.4 |
| 40–44 | 6.3 | 6.7 |
| 45–49 | 5.7 | 6.0 |
| 50–54 | 5.0 | 5.2 |
| 55–59 | 4.2 | 4.2 |
| 60–64 | 3.2 | 3.3 |
| 65–69 | 2.4 | 2.7 |
| 70–74 | 1.8 | 2.1 |
| 75–79 | 1.2 | 1.4 |
| 80+ | 0.9 | 1.2 |
Ans:
12. Observe the population pyramid for Japan in 2023 below. What can you infer from this? Write your observations and share in the class.
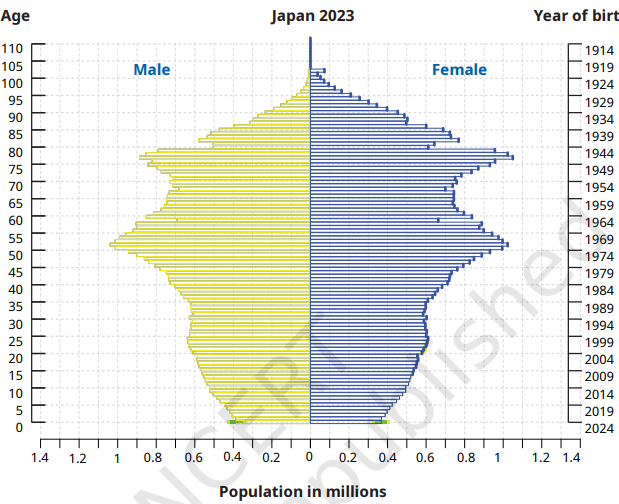
Ans: (i) Japan has a narrow population base, indicating a low birth rate.
(ii) The middle and upper age groups have a larger population.
(iii) Japan has a rapidly ageing population.
(iv) Low fertility rates have led to a shrinking population.
(v) The working-age population is decreasing, creating labour shortages.
(vi) The government faces increasing pressure to provide pensions and healthcare for elderly people.
Subject Ka Complete Video Solution Dekhein
Step-by-step easy concept explanation aur full questions Answer ke liye watch karein ya app download karein:


 Buy Now