
What the latest evidence says about same-game parlays
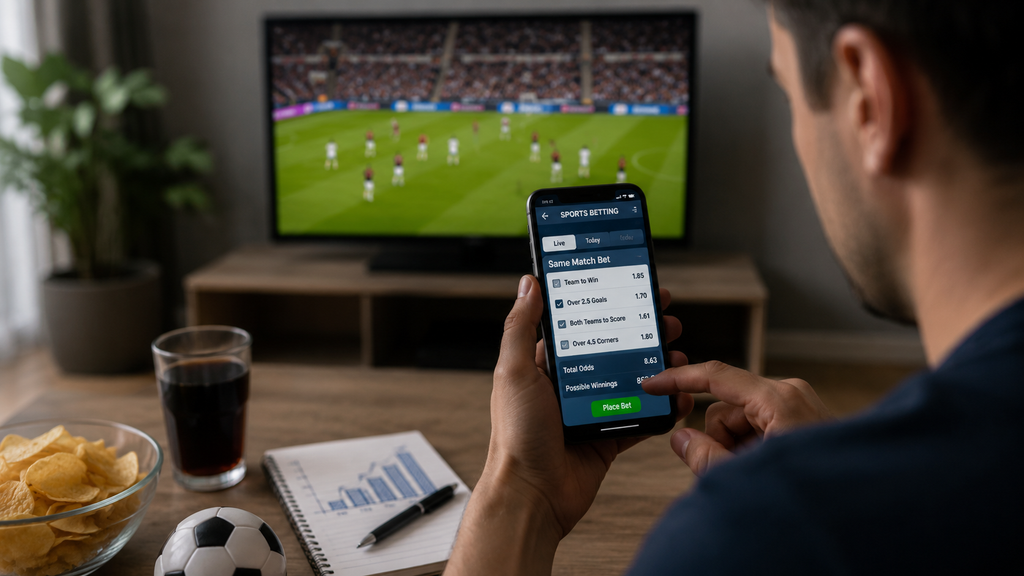
Same-game parlays have become more visible in sportsbook menus, but several widely repeated statistics about their revenue share and house edge are difficult to trace to public product-level data. A 2026 paper in Finance Research Letters now gives the discussion a clearer academic base, while recent corporate filings show how one major operator describes the link between parlay adoption and margin. The result is more cautious than the usual headline: demand has shifted, operator economics have changed, and no single percentage describes the risk of every ticket.
Sportsbook research should stay focused on sportsbook evidence, even when the same operator also carries casino products. Data taken from the bizbet casino section would describe a different product area and should not be used to support claims about parlay pricing, adoption or sportsbook margins. The analysis below therefore relies on published parlay research and operator reporting.
The 2026 study changes the evidence base
Richard Borghesi, Steven Salaga, Jared Williams and Michael Mondello published Contract Choice, Parlay Adoption, and Sportsbook Margins in 2026. Their analysis found that growth in parlay participation occurred within the same bettors, not only because a different mix of people entered the sample. Same-game parlays contributed to the increase, but broader multi-leg adoption also persisted.
That distinction matters. It supports a genuine change in product choice without claiming that same-game parlays alone caused every increase in sportsbook margin. It also weakens the unsupported idea that one product now represents a fixed 35 to 40 percent of revenue across major US operators. Public disclosures do not provide a consistent industry-wide product breakdown at that level.
What operator filings actually disclose
Flutter’s 2025 annual filing reported that US sportsbook net revenue margin rose from 7.9 percent in 2024 to 8.6 percent in 2025. The company also said its structural revenue margin increased by 60 basis points to 14.2 percent, attributing the change partly to higher same-game parlay penetration and its pricing and risk capabilities. These are company-wide sportsbook measures, not a standalone house-edge figure for same-game parlays.
At its 2024 investor day, Flutter said FanDuel introduced same-game parlays in 2019 and described parlays as a higher-margin part of its bet mix. The statement supports the commercial importance of the format for that operator. It does not prove that 2019 was the first appearance of the product everywhere, nor does it establish a universal revenue share for competitors.
Why no universal house edge exists
The original 20 to 35 percent range is too broad to present as a standard research finding. A same-game parlay’s expected margin depends on the selected legs, the offered price, the true joint probability and the operator’s correlation model. Without those inputs, a precise house edge cannot be calculated.
A conventional two-way point spread at -110 is easier to illustrate. If each side has a true 50 percent chance, staking 110 to win 100 produces an expected loss of 5 per 110 staked, or about 4.55 percent. That is a theoretical price calculation. Realized sportsbook hold is a separate accounting measure affected by the mix of bets, outcomes, promotions and timing.
Correlation and joint probability
Independent parlay legs can be priced by multiplying their probabilities. Same-game legs often cannot. A team winning and one of its players exceeding a scoring threshold may be positively related; two outcomes that compete for the same limited total may be negatively related. The fair probability of the combination therefore depends on the relationship between the legs, not only on each leg viewed alone.
Correlation adjustment is not automatically an added fee. It is first a necessary change to the joint probability. The margin question comes afterward: how the quoted payout compares with a defensible estimate of that joint probability. This is why multiplying displayed single-leg odds and calling every difference a correlation tax can produce a misleading result.
Research claims and safer conclusions
The available evidence supports some claims strongly and leaves others unresolved.
| Claim | Evidence | Supported reading |
| Parlay use increased | Borghesi et al., 2026 | Increase occurred within the same bettors |
| SGPs affect margin | Flutter 2025 filing | Higher penetration was one cited margin factor |
| FanDuel rollout began in 2019 | Flutter 2024 investor day | Company claim, not an industry start date |
| SGP edge is always 20-35%+ | No consistent public basis | Depends on legs, price and joint probability |
| SGPs supply 35-40% of revenue | No comparable public disclosure | Should not be stated as an industry fact |
Why demand increased
The 2026 paper identifies a shift toward multi-leg contracts within existing users. Operator materials add a commercial explanation: parlays carry higher structural margin and are treated as a distinct product priority. Neither source proves that entertainment value is the only cause of adoption. Interface design, the growing number of player markets, promotions and the attraction of a larger headline payout may all contribute.
The risk profile is clear even without a universal edge estimate. Every leg must succeed, so adding legs lowers the probability of collecting the combined payout. The return distribution also becomes more uneven: frequent total losses are exchanged for a smaller chance of a larger return. That is a product characteristic, not proof that every offered price is equally unfavorable.
How price comparisons can be documented
A useful comparison starts by recording the time, sport, market definitions, individual prices and combined price. The next step is to estimate the joint probability with correlation included. Simply multiplying the leg probabilities is appropriate only when independence is a reasonable assumption.
A useful comparison starts by recording the time, sport, market definitions, individual prices and combined price. When documenting a specific quote from Bizbet Монгол, the record should also preserve the market terms and timestamp so the combined price can be evaluated against the same set of conditions. The next step is to estimate the joint probability with correlation included rather than treating the brand name itself as evidence about value.
A research note should record at least:
- The exact definition and settlement condition for every leg
- The quoted single-leg and combined prices at the same time
- The assumed direction and approximate strength of correlation
- Any promotion or price boost kept separate from the base quote
- The difference between expected margin and realized sportsbook hold
Limits and open questions
Academic work on current same-game parlay use is still limited, and operator disclosures aggregate several products. The 2026 Finance Research Letters study improves the evidence on adoption and margins, but public summaries do not turn every product-level claim into a verified statistic. Company filings also describe one business and use their own margin definitions.
The most useful next evidence would be a consistent dataset containing leg-level prices, modeled correlations, final outcomes and product-level revenue across several operators. Until such data are public, precise industry-wide shares and fixed house-edge ranges should be treated as estimates that require a named method.
What the evidence supports
Same-game parlays are no longer a minor product, and the best available evidence links wider parlay adoption with higher sportsbook margins. The evidence does not support presenting 35 to 40 percent of revenue, more than 30 percent of handle or a 20 to 35 percent house edge as universal facts without a named dataset and calculation.
A firmer conclusion is possible. The format combines multiple conditions, often with dependence between them, and produces a more concentrated payout profile than a single wager. Its commercial importance is documented, but its exact cost must be calculated ticket by ticket from the offered price and a credible joint-probability estimate.

Hi, I’m Dev Kirtonia, Founder & CEO of Dev Library. A website that provides all SCERT, NCERT 3 to 12, and BA, B.com, B.Sc, and Computer Science with Post Graduate Notes & Suggestions, Novel, eBooks, Biography, Quotes, Study Materials, and more.
Subject Ka Complete Video Solution Dekhein
Step-by-step easy concept explanation aur full questions Answer ke liye watch karein ya app download karein:







 Buy Now