NIOS Class 12 Economics Chapter 22 Price Determination Under Perfect Competition, Solutions to each chapter is provided in the list so that you can easily browse through different chapters NIOS Class 12 Economics Chapter 22 Price Determination Under Perfect Competition and select need one. NIOS Class 12 Economics Chapter 22 Price Determination Under Perfect Competition Question Answers Download PDF. NIOS Study Material of Class 12 Economics Notes Paper 318.
NIOS Class 12 Economics Chapter 22 Price Determination Under Perfect Competition
Also, you can read the NIOS book online in these sections Solutions by Expert Teachers as per National Institute of Open Schooling (NIOS) Book guidelines. These solutions are part of NIOS All Subject Solutions. Here we have given NIOS Class 12 Economics Chapter 22 Price Determination Under Perfect Competition, NIOS Senior Secondary Course Economics Solutions for All Chapters, You can practice these here.
Price Determination Under Perfect Competition
Chapter: 22
Module – VIII: Market And Price Determination
TEXT BOOK QUESTIONS WITH ANSWERS
INTEXT QUESTIONS 22.1.
Q.1. Define equilibrium price.
Ans. Equilibrium price of a commodity is the price at which its quantity of demanded and supplied are equal.
Q.2. Which force of price determination is relatively more important and why?
Ans. Both the forces of demand and supply are important. But it is the demand which is relatively more important since it makes the producers produce more goods and sells in the market. Price, under conditions of perfect competition is determined by the interaction of demand and supply. Before Marshall, there was a dispute among economists as to whether the force of demand (i.e., marginal utility) or the force of supply (i.e., cost of production) is more important in determining price. Marshall gave equal importance to both demand (or marginal utility) and supply (or cost of production) in the determination of value or price.
Q.3. Can we have two levels of equilibrium price for demand curve DD and supply curve SS? Support your answer with reason.
Ans. The price at which demand and supply are equal is known as an equilibrium price, since at this price the forces of demand and supply are balanced, or are in equilibrium. The quantity bought and sold (or the amount supplied or demanded) at this equilibrium price is known as equilibrium amount.
If the equality between quantity demanded and supplied does not hold for some price, buyers’ and sellers’ desires are divergent either the amount demanded by buyers is more than that offered by sellers, or the amount offered for supply by sellers is greater than the amount demanded by buyers. In either case, the price will change so as to bring about equality between quantity demanded and quantity supplied.
Q.4. Tick the correct answer:
(i) Point of intersection of demand curve and supply curve shows:
(a) The equilibrium price.
(b) The equilibrium quantity.
(c) Neither of the two.
(d) Both equilibrium price and quantity.
Ans. (d) Both equilibrium price and quantity.
(ii) Equilibrium price of a commodity is the price at which
(a) Quantity demanded and supplied, both rise.
(b) Supply is maximum.
(c) Demand is maximum.
(d) Quantity demanded and supplied are equal.
Ans.(a) Quantity demanded and supplied are equal.
(iii) Equilibrium means
(a) The variables are changing continuously.
(b) Demand and supply are unequal.
(c) The variables show no tendency to change.
(d) None of the above.
Ans. (e) The variables show no tendency to change.
(iv) If at some particular price, the quantity demanded exceeds its quantity supplied, then-
(a) Price will rise.
(b) Demand will fall.
(c) Supply will increase.
(d) All of the above.
Ans. (d) All of the above.
INTEXT QUESTIONS 22.2.
Q.1. What is excess demand?
Ans. Excess demand is the gap between demand and supply when demand is more than supply. If at a given price, the quantity demanded of a commodity exceeds its quantity supplied we have excess demand. For example, in the table, when price is ₹ 2 per kg., demand is 24 kg. while supply is just 16 kg. So this is a situation of excess demand.
Q.2. What is excess supply?
Ans. Excess supply means more supply than demand at a given price.
Q.3. How is equilibrium between demand and supply restored in case of excess demand?
Ans. In case of excess demand, price starts rising as the buyers try to compete out each other. It leads to demand starts contracting and supply expanding. All these movements of price, demand and supply lead to equilibrium.
Q.4. How is equilibrium between demand and supply restored in case of excess supply?
Ans. In case of excess supply, price starts falling as the suppliers try to compete out each other. It leads to demand starts expanding and supply contracting. All these movements of price, demand and supply lead to equilibrium, though at a lower price.
Q.5. Explain the effect of adjustment process on price, demand and supply in case of excess demand.
Ans. In case of excess demand, price starts increasing when the buyers try to compete out each other. It makes the demand starts declining and supply increasing. All these movements of price, demand and supply result in equilibrium.
Q.6. Explain the effect of adjustment process on price, demand and supply in case of excess supply.
Ans. In case of excess supply, price starts declining when the suppliers try to compete out each other. It leads to demand starts expanding and supply contracting. All these movements of price, demand and supply lead to equilibrium, though at a lower price.
INTEXT QUESTIONS 22.3.
Q.1. With the help of diagrams, show the effect of increase and decrease in demand on price when supply remains constant.
Ans.
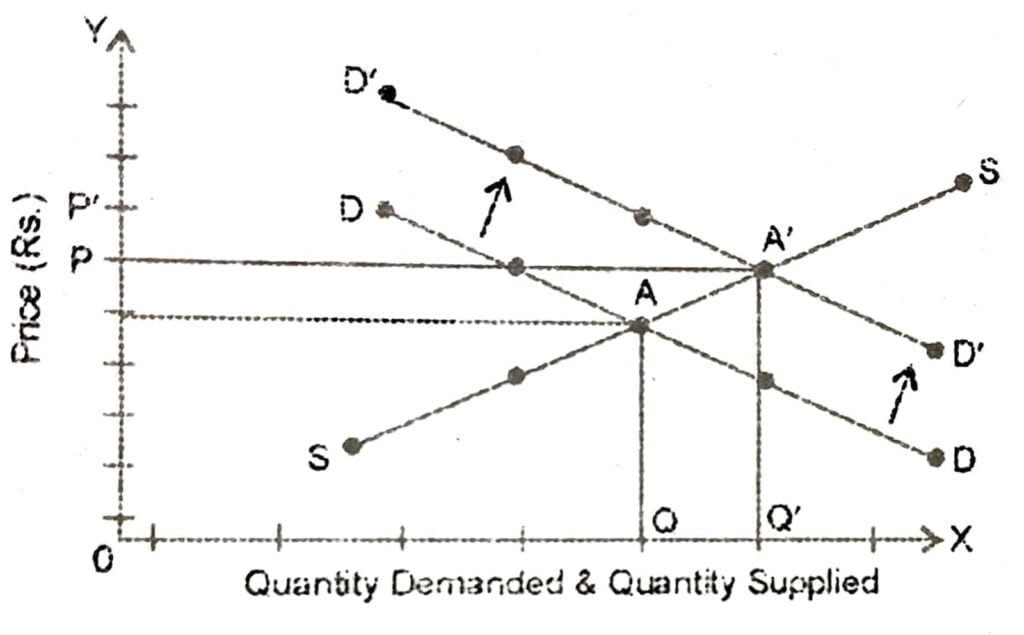
Effect of Increase in Demand on Price: When at the same price there is greater demand for a commodity, it is called increase in demand. If supply schedule remains the same then an increase in demand raises the equilibrium price of the commodity. Let us explain with he help of a diagram the effect of increase in demand on price, supply schedule remaining the same.
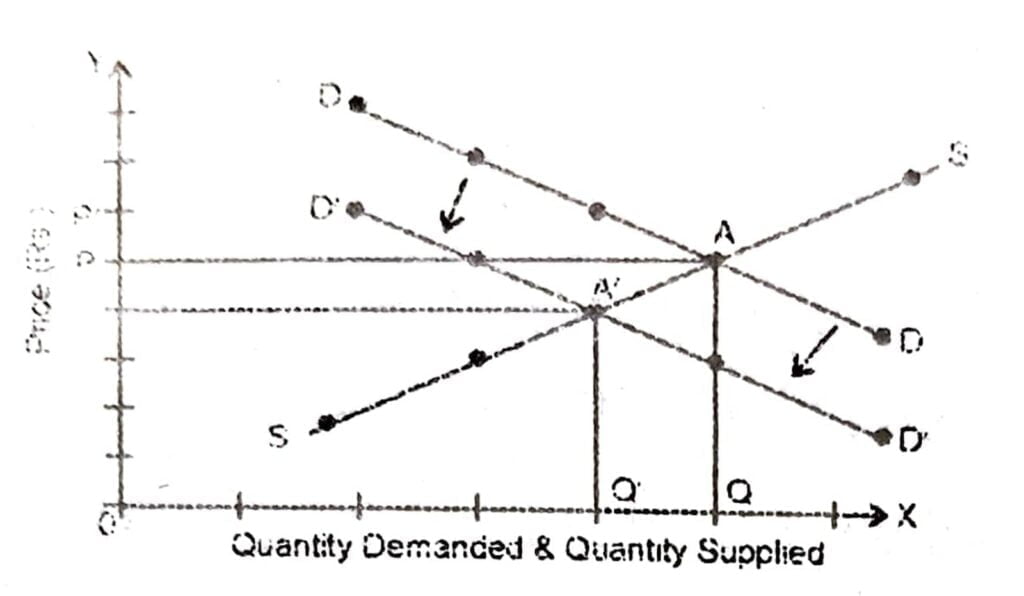
Effect of decrease in demand on price: Decrease in demand means lesser demand at the same price. Decrease in demand means a leftward shift in demand curve as shown in the figure.
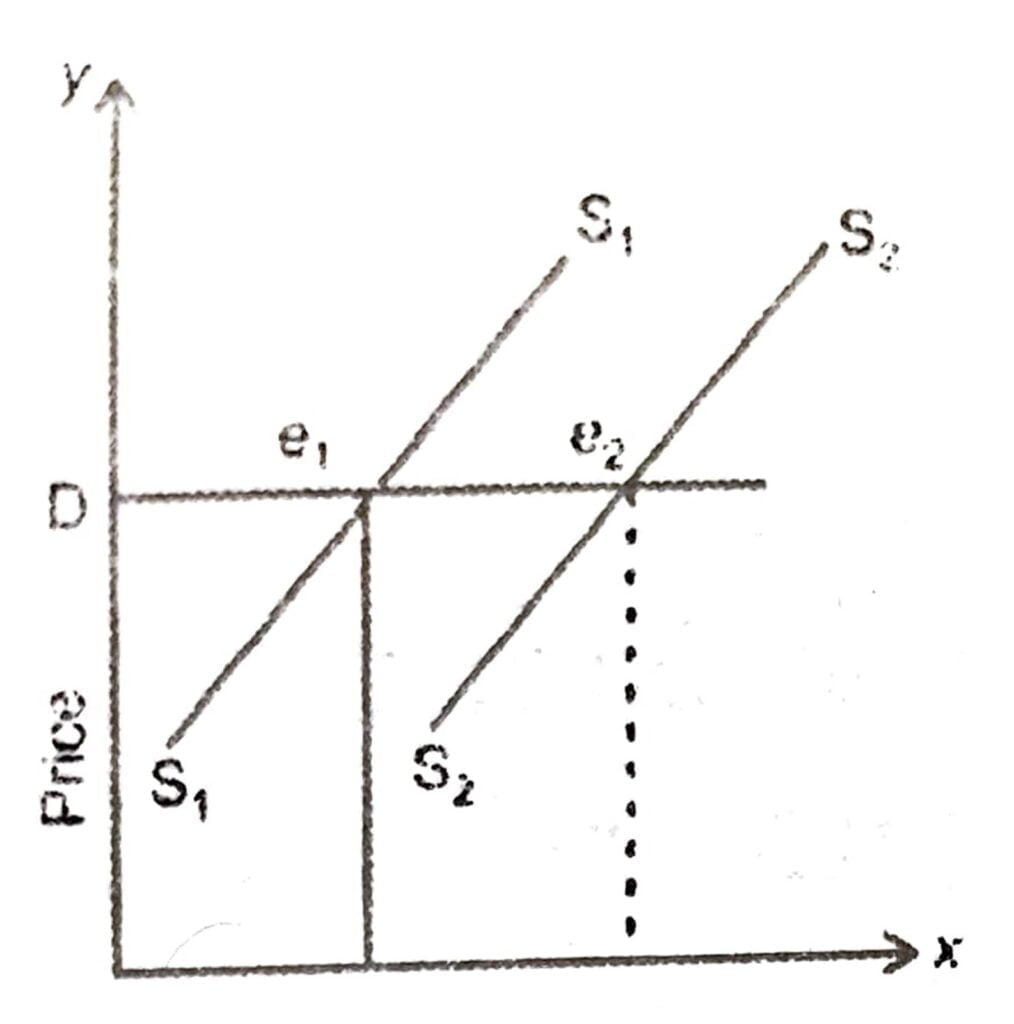
Q.2. Show the effect of increase in supply on price of a commodity when its demand is perfectly elastic.
Ans. When the supply increases and when its demand is perfectly elastic, price remains the same. The figure below explains this point.
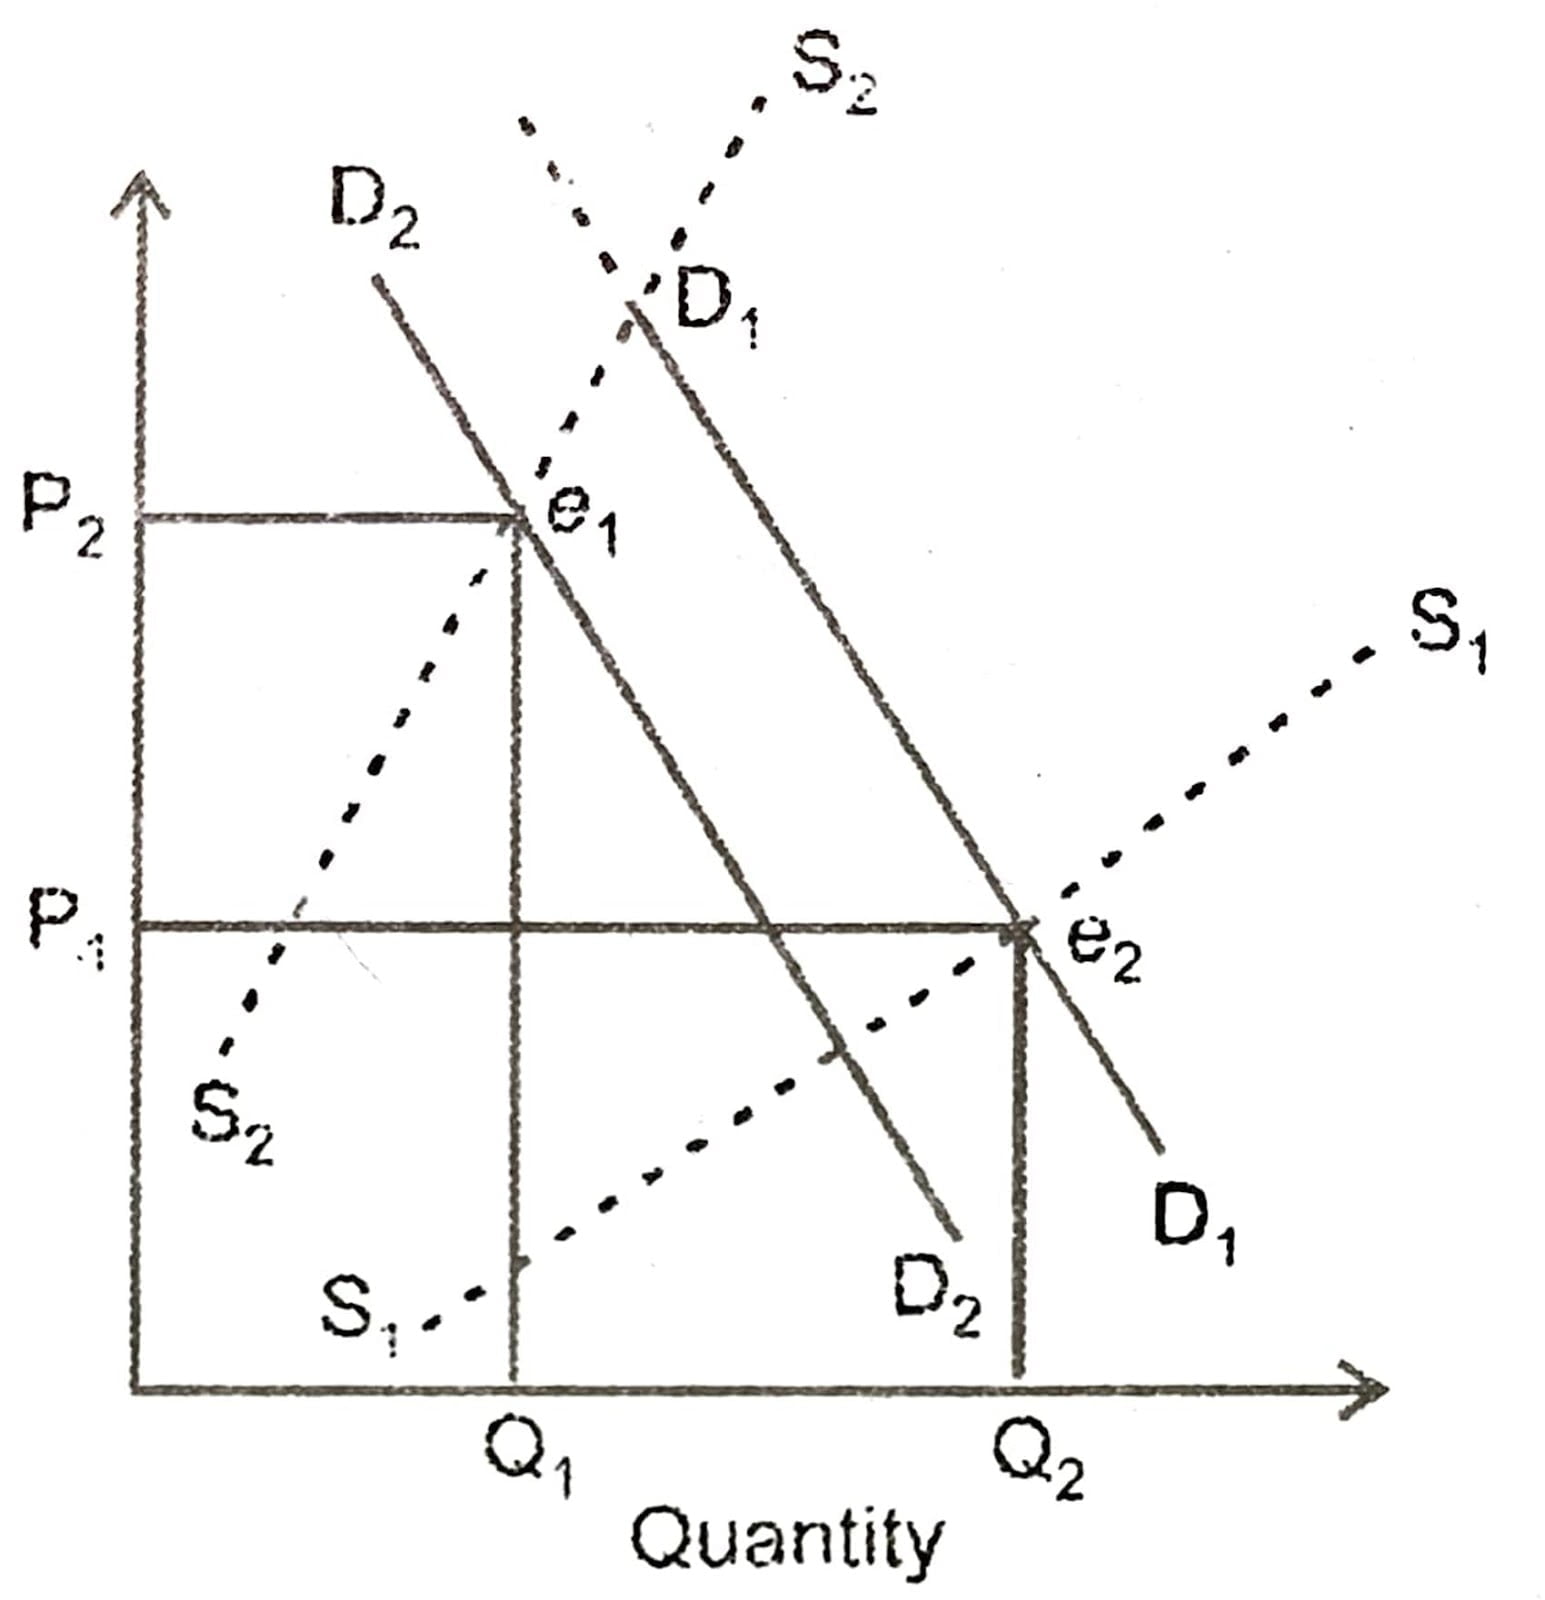
Q.3. Show the effect of simultaneous decrease in demand and supply on price when supply changes relatively to a greater extent.
Ans.
INTEXT QUESTIONS 22.4.
Q.1. What is ceiling price?
Ans. Ceiling price: When the price prevailing in the market is too high and is affecting the interests of the consumers adversely, the government has to step in and decide ceiling price.
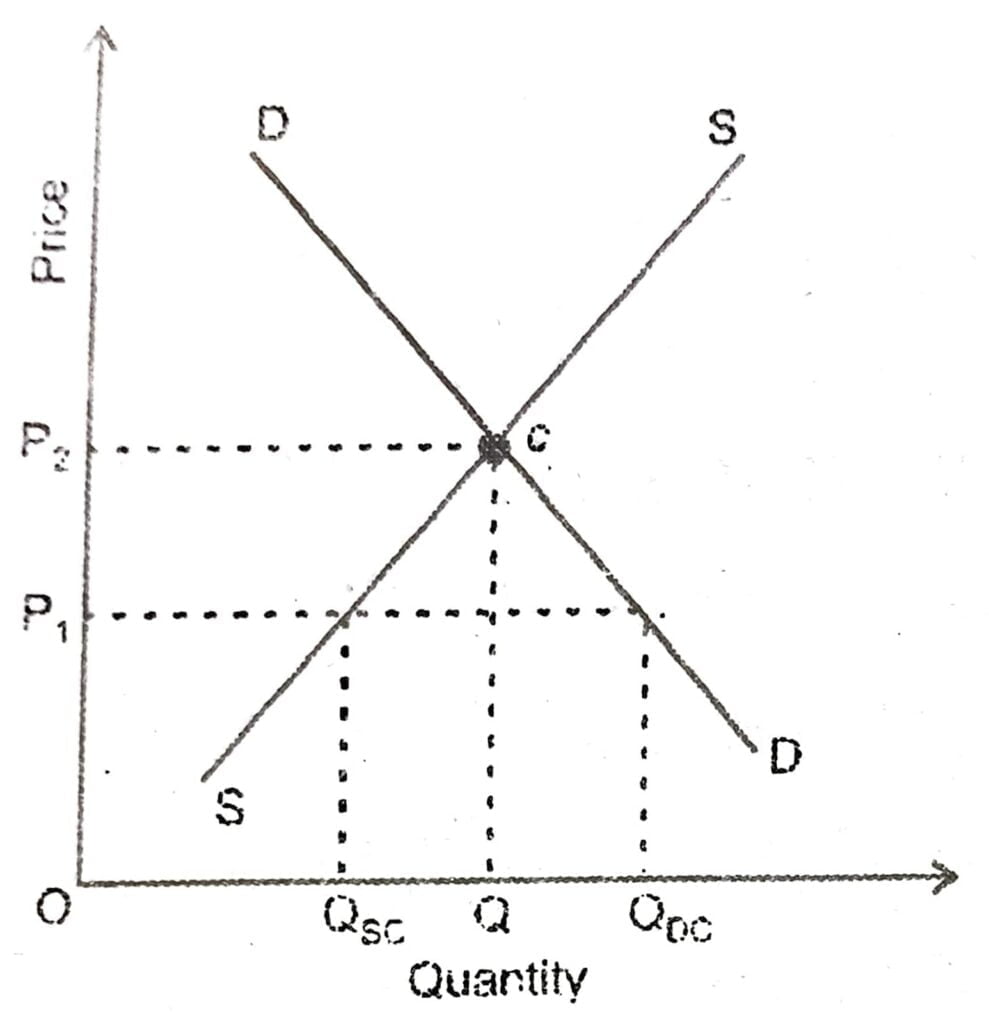
The sellers are not allowed to raise price of their products beyond this ceiling price and thus the interests of the consumers are protected. An example of this may be rent control policy. Suppose the current rent for a particular type of flats is determined at OP which is exorbitant. In such a case, the government can fix the rent arbitrarily at OPc which is lower then OP and will give some relief to tenants (consumers). It may be mentioned that at this controlled rent OPc, the demand for flats (OQDC) exceeds supply of flats (OQSC) and this may lead to unscrupulous practices for which the government may have to take preventive and remedial measures. It may also be mentioned that fixation of price at a level above OP has no point as price mechanism will automatically push the price level back to OP.
Q.2. What is floor price?
Ans. Floor Price: It is not necessary that price determined ‘s always too high. Sometimes it may be too low also. It may happen especially in markets with excessive supply of something. For example, Indian labour market is a market with excessive supply of labour. In such a setting, the wage rate determined by the market forces of demand and supply is generally too low (especially in the market for unskilled labour). To protect workers’ interests in such a case the government may pass minimum wage legislation. Suppose, the wage rate prevailing in the market is OW which is too low. The government may pass minimum wage legislation and fix minimum wages at OW. This minimum wage level is floor price. The government does not allow the price level to go lower than floor price and thus sellers’ interests are protected. (worker is the seller of his labour).
Q.3. What is the need for minimum wages legislation?
Ans. The minimum wage legislation is needed to fix the floor price. The government does not allow the price level to go lower than the floor price and thus the interests of the sellers are protected.
Q.4. Explain ceiling price with the help of graph.
Ans. A price ceiling occurs, when the government puts a legal limit on how high the price of a product can be. In order for a price ceiling to be effective, it must be set below the natural market equilibrium.
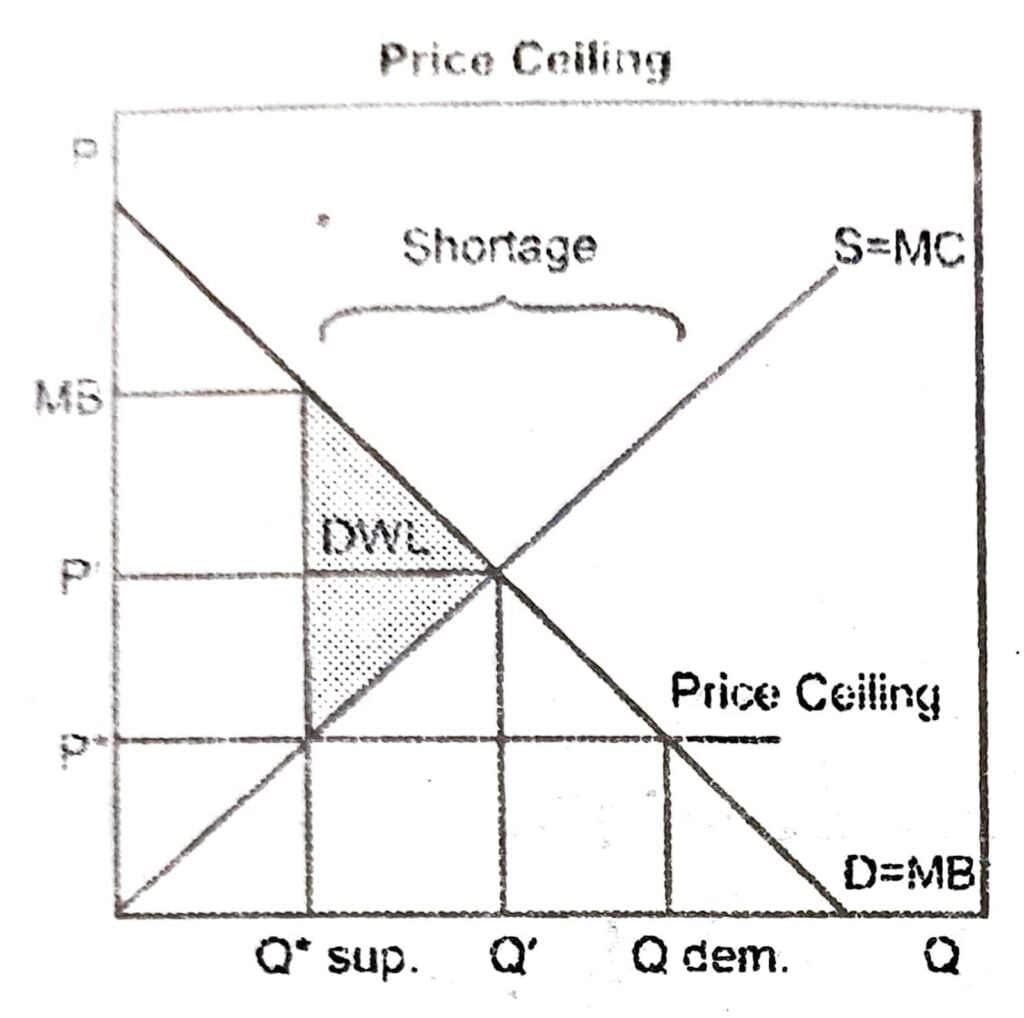
When a price ceiling is set, a shortage occurs. For the price that the ceiling is set at, there is more demand than there is at the equilibrium price. There is also less supply than there is at the equilibrium price, thus there is more quantity demanded than quantity supplied. An inefficiency occurs since at the price ceiling quantity supplied the marginal benefit exceeds the marginal cost. This inefficiency is equal to the deadweight welfare loss.
This graph shows a price ceiling. P* shows the legal price the government has set, but MB shows the price the marginal consumer is willing.to pay at Q*, which is the quantity that the industry is willing to supply. Since MB > P* (MC), a deadweight welfare loss results. Pr and Q’ show the equilibrium price. At P* the quantity demanded is greater than the quantity supplied. This is what causes the shortage.
Q. 5. Define equilibrium price.
Ans. The equilibrium price is the market price where the quantity of goods supplied is equal to the quantity of goods demanded. This is the point at which the demand and supply curves in the market intersect. To determine the equilibrium price, you have to figure out at what price the demand and supply curves intersect.
TERMINAL EXERCISE
Q.1. What is equilibrium price? Explain with the help of diagram.
Ans. Equilibrium price:
(i) Equilibrium price of commodity is the price at which its quantity demanded and quantity supplied are equal.
(ii) If at a given price of the commodity its quantity demanded and quantity supplied are not equal, then price, demand and supply change till the equilibrium price is reached.
(iii) Diagrammatically equilibrium price is determined at the point where demand curve and supply curve intersect with each other.
Q.2. What is excess demand? How is equilibrium between demand and supply restored in case of excess demand?
Ans. Excess demand: When at a price of the commodity, its quantity demanded exceeds its quantity supplied then it is a situation of excess demand. For example, at a price of Rs. 2 per kg, the quantity demanded of potatoes is 30 kg, whereas its quantity supplied is 10 kg. Therefore, we say that at a price of Rs. 2 per kg there is excess demand of potatoes.
| Price per kg. (Rs.) (1) | Market demand per day (kg.) (2) | Market supply per day (kg.) (3) |
| 6 | 10 | 30 |
| 5 | 15 | 25 |
| 4 | 20 | 20 |
| 3 | 25 | 15 |
| 2 | 30 | 10 |
Effects of an excess demand for a commodity on its price: Excess demand results in the following changes:
(i) Price of the commodity starts rising because of the competition among its buyers.
(ii) As the price starts rising its quantity demanded starts falling as the buyers demand less when price rises.
(ii) As the price starts rising, its quantity supplied starts rising as the sellers sell more when price rises.
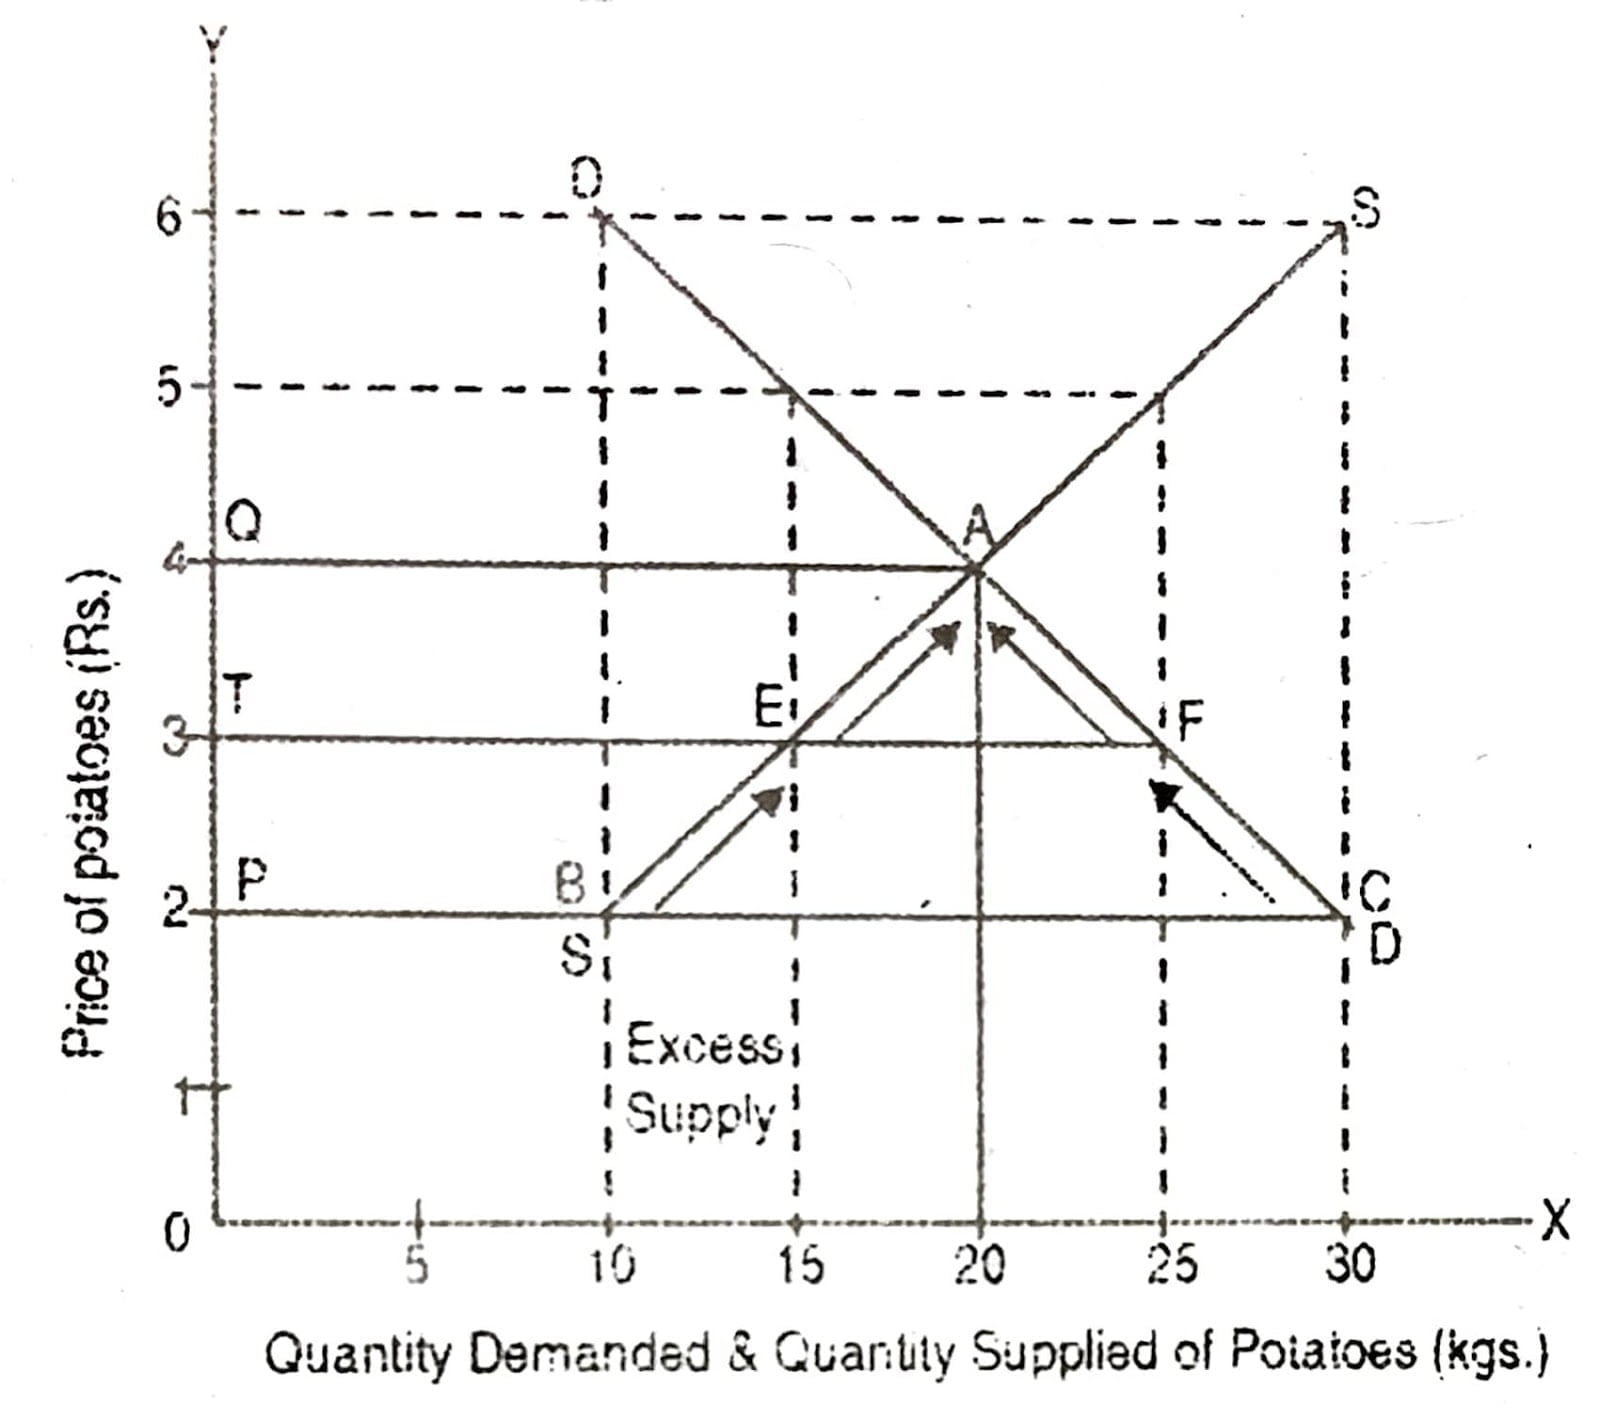
(iv) The rise in the price of the commodity causes contraction of demand and expansion of supply which continues till price reaches a level at which the quantity demanded and quantity supplied are equal.
(v) This is the equilibrium price which also determines the equilibrium quantity.
At the price of Rs. 2 per kg. the quantity demanded and supplied of potatoes is 30 kg. (or PC) and 10 kg, (or PB) respectively. Thus there is an excess demand of 20 kg. (or BC). The buyers will obviously compete to buy the quantity of potatoes they want to buy at this price. This will lead to a rise in price. Suppose the price rises to Rs. 3 per kg. At this price the quantity supplied and quantity demanded is 15 kg. (or TE) and 25 kg. (or TF) respectively. There is an expansion of supply shown by an upward movement along the supply curve from point B to point E and contraction of demand shown by an upward movement along the demand curve from the point C to point F. Still there is excess demand equal to 10 kg. (or EF). This further increases the price and the price rises to Rs. 4 per kg. The demand contracts as shown by movement F to point A and supply expands as shown by movement from point E to point A. At this price, i.e. Rs. 4 per kg. The quantity demanded is equal to 20 kg (or QA) and the quantity supplied is also 20 kg (or QA). Both are equal. So Rs.4 per kg. is the equilibrium price and 20 kg. is the equilibrium quantity and there is no excess demand.
Q.3. What is excess supply? How is equilibrium between demand and supply restored in case of excess supply?
Ans. Excess Supply: If at a given price the quantity supplied of a commodity exceeds its quantity demanded then it is a situation of excess supply, For example, when the price of potatoes is Rs. 6 per kg. Its supply is 30 kg. and demand is for 10 kg. Thus there is excess supply equal to 20 kg.
| Price per kg. (Rs.) | Market demand per day (kg.) | Market supply per day (kg) |
| 6 | 10 | 30 |
| 5 | 15 | 25 |
| 4 | 20 | 20 |
| Equilibrium (D = S) | ||
| 3 | 25 | 15 |
| 2 | 30 | 10 |
Effects of excess supply on the price of the commodity: Whenever there is excess supply of a commodity the following changes take place:
(i) As supply exceeds demand all sellers will not be able to sell the total quantities they want to sell at this price. So there will be competition among sellers. This will reduce the price.
(ii) As the price starts falling, expansion of demand and contraction of supply will take place. This will reduce the excess supply.
(iii) These changes, i.e. fall in price, expansion of demand and contraction of supply will continue till the price reaches that level at which quantity demanded and supplied are equal.
(iv) Thus the excess supply is wiped out and equilibrium price and equilibrium quantity are established.
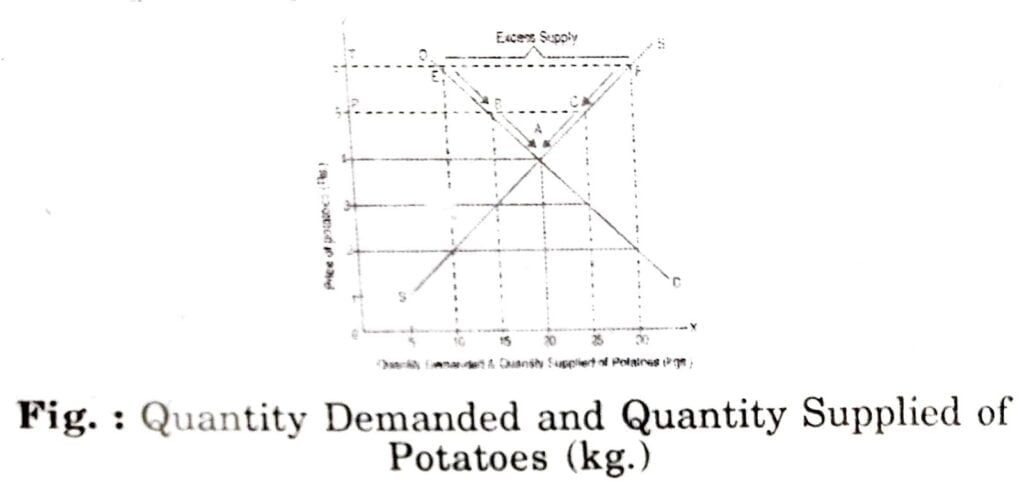
When the price is ₹ 6 per kg. The quantity supplied is 30 kg or (TF) and quantity demanded is only 10 kg or (TE). So, there is an excess supply equal to 20 kgs or (EF). Competition among others reduces the price, say to ₹ 5 per kg. As the price has fallen from ₹ 6 to ₹ 5 there is an expansion of demand and it is shown in the down and movement along the demand curve from point E to point B. And there is contraction of supply due to fall in price. This is shown by down and movement along the supply curve from point F to point C.
At the price of ₹ 5 per kg., there is still excess supply equal to 10 kg, or (BC). This will again inside a fall in price, expansion of demand and contraction of supply. Further downward.movement along the supply curve (contraction of supply) takes us to point A and further downward movement along the demand curve (expansion of demand) takes us to point A. Point A gives the equilibrium price (₹ 4 per kg) and equilibrium quantity demanded and supplied (20 kg) and there is no excess supply. When there is excess demand, the equilibrium price will be higher than the price at which there is excess demand. Similarly, the equilibrium price would be lower than the price at which there is excess supply.
Q.4. Explain the effect of simultaneous increase in demand and increase in supply on equilibrium price and quantity. Use relevant diagrams.
Ans. Determination of price: The price of a commodity is determined by the intersection of its demand and supply curve. The intersection point of demand and supply curves determines the equilibrium price. The equilibrium price of a commodity in a market determines at that point where quantity demanded is equal to the quantity supplied.
The equilibrium price of a commodity can be shown with the help of a diagram based on market demand and market supply of a commodity may rise.
Market demand and market supply schedules of rice (in quintals)
| Price of Rice | Quantity demanded | Quantity supplied |
| 3000 | 40 | 240 |
| 2500 | 80 | 200 |
| 2000 | 140 | 140 |
| 1500 | 220 | 80 |
| 1000 | 320 | 20 |
On the X-axis we have shown both the quantity demanded and supplied of rice and on the Y-axis the price of rice per quintal. The DD’ and SS’ are the demand curve and supply curve respectively. These curves intersect at point E and determines the price of rice at Rs. 2000 per quintal where demand for rice is equal to the supply of rice.
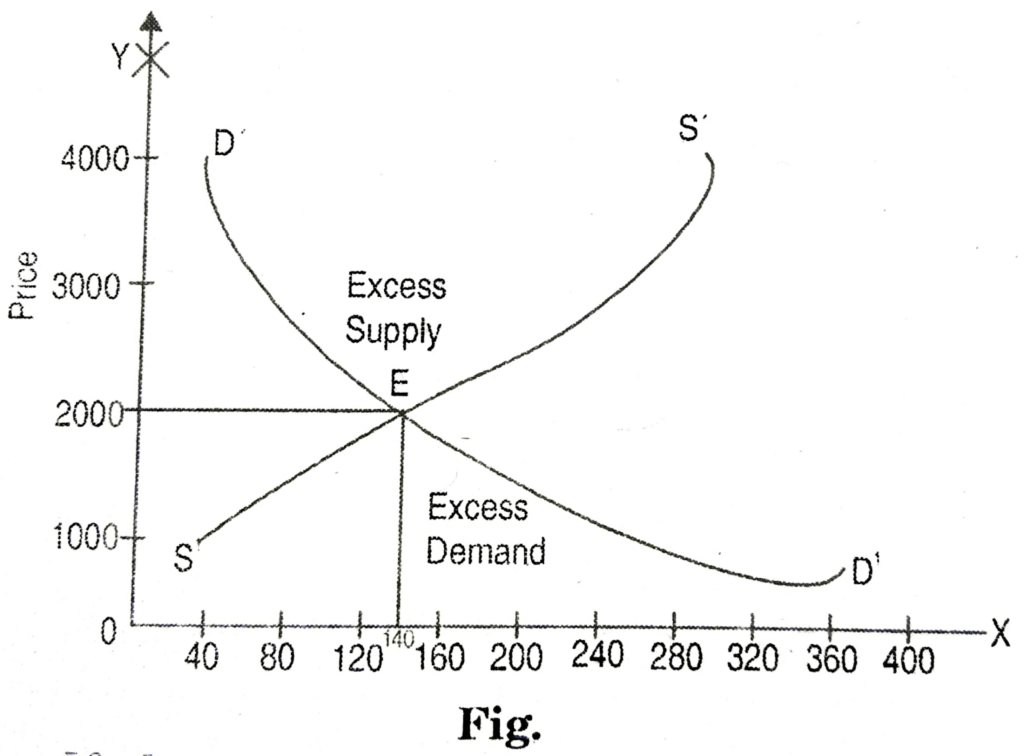
If the market price deviates from the equilibrium price, then the interaction of market forces bring back prices at equilibrium level. Let us assume when the price of rice in market is Rs. 3000 per quintal, then at this price demand is less than its supply. Hence, there will be competition among the sellers to supply at this higher price. Since demand is less than its supply, therefore, sellers will reduce the price of rice till that point where demand becomes equal to its supply. A reduction in price of rice will increase the demand and decrease the supply of rice and ultimately these two will become equal at the equilibrium price.
Similarly when the market price is less than the equilibrium price, the demand for rice is more than its supply. Hence, its price in the market will increase and ultimately it will increase to that level where demand for rice becomes equal to supply.
Thus, interaction of demand and supply forces brings equality between them and determines the price of commodity in the market.

Hi! my Name is Parimal Roy. I have completed my Bachelor’s degree in Philosophy (B.A.) from Silapathar General College. Currently, I am working as an HR Manager at Dev Library. It is a website that provides study materials for students from Class 3 to 12, including SCERT and NCERT notes. It also offers resources for BA, B.Com, B.Sc, and Computer Science, along with postgraduate notes. Besides study materials, the website has novels, eBooks, health and finance articles, biographies, quotes, and more.


