
NIOS Class 10 Social Science Chapter 14 Population: Our Greatest Resource Solutions to each chapter is provided in the list so that you can easily browse through different chapters NIOS Class 10 Social Science Chapter 14 Population: Our Greatest Resource and select need one. NIOS Class 10 Social Science Chapter 14 Population: Our Greatest Resource Question Answers Download PDF. NIOS Study Material of Class 10 Social Science Notes Paper 213.
NIOS Class 10 Social Science Chapter 14 Population: Our Greatest Resource


Also, you can read the NIOS book online in these sections Solutions by Expert Teachers as per National Institute of Open Schooling (NIOS) Book guidelines. These solutions are part of NIOS All Subject Solutions. Here we have given NIOS Class 10 Social Science Chapter 14 Population: Our Greatest Resource, NIOS Secondary Course Social Science Solutions for All Chapters, You can practice these here.
Population: Our Greatest Resource
Chapter: 14
SOCIAL SCIENCE
TEXT BOOK QUESTIONS WITH THEIR ANSWERS
INTEXT QUESTIONS 14.1
Q. 1. What is meant by resources?
Ans: Something that can be used or reused is called resource.
Q. 2. Enumerate qualities that are essential for making human being a resource.
Ans: Education, health and nutrition, specialized training are essential for making human a resource.
INTEXT QUESTIONS 14.2
Q. 1. Which one of the following states has the highest density of population according to 2001?
(a) West Bengal
(b) Kerala
(c) Tamil Nadu
(d) Uttar Pradesh
Ans: (a) West Bengal.
Q. 2. The population of a district is 3,00,000 and its area is 1,000 sq. km. What would be the density of population?
(a) 150 persons sq./km
(b) 200 persons sq./km
(c) 250 persons sq./km
(d) 300 persons sq/km.
Ans: (d) 300 persons sq./km.
Q. 3. Mention four important factors that are responsible for high density of population in big cities like Delhi, Mumbai, Kolkata and Chennai.
Ans: 1. Industrialisation.
2. Urbanization
3. Employment opportunities
4. Means of transportation and communi-
cation.
Q. 4. Why is density of population of Uttarakhand low? Give two reasons.
Ans: The reasons are:
(i) Rugged topography.
(ii) Harsh climate conditions.
INTEXT QUESTIONS 14.3
Q. 1. If in an area birth rate is 45 per thousand and death rate is 25 per thousand what would be the natural growth rate?
(a) 15 per 1000
(b) 18 per 1000
(c) 20 per 1000
(d) 25 per 1000
Ans: (c) 20 per 1000.
Q. 2. Which one of the following is the main reasons for rapid increase in population of India?
A – High birthrate and high death rate
B – Low birthrate and low death rate
C – High birth rate and low death rate
D – Low birth rate and high death rate
Ans: (c) High birth rate and low death rate.
Q. 3. Why is 1921 called the year of the great demographic divide?
Ans: The year 1921 shows decline in population but after that it has been increasing continuously.
INTEXT QUESTIONS 14.4
Q. 1. According to 2001 census, the sex ratio of India is:
(a) 920
(b) 927
(c) 933
(d) 943
Ans: (c) 933.
Q. 2. The percentage of urban population according to 2001 census is:
(a) 27.8
(b) 26.7
(c) 25.7
(d) 24.0
Ans: (a) 27.8.
Q. 3. What would be the result if the dependency ratio is more?
Ans: Government has to invest more for the welfare of dependent population and hence less available fund for greater developmental works in country.
Q. 4. State any two reasons responsible for unfavorable sex ratio in India.
Ans: The reasons are:
1. Discrimination against females.
2. Female foeticide and infansticide
INTEXT QUESTIONS 14.5
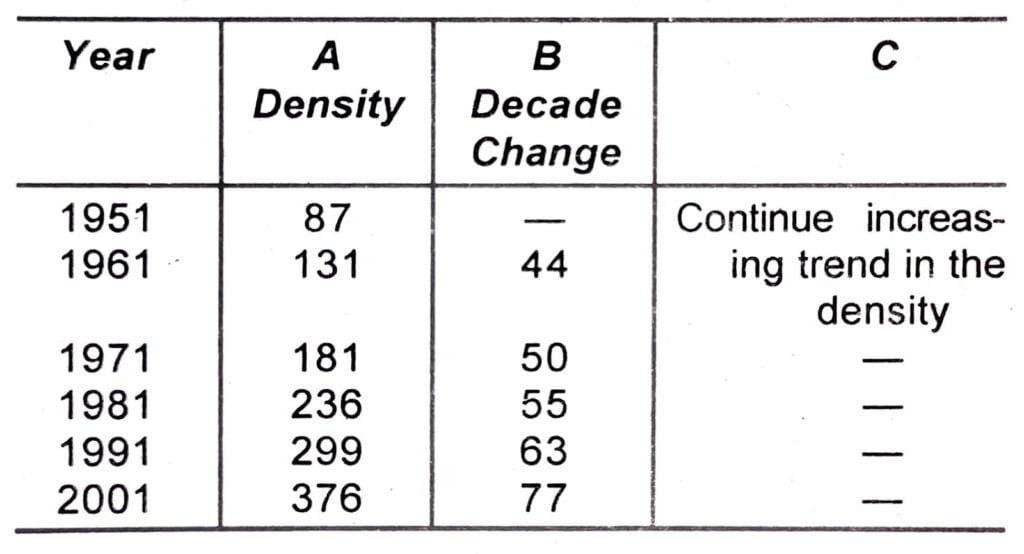
Q. 1. Suppose a particular district have an area of 200 sq. km. The same district records the total number of persons as 17,400, 26,200, 36,200, 47,200, 59,800, 75,200 according to 1951, 1961, 1971, 1981, 1991 and 2001 Census respectively.
A. Calculate the density of popula- tion for all six census.
B. Find out the decade change in density
C. Can you find any trend from your calculation of population?
Ans:
TERMINAL EXERCISES
Q. 1. Define sex ratio. Why is the sex ratio in India unfavorable?
Ans: Sex ratio is defined as the number of females per thousand males in the total population. It is 933 in India according the census of 2001. It is unfavorable to females. It is because that major states like Uttar Pradesh, Bihar, Orissa, Madhya Pradesh given less importance to female in almost every walk of life. They are no treated well starting from their birth till the last date. Hence female mortality rate is high in these states.
Q. 2. Define population growth rate and explain how it is arrived at.
Ans: From total number of deaths in a given territory and in a given period we can calculate death. Reducing death rate from birth rate we arrive at natural growth rate.
Q. 3. What inferences can we draw from the age composition data of India?
Ans: Inferences we can draw that there are three age groups like children (0-14 years), adult (15-60 years) and old (60 + years). Children and old form the dependent population and adults make the earning population. It is noted that children population is decline and population of adult is increasing since 1971.
Q. 4. How can we turn our huge population into a resource?
Ans: Without people nothing can be produced. We generally view population from two angles either as a burden and as a resource. The view of resources has not received much attention. In people (population) when we make investment it is likely that some may turn into resource which we call human capital. It has been proved that by large investment. people can be turn it into a resource. In other words, they increase productivity of the country. It is the need of the day and much more so in the case of India as it has a large population to be turned people into resources by making appropriate investment.
Q. 5. Define the following terms:
(i) Density of population.
Ans: The density of population is people’s living in an unit area. It is usually expressed as number of people per square kilometer.
(ii) Birth rate, death rate and growth rate.
Ans: Birth rate: The birth rate is the number of live births per thousand child in a year.
Death rate: Death rate is the number of deaths per thousand persons in a year.
Growth rate: Reducing the death rate from birth rate is the called the growth rate.
(iii) Literacy
Ans: Literacy is an indicator of the development of the society. As per the census a person aged seven and above, who can both read and write with understanding in any language is treated as literate.
Q. 6. Explain the National Popula- tion Policy.
Ans: A sub-committee of population was set-up even before independence in 1938 by National Planning Commission. After independence in 1952, India was the first country in the world to launch a national population programme emphasizing family. planning. The aim of programme was to reduce birth rate to stabilize the population. at a level consistent with the requirement of national economy. The National Population Policy, 2000 has made a qualitative departure in approach to population issues. It states that the objectives of economic and social development is to improve the quality of lives that people lead to enhance their well being and to provide the opportunities and choices to become productive assets in the society. Stabilising population is an essential. requirement for promoting sustainable development.
The immediate objectives of the N.P.P. 2000 is to address the unmet needs for contraception, health care infrastructure and health personnel and to provide integrated service delivery for basic reproductive and child health care. The medium term objective is to bring the total fertility rate to replacement level by 2010. The long term objective is to achieve a stable population by 2045 with sustainable economic growth, social development and environmental protection.
Q. 7. What is meant by women empowerment? How does women empowerment empower the whole society/community?
Ans: The empowerment of women is very crucial for improving the quality of population as a human resource. Women in although making up almost 50% of the total population have been looked down upon and subjected to discrimination. The role of women in our country has been limited to looking after their families also being much spectators to all kinds of discrimination, ill treatment and crimes against them.
Some steps have been taken that their will be qualitative change in the status of women. The empowerment of women received a major boost when the 74th Constitutional Amendment Bill provides 33% reservation of seats, for women in Panchayati Raj institution and urban local bodies were passed by the Parliament. Another Amendment Bill has been introduced providing 33% reservation for women in the Parliament (House of People) and Assemblies.
The ultimate object is to facilitate the advancement, development and empower- ment of women and to eliminate all forms of discrimination. This steps will also ensure their active participation in all spheres of life.
SOME OTHER IMPORTANT QUESTIONS FOR EXAMINATION
MULTIPLE CHOICE QUESTIONS
Q. 1. Choose the correct answer from the given alternatives:
(i) Which of the following factors not been responsible for a high density of population in Uttar Pradesh?
(a) Soil fertility
(b) Favorable climate
(c) Mountainous terrain
(d) Availability of means of transport.
Ans: (c) Mountainous terrain.
(ii) In which of the following has the availability of minerals been respon- sible for a high density of population?
(a) Punjab
(b) Tamil Nadu
(c) Haryana
(d) Jharkhand
Ans: (d) Jharkhand.
VERY SHORT ANSWER TYPE QUESTIONS
Q. 1. Why is it necessary to change the present occupational structure of India? Explain with reasons.
Ans: The present occupational structure of our country is very top sided. About 2/3 of the population is engaged on agriculture. Only 1/4th of the population is in the tertiary sector. A major section of the population should be engaged in off value addition as it helps in the generating more income in the country by increasing jobs opportunities and value of products resulting in increasing rate of economic development.
Q. 2. What is census?
Ans: Census is the official counting of the population etc. taken after every ten years.
Q. 3. Define the sex ratio.
Ans: The sex composition of a population is often expressed with the help of the ratio which is known as sex ratio. It is computed as number of females per thousand males. For example 1000: 934. It means there are 934 females for 1000 males population.
Q. 4. Why is population of India by and large male dominated?
Ans: The reasons are:
(i) Proper attention for female child is not given.
(ii) Families prefer the birth of a male child more than that of a female child.
Q. 5. Why was sex ratio remain unfavorable to females in India?
Ans: This is because of
(i) the people of India give more importance to male child. They consider the girl child as burden on them.
(ii) Due to illiteracy, girls/women are not avail of the medical facilities.
(iii) The demon of dowry system and ignorance of parents result in foeticide.
Q. 6. What is sex-ratio in India as per Census of 2001?
Ans: It is 933 females per 1000 males.
Q. 7. Name the states of higher sex-ratio.
Ans: Kerala and Pondicherry. It is 1058/ 1000 in Kerala and 1001/1000 in Pondicherry.
Q. 8. What are the activities included in occupational structure?
Ans: These are:
(i) Primary.
(ii) Secondary.
(iii) Tertiary. and
(iv) Quaternary activities.
Q. 9. Who is considered literate as per Census of 2001?
Ans: A person aged 7 years and above who can read and write with understanding in any language was treated as literate.
Q. 10. What is the occupational structure of population in India?
Ans: India’s 64% population is employed in primary activities (i.e. mainly agro-based), 13% in industries (secondary activities) and the rest 25% is engaged in tertiary sector including minuscule people in quaternary. sector.
Q. 11. Explain the reason for less proportion of females than that of males in India.
Ans: It is because of Indians prefer the birth of a male child more than that of a female child. It has been seen in some areas that a female child is killed at her birth or even prior to that if modern machines declare its being a girl child.
Q. 12. What is India’s birth rate at present?
Ans: It is recorded 26.1 per thousand every year (2001).
Q. 13. What is overall rate of literacy in India as per 2001 census?
Ans: It is 65.35%.
Q. 14. What is meant by dependent population?
Ans: Dependent population consists of children below 15 years i.e. in the group of 0-14 years and the aged 60 years and above including women.
Q. 15. What is the growth rate of population as per census of 2001?
Ans: It is 1.93% per annum.
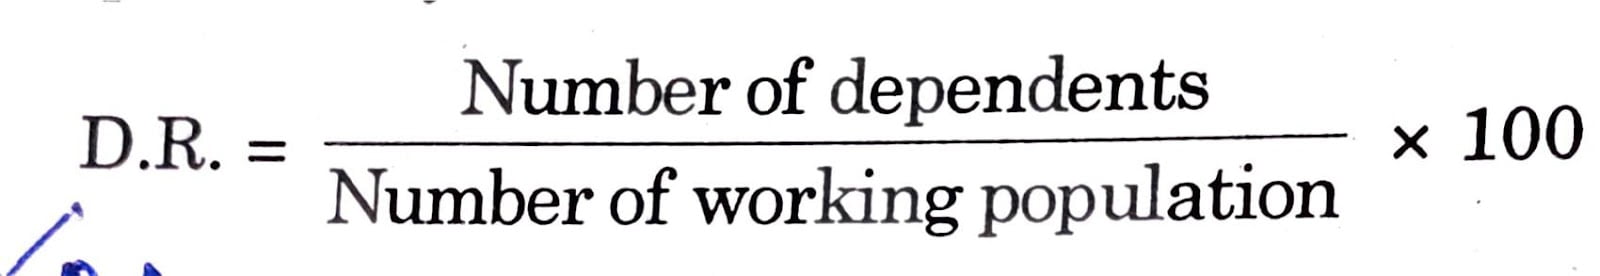
Q. 16. How can you calculate the dependency ratio?
Ans: We can calculate the dependency ratio dividing dependent population by the working population and then multiplying the quotient by 100.
Q. 17. What is the life expectancy at birth in India?
Ans: It is 64.6 years as recorded in 2003.
Q. 18. Mention the death rate in India.
Ans: It is 8.7 per thousand persons.
Q. 19. What is the legally sanctioned age for marriage of boys and girls in India?
Ans: It is 21 and 18 years respectively. Recently the Government is considering a proposal to reduce the marriageable age of the girl in view of present developments seen in the society here.
Q. 20. Mention the comparative increase in urban population in the census of 1951 and that of 2001.
Ans: It was increased from 17.29% to 27.78% during these two censuses due to migration of rural population to megacities.
Q. 21. Mention the increase in million plus cities in one decade i.e. 1991-2001.
Ans: It is from 23 to 35 in number of million plus cities.
Q. 22. Whether you think the aged group is economically unproductive?
Ans: No, they may be productive, yet, they needed medical care and nutritious diet in order to maintain physical health.
Q. 23. What is the percentage of aged groups?
Ans: It is 6.97% in India as per census of 2001.
Q. 24. What is the relation between annual growth rate and absolute increase in the decade?
Ans: It is inversely proportional because when the annual growth rate shows decreasing trend, the absolute population increases. For example, in the Census of 1981 the absolute increase was 135.17 million while the annual growth rate was 2.22%. In 1991 the absolute increase was recorded 163.09 million while annual growth rate showed declining trend i.e. 2.14% from 2.22% of 1981.
Q. 25. What is magnitude?
Ans: It refers to absolute increase in population each decade. e.g. Magnitude was 42.43 million when total population was 361 million in 1951.
Q. 26. What is a census operation ? How is it useful to us?
Ans: For collecting a meaningful data about various socio-economic and demographic aspects of our population the government of India with the assistance of states, conducts a comprehensive operation called census. It is hold the beginning of each decade. The latest census operation was completed at the beginning of the year 2011.
SHORT ANSWER TYPE QUESTIONS
Q. 1. Distinguish between Birth Rate and Growth Rate.
Ans:
| Birth Rate | Growth Rate |
| (i) The number of live births thousand persons during a certain period of time is called birth rate. | (i) It is the difference between the birth rate and death rate per 1000 persons. |
| (ii) It is calculated for every 1000 persons for a year. | (ii) The growth rate of population is expressed as percentage during a certain period of time. |
| (iii) A high birth rate shows an increasing population. | (iii) When birth rate is more than death rate, it shows a positive growth rate. |
Q. 2. Why are the years 1921 and 1951 most significant in the history of population growth in India?
Ans: The population of India is increasing at a rapid rate during 20th century. Between 1901 and 1981 it has increased almost three times. The population growth has been fluctuating during this period.
From the next table it is clear-
(i) Till year 1921, the population of India remained more or less stable. During the year 1901-1921 there was an increase in population by only 13 million (at the rate of 3% per decade). This was due to a large death toll because of great influenza (1911-21), First World War (1914), epidemics (1918) and droughts (1920). After 1921 the population began to rise at slow but definite rate. Thus, the year 1921, is known as a great divide in our demographic history.
(ii) Till 1951, there has been a steady growth of population. After 1951 the population rose at a rapid rate. Thus the first stage of population growth was over by the year 1951. Between 1951-81, a period of 30 years, our population has been doubled almost at a growth rate of 2.4% per annum.
Q. 3. Distinguish between Natural Growth and Population Growth.
Ans:
| Natural Growth | Population Growth |
| (i) Natural growth is the difference between birth rate and death rate per 1000 persons. | (i) Population growth is the increase in population due to natural growth and immigration. |
| (ii) The natural growth is expressed in percentages. | (ii) The growth of population is the difference between total population over a certain period. |
| (iii) The natural growth is related to the stage of economic development and the standard of public health. | (iii) The growth of population is affected by economic development and immigration. |
Q. 4. Describe three harmful effects of growing population in India.
Ans: Harmful effects of growing population in India:
(a) Food Problem: It is not always possible to increase food production beyond a certain limit to provide foods to the over growing population.
(b) Unemployment: It is also not possible to give employment to the every increasing number. Unemployed persons may turn into thieves, dacoits, terrorists and miscreants. They thus, join with anti-social elements and numerous problems to the nation. pose
(c) Ill-effects on capital formation: On account of unemployment the incomes as well as savings ar badly affected. There cannot be any investment without savings. Thus, there is adverse effect on capital formation.
Q. 5. Highlight the significance of socio-economic factors affecting the distribution of population.
Ans: People have tried to modify the physical forces through their technological know-how and socio-political organization. Supporting capacity of different countries, therefore, varies widely. Primary activities cannot support a high density of population as do the secondary and tertiary activities. As such, highly urbanized and industrialized districts have very high density of population. Mumbai, Kolkata and Delhi are typical examples of such areas. Similarly districts adopting modern scientific methods of farming and using high yielding variety of seeds have high density of population such as western Uttar Pradesh, Haryana and Punjab fall in this category.
Q. 6. Why is the pressure of rural population on agriculture compara- tively high in north-eastern and northern states of India?
Ans: River valleys with thick fertile soils, receiving sufficient rainfall and having irrigation facilities are usually densely populated.
The pressure of rural population on agriculture is high in northeastern states because this region is mountainous, the rainfall is heavy and river valleys are fertile. The farmers grow rice which is their staple food. This part is not rich in minerals and no heavy industries. Hence, the rural people are engaged in farming and in allied domestic cottage industries. Hence, pressure of rural people is high on agriculture.
Northern states comprise of Satluj- Ganga plain. The soil is very fertile, there are many canals for irrigation which compensate the low rainfall which this region receives. This region is called granary of India. The farmers have adopted new scientific techniques of farming. They make use of chemical fertilizers and high yielding variety of seeds. The production of wheat, rice, cotton etc. gives high income to the farmers. Hence, the pressure of rural population on agriculture is comparatively high in comparison to other regions of India.
Q. 7. Distinguish between Productive population and Dependent population.
Ans:
| Productive population | Dependent population |
| (i) Persons engaged in some useful productive occupations constitute productive population. | (i) Persons who no longer contribute directly to an economic activity constitute dependent population. |
| (ii) These persons are also called working population. | (ii) These persons are also called non- workers. |
| (iii) Generally the persons between 15 to 60 years age group belong to it. | (iii) Generally persons above 60 years and children below 15 years belong to this group. |
| (iv) These persons contribute something to economic activities and earn their living. | (iv) These persons depend upon workers for their living. These are unemployed persons. |
| (v) About 33% of total population of India is productive population. | (v) About 67% of the total population of India is dependent population. |
Q. 8. What are the significant features of the National Population Policy, 2000?
Ans: Features of the National Population Policy, 2000. 1. It has identified adolescents as one of the under served population groups vis bereaved of reproductive and health care services.
2. Its main objective is to check the increasing trend of the population.
3. The prompt development of the country by improving the quality of life of people.
4. To enhance family planning programmes and lay special emphasis on birth control measures.
5. To stabilise population by 2045.
6. To impart free and compulsory school education upto 14 years of age.
7. To reduce infant mortality rate of 30 per 1000 live births.
8. To immunize all children against ailments.
9. To promote delayed marriage for girls.
10. To make family welfare, a people centered programme.
Q. 9. Distinguish between population growth and population change.
Ans: Distinction between population growth and population change:
| Population Growth | Population Change |
| 1. It is determined by the number of individuals added to the population and the number of individuals lost. | 1. Birth rates, death rates and migration determine the population change. |
| 2. Magnitude and pace are the two parameters that determine the population growth. | 2. High birth rate and declining death rates result in higher rates of population change. |
| 3. Growth is worked out by adding initial population size, birth rate and immigration and subtracting from the gross total, the death rates + emigration rates. | 3. Population change may be positive or negative. For example, negative if death and emigration rates are highest than the birth rate and immigration otherwise positive in its reversal. |
| 4. Low annual rate yields a large absolute increase in a large population. Eg. the annual rate decreases to 1.93% in 2001 from 1991’s 2.22% but there is absolute increase from 163.09 million population of 1991’s to 182.32 million in 2001. | 4. It depends on several factors i.e., public awareness to family planning, restrictive legislation on immigration etc. |
Q. 10. Describe the basic factors affecting population. (M. Imp.)
Or
Describe three components of population growth.
Ans: The basic factors affecting the population of India are as under:
(i) Birth Rate: It is the number of births per 1000 individuals of a population per annum. It increases both population size and population density. According to 2001 Census, birth rate of Indian population was 26 per 1000.
(ii) Death or Mortality Rate: It is expressed as the number of death per 1,000 individuals of a population per year. It decreases both population size and population density. According to 2001 Census, death rate of Indian population was 8 per 1000 persons.
(iii) Immigration: It is the entry of more individuals into a local population of a species in a specific area from outside due to more favorable conditions in that area. It increases population size of that area Eg. Immigration of many persons from various states into Delhi.
(iv) Emigration: It is the departure of some individuals from a local population of a specific area to another area due to unfavorable conditions in the former. It decreases population size of that area Eg. Emigration of many Indians to Arab countries.
(v) Environmental resistance: It is the sum of all the inhibitory factors which prevent the biotic potential to be realized so does not allow a population to soar towards infinity. It includes various harmful environmental factors like scarcity of food and shelter, natural calamities like tsunami, floods etc, and certain biotic factors like pathogens, parasites and predators.

Hi! my Name is Parimal Roy. I have completed my Bachelor’s degree in Philosophy (B.A.) from Silapathar General College. Currently, I am working as an HR Manager at Dev Library. It is a website that provides study materials for students from Class 3 to 12, including SCERT and NCERT notes. It also offers resources for BA, B.Com, B.Sc, and Computer Science, along with postgraduate notes. Besides study materials, the website has novels, eBooks, health and finance articles, biographies, quotes, and more.