
Class 11 Economics Chapter 9 Organisation of Data, (Assam Higher Secondary Education Council) AHSEC Class 11 Economics Question Answer in English Medium each chapter is provided in the list of AHSEC so that you can easily browse through different chapters and select needs one. Assam Board Chapter 9 Organisation of Data Class 11 Economics Question Answer can be of great value to excel in the examination.
AHSEC Class 11 Economics Chapter 9 Organisation of Data


Class 11 Economics Chapter 9 Organisation of Data Notes cover all the exercise questions in SCERT Textbooks. The SCERT Class 11 Economics Chapter 9 Organisation of Data Solutions provided here ensure a smooth and easy understanding of all the concepts. Understand the concepts behind every chapter and score well in the board exams.
Organisation of Data
Chapter – 9
PART – B
VERY SHORT ANSWER QUESTIONS
1. Which of the following alternatives is true ?
(i) The class midpoint is equal to :
(a) The average of the upper class limit and the lower class limit.
(b) The product of upper class limit and lower class limit.
(c) The ratio of the upper class limit and the lower class limit.
(d) None of the above.
Ans: (a) The average of the upper class limit and the lower class limit.
(ii) The frequency distribution of two variables is known as
(a) Univariate Distribution.
(b) Bivariate Distribution.
(c) Bivariate Distribution.
(d) None of the above.
Ans: (b) Bivariate Distribution.
(iii) Statistical calculations in classified data are based on
(a) the actual values of observation.
(b) the upper class limits.
(c) the lower class limits.
(d) the class midpoints.
Ans: (a) The actual values of observation.
(iv) Under Exclusive method.
(a) the upper class of a class is excluded in the class interval.
(b) the upper class of a class is included in the class interval.
(c) the lower class of a class is excluded in the class interval.
(d) the lower class of a class is included in the class interval.
Ans: (a) the upper class of a class is excluded in the class interval.
(v) Range is the
(a) difference between the largest and the smallest observations.
(b) difference between the smallest and the largest observations.
(c) average of the largest and the smallest observation.
(d) ratio of the largest to the smallest observation.
Ans: (a) difference between the largest and the smallest observations.
2. Define the term classification.
Ans: It is the process of grouping of the given data into homogeneous classes according to their common characteristics.
3. What is geographical classification ?
Ans: In this classification, the statistical facts are classifieds on the basis of different locations or geographical position.
4. What is chronological classification ?
Ans: Here the data are classified on the basis of time.
5. Define qualitative classification.
Ans: Here, classes are made on the basis of some attributes or qualities.
6. Define quantitative classification.
Ans: This type of classification is made on the basis of measurable characteristics.
7. Define statistical series.
Ans: It is a systematic arrangement of quantitative information.
8. What do you mean by individual series ?
Ans: It is a series, which includes the values of all the items of group.
9. What is discrete series ?
Ans: It shows quantitative variables appearing with an integral difference along with frequency element.
10. What is continuous series ?
Ans: Here, the data is classified into certain groups or a range of values of the variable listed in a particular group along with its frequency element.
11. What is meant by class interval ?
Ans: It refers to the size of each grouping of data.
12. What is meant by class frequency ?
Ans: Number of observations falling in a particular class interval is called frequency of that class.
13. What are class limits ?
Ans: These are the upper and lower limits of each class interval.
14. How mid values are calculated ?
Ans: These are found out by adding the upper and lower limits of a class and dividing the sum by 2.
15. Define variable.
Ans: Some measurable universe is known as variable.
16. What is meant by tabulation ?
Ans: It is a systematic arrangement of data in columns and rows.
17. What is meant by “array of data” ?
Ans: It is a series consisting of individual observations arranged systematically in ascending or descending order.
SHORT & LONG TYPES ANSWER QUESTION :
1. Mention two features of classification.
Ans: Two features of classification
(a) Homogeneous facts are put into a particular group.
(b) It shows unity in diversity.
2. Give two objectives of classification.
Ans: The two objectives of classification are:
(a) To condense the mass of data
(b) To make analysis and interpretation easy.
3. What are the main types of series on the basis of characteristics ?
Ans: The main types of series on the basis of characteristics are :
(a) Time series.
(b) Spatial series.
(c) Condition series.
4. Mention the type of series on the basis of construction.
Ans: The type of series on the basis of construction are :
(a) Ungrouped or individual series.
(b) Grouped data or Frequency distribution.
5. Mention two objective of tabulation.
Ans: Two objective of tabulation are :
(a) To bring out the essential features of the data.
(b) To make the data comparable.
6. Name the main five parts of a table.
Ans: The main five parts of a table are :
(a) Table Number.
(b) Title.
(c) Head note.
(d) Captions.
(e) Stubs.
(f) Body.
(g) Food note.
(h) Source.
7. What are the main features of good classification.
Ans: The main features of good classification are:
(a) Homogeneity.
(b) Exactness.
(c) Stability.
(d) Suitability.
(e) Flexibility.
(f) Mutually exclusive.
(g) Mathematical accuracy.
8. Can there be any advantage in classifying things ? Explain with an example from your daily life.
Ans: Classification is the process of arranging data into homogeneous groups or classes according to their common characteristics.
It provides the facility of comparison of homogeneous data. An example in this regard is given as follows―
9. What is Variable ? Distinguish between a discrete and a continuous variable.
Ans: A variable is quantity which can assume a range or numerical value. It can be income, wages, marks etc. We can notate as X,Y, or Z.
Distinction :
(a) Discrete series are expressed with their integral values but continuous series involve fractional values also.
(b) Discrete series can be measured for their actual values, but continues series can not express actual values and their numbers.
10. Explain the ‘exclusive’ and ‘inclusive’ methods used in classification of data.
Ans: The exclusive’ and ‘inclusive’ methods used in classification of data are :
(a) Exclusive series excludes upper value in that class rather it is included in next class. But, in inclusive series, both upper and lower values are included in that class only.
(b) In exclusive series, upper value of a class and lower value of succeeding class are equal. However, in inclusive series, upper value is different from lower value of succeeding class.
(c) For calculation, exclusive series is never changed into inclusive from. But, inclusive series, for calculation, is needed to be change into exclusive form.
11. What is ‘loss of information’ in classified data ?
Ans: While making classification of data, it does not show the details that are found in raw data. There is a loss of information in classifying raw data though much is gained by summarising it as a classified data.
12. Do you agree that classified data is better than raw data ?
Ans: Yes, because of the following reasons ―
(a) Classification presents data in a simple, logical and understandable form.
(b) It brings out clearly the points of similarity and dissimilarity.
(c) It facilitates comparison.
(d) It prepares the data ready for tabulation.
(e) It helps in condensation of mass of data.
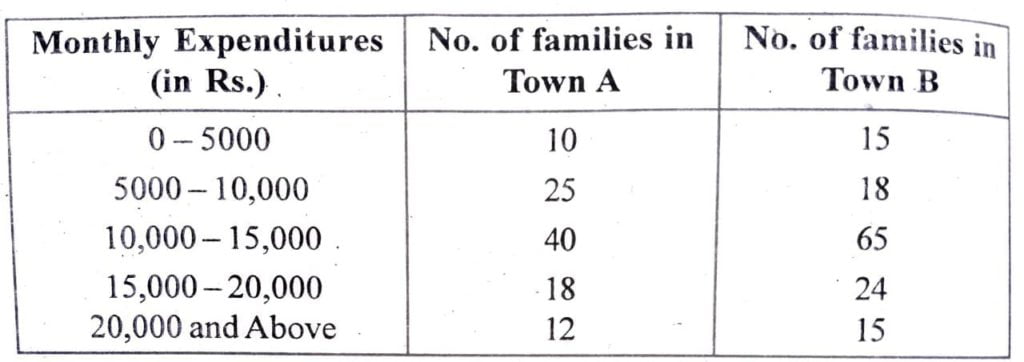
13. Distinguish between univariate and bivariate frequency distribution.
Ans: Univariate frequency distribution make classification for a single variable and it’s frequency. For example, marks in economics and number of students.
Bivariate frequency distribution involve two variable and their common frequencies. For example, marks in statistics and marks in economics along with common number of students for both the subjects.
14. Distinguish between exclusive series and and inclusive series.
Ans: Distinguish between exclusive series and and inclusive series are :
(a) Exclusive series excludes upper value in that class rather it is included in next class. But, in inclusive series, both upper and lower values are included in that class only.
(b) In exclusive series, upper value of a class and lower value of succeeding class are equal. However, in inclusive series, upper value is different from lower value of succeeding class.
(c) For calculation, exclusive series is never changed into inclusive from. But, inclusive series, for calculation, is needed to be change into exclusive form.
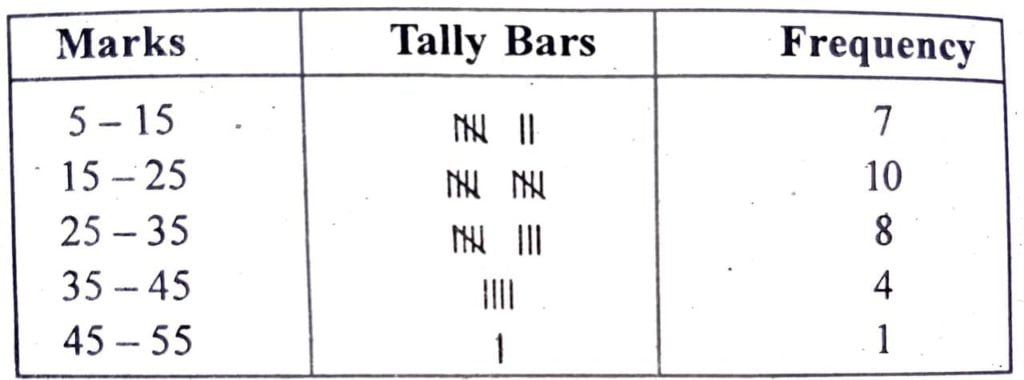
15. From the following observation, prepare a frequency distribution in according order, both in exclusive method and inclusive method.
Marks in English of 30 students in a class.
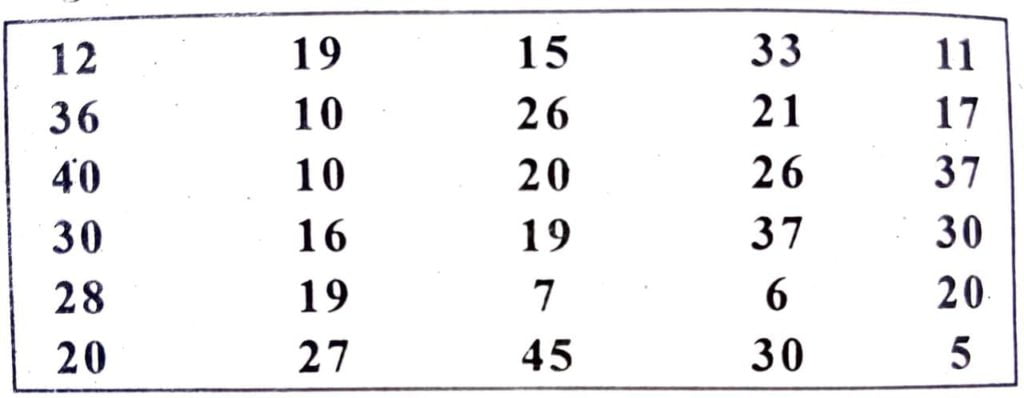
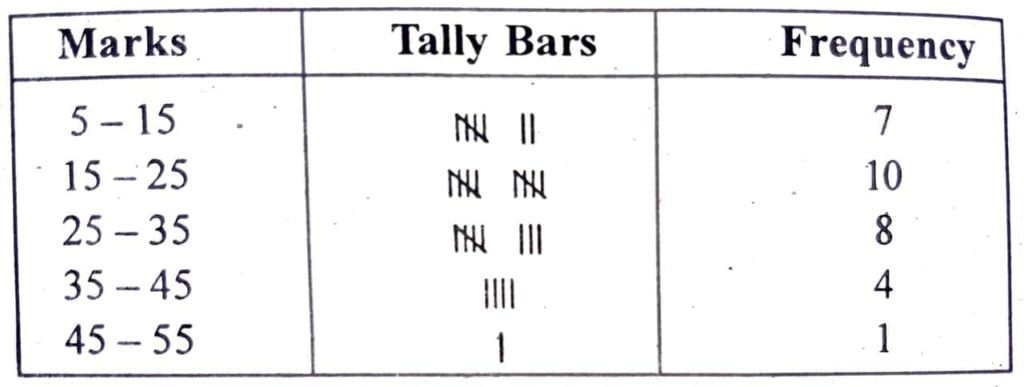
Ans: Exclusive Formulation :
Taking class as 5 to 15 taking 10 as class interval
Inclusive Formulation :
Taking class as 5 to 14 taking 10 as class interval.
16. Distinguish between individual, discrete and continuous series.
Ans: Distinguish between individual, discrete and continuous series :
(a) Individual series have only one frequency for each, whereas discrete and continuous series have different amount of frequencies.
(b) Individual and discrete series can be measured for their actual values, whereas, continuous series can’t express actual values and their number.
(c) Individual and discrete series are expressed with thin integral values but continuous series involve fractional values also.
17. Distinguish between tabulation and clarification.
Ans: Distinguish between tabulation and clarification are:
(a) The data collected is firstly classified and them tabulated. This sequence in no case, can be disturbed.
(b) In classification process, data are classified into different classed according to similarities and dissimilarities whereas in tabulation, classified facts are placed in columns and rows.
(c) Classification is a process of statistical analysis. But tabulation is the process of presenting the data in suitable manner.
18. From the following observation, prepare a frequency distribution in ascending order, both in Exclusive method and Inclusive method.
Marks in English of 30 students in a class.
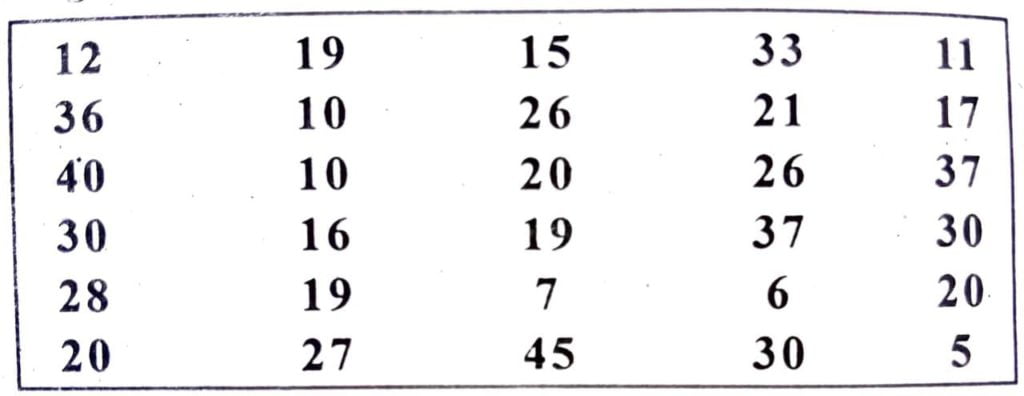
Ans: Exclusive Formulation :
Taking starting class as 5 to 15 taking 10 as class interval
Inclusive Formulation :
Taking starting class as 5 to 14 taking 10 as class interval. See the Original
19. Give five rules in framing a good table.
Ans: The five rules in framing a good table are:
(a) Table should be as simple as possible.
(b) It should be self explanatory.
(c) It should have proper size and spacing.
(d) Unit of measurement must be clearly defined.
(e) Source of data must be mentioned below the table.
20. Give main objectives of tabulation.
Ans: The main objectives of tabulation are:
(a) Purpose of investigation.
(b) Bring out essential features of the data.
(c) Comparison.
(d) Simplification.

Hi, I’m Dev Kirtonia, Founder & CEO of Dev Library. A website that provides all SCERT, NCERT 3 to 12, and BA, B.com, B.Sc, and Computer Science with Post Graduate Notes & Suggestions, Novel, eBooks, Biography, Quotes, Study Materials, and more.
