
NIOS Class 12 Accountancy Chapter 33 Accounting Ratios – II Solutions English Medium As Per New Syllabus. to each chapter is provided in the list so that you can easily browse throughout different chapters NIOS Class 12 Accountancy Chapter 33 Accounting Ratios – II Notes and select need one. NIOS Class 12 Accountancy Chapter 33 Accounting Ratios – II Question Answers Download PDF. NIOS Study Material of Class 12 Accountancy Paper Code: 320.
NIOS Class 12 Accountancy Chapter 33 Accounting Ratios – II
Also, you can read the NIOS book online in these sections Solutions by Expert Teachers as per National Institute of Open Schooling (NIOS) Book guidelines. These solutions are part of NIOS All Subject Solutions. Here we have given NIOS Class 12 Accountancy Solutions English Medium, NIOS Senior Secondary Course Accountancy Notes in English Medium for All Chapter, You can practice these here.
Accounting Ratios – II
Chapter: 33
| Module – 6: Analysis of Financial Statements |
INTEXT QUESTIONS 33.1
Fill in the blanks with suitable word/words/figures :
(i) Debt equity ratio = ________.
Ans: Debt / Equity.
(i) _________ ratio measures the long term obligation of a firm.
Ans: Solvency.
(iii) ________ = Shareholders’s fund/ Total Assets.
Ans: Proprietary ratio.
(iv) Debt equity ratio = 20000/300000 = ________.
Ans: 0.67.
INTEXT QUESTIONS 33.2
Fill in the blanks with suitable word/words :
(i) Gross profit ratio = _______ x 100.
Ans: Gross profit / Net sales.
(ii) _______ = opening profit / net sales x 100.
Ans: Operating profit ratio.
(iii) Name the ratios that relate to the profitability of a business concern _________.
Ans: Profitability ratios.
| TERMINAL EXERCISE |
1. Explain solvency ratios in brief.
Ans: The term solvency refers to the ability of a business concern to meet its long-term obligations. These obligations include debentures, long-term loans from financial institutions and other long-term liabilities. Solvency ratios indicate the firm’s ability to meet its fixed interest charges and repayment schedules associated with long-term borrowings.
The important solvency ratios are:
(i) Debt-Equity Ratio: This ratio establishes the relationship between outsiders’ funds and shareholders’ funds. It indicates the proportion of debt and equity used in financing the business. It helps in assessing the long-term financial soundness of the firm.
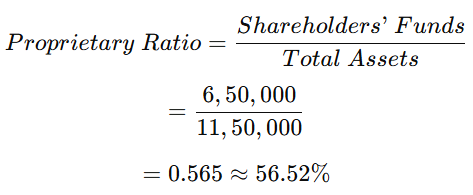
(ii) Proprietary Ratio: This ratio shows the relationship between shareholders’ funds and total assets of the firm. It indicates the extent to which the assets of the business are financed by owners’ funds and provides a measure of financial stability.
Thus, solvency ratios are useful in determining the long-term financial position and stability of a business enterprise.
2. What are profitability ratios? Explain the ratios in brief.
Ans: Profitability ratios are the ratios which measure the earning capacity and overall performance of a business enterprise. The main objective of every business is to earn profit, and these ratios help in analysing how efficiently the business is generating profit with the available resources.
The important profitability ratios are:
(i) Gross Profit Ratio: It expresses the relationship between gross profit and revenue from operations (net sales). It indicates the margin of profit and efficiency of production or trading activities. A higher ratio indicates lower cost of goods sold and better performance.
(ii) Net Profit Ratio: It shows the relationship between net profit and revenue from operations. It indicates overall profitability of the business after considering all expenses. A higher ratio shows better efficiency of management.
(iii) Operating Profit Ratio: It establishes the relationship between operating profit and net sales. It indicates the operational efficiency of the business by showing how well the business is managing its operating activities.
Thus, profitability ratios help in measuring efficiency, performance and earning capacity of the business.
3. What are the limitations of ratio analysis?
Ans: The main limitations of ratio analysis are as follows:
(i) Ignorance of Qualitative Aspect: Ratio analysis is based only on quantitative data and ignores qualitative factors such as management efficiency and goodwill.
(ii) Ignorance of Price Level Changes: Changes in price level affect the comparison of financial data over different periods and may lead to misleading conclusions.
(iii) No Single Concept: Different firms may use different accounting concepts and methods, which makes comparison difficult.
(iv) Misleading Results if based on Incorrect Data: Ratios are based on accounting data, and if the data is inaccurate or manipulated, the results will also be misleading.
(v) No Standard Ratio for Comparison: There is no universally accepted standard ratio, and standards differ from industry to industry.
(vi) Difficulties in Forecasting: Ratios are based on past data and may not reflect present or future conditions accurately.
4. What is meant by gross profit and net profit ratio?
Ans: Gross Profit Ratio: Gross profit ratio expresses the relationship between gross profit and revenue from operations (net sales).
It is calculated as:
Gross Profit Ratio = (Gross Profit / Net Sales) × 100.
It shows the margin of profit and efficiency of production or trading activities. A higher ratio indicates better performance and lower cost of goods sold.
Net Profit Ratio: Net profit ratio expresses the relationship between net profit and revenue from operations (net sales).
It is calculated as:
Net Profit Ratio = (Net Profit / Net Sales) × 100.
It indicates the overall profitability and efficiency of the business after considering all expenses. A higher ratio shows better management efficiency and profitability.
5. From the following data, calculate (a) Gross profit ratio (b) Net profit ratio.
Revenue from operations (Sales) 25,20,000
Cost of revenue from operations 19,20,000
Net profit 3,60,000
Ans: Given:
Revenue from Operations (Sales) = ₹ 25,20,000
Cost of Revenue from Operations = ₹ 19,20,000
Net Profit = ₹ 3,60,000
(a) Gross Profit Ratio
Formula:
Gross Profit Ratio = (Gross Profit / Revenue from Operations) × 100
Gross Profit = Sales – Cost of Revenue from Operations
= 25,20,000 – 19,20,000
= ₹ 6,00,000
Gross Profit Ratio = (6,00,000 / 25,20,000) × 100
= 23.81% (approx.)
(b) Net Profit Ratio
Formula:
Net Profit Ratio = (Net Profit / Revenue from Operations) × 100
= (3,60,000 / 25,20,000) × 100
= 14.29% (approx.)
6. Total assets Rs. 12,50,000, Total debt Rs. 10,00,000 current liabilities Rs. 500,000. Calculate debt-equity ratio.
Ans: Given:
Total Assets = ₹ 12,50,000
Total Debt = ₹ 10,00,000
Current Liabilities = ₹ 5,00,000
Calculate Long-term Debt
Long-term Debt = Total Debt – Current Liabilities
= 10,00,000 – 5,00,000
= ₹ 5,00,000
Calculate Shareholders’ Funds (Equity)
Equity = Total Assets – Total Debt
= 12,50,000 – 10,00,000
= ₹ 2,50,000
Debt-Equity Ratio
Formula:
Debt-Equity Ratio = Debt / Equity
= 5,00,000 / 2,50,000
= 2 : 1
7. Following figures have been obtained from the statement of Profit and Loss of M/s Bunu Ltd. for the year 31st December, 2013.
| Particulars | ₹ | Particulars | ₹ |
| Opening Inventory | 100000 | Revenue from operations | 560000 |
| Purchases | 350000 | Closing Inventory | 100000 |
| Wages | 9000 | Administrative expenses | 20000 |
| Salary and administrative expense | 89000 | Interest on investment | 10000 |
| Non-operating expenses | 30000 | Profit on sale of investment | 8000 |
You are required to calculate (a) Gross profit ratio (b) Net profit ratio (c) Operating profit ratio.
Ans: Working Notes:
Sales = ₹5,60,000
(1) Cost of Goods Sold (COGS)
Opening Stock = 1,00,000
Purchases = 3,50,000
Wages = 9,000
Less Closing Stock = 1,00,000
COGS = 3,59,000
(2) Gross Profit (GP)
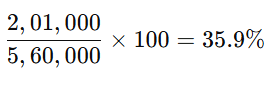
GP = 5,60,000 − 3,59,000 = 2,01,000
(a) Gross Profit Ratio
Operating Profit
Operating Expenses = 20,000 + 89,000 = 1,09,000
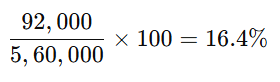
Operating Profit = 2,01,000 − 1,09,000 = 92,000
(B) Operating Profit Ratio
Net Profit
Non-operating Income = 18,000
Non-operating Expense = 30,000
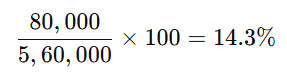
Net Profit = 92,000 + 18,000 − 30,000 = 80,000
(C) Net Profit Ratio
8. Following particulars pertaining to assets and liabilities of XYZ Ltd. are given:
| Liabilities | Amount (₹) | Assets | Amount (₹) |
| Equity share capital | 250000 | Land and Building | 450000 |
| Preference share capital | 200000 | Plant | 400000 |
| Reserves | 200000 | Inventory | 150000 |
| Debentures | 300000 | Sundry debtors | 100000 |
| Current liabilities | 200000 | Cash | 45000 |
| Prepaid expenses | 5000 |
Calculate (a) debt equity ratio (b) proprietary ratio.
Ans: Given Data
Shareholders’ Funds:
- Equity Share Capital = 2,50,000
- Preference Share Capital = 2,00,000
- Reserves = 2,00,000
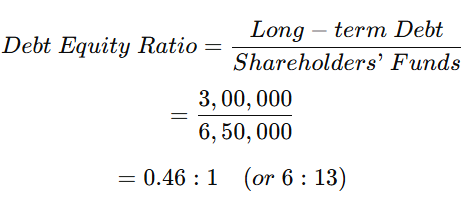
Shareholders’ Funds=2,50,000+2,00,000+2,00,000=6,50,000
Long-term Debt:
- Debentures = 3,00,000
Total Assets:
Land & Building = 4,50,000
Plant = 4,00,000
Inventory = 1,50,000
Sundry Debtors = 1,00,000
Cash = 45,000
Prepaid Expenses = 5,000
Total Assets=11,50,000
(a) Debt-Equity Ratio
(b) Proprietary Ratio


 Buy Now