
NCERT Class 9 Maths Chapter 7 The Mathematics of Maybe: Introduction to Probability Solutions English Medium As Per New Syllabus. NCERT Class 9 Maths Chapter 7 The Mathematics of Maybe: Introduction to Probability Notes to each chapter is provided in the list so that you can easily browse throughout different chapter NCERT Class 9 Maths Chapter 7 The Mathematics of Maybe: Introduction to Probability Question Answer Download PDF and select needs one.
NCERT Class 9 Maths Chapter 7 The Mathematics of Maybe: Introduction to Probability
Also, you can read the CBSE book online in these sections Solutions by Expert Teachers as per (CBSE) Book guidelines. NCERT Class 9 Mathematics Textual Solutions. These solutions are part of NCERT All Subject Solutions. Here we have given NCERT Class 9 Maths Chapter 7 The Mathematics of Maybe: Introduction to Probability in English Medium Solutions for All Subject, You can practice these here.
The Mathematics of Maybe: Introduction to Probability
Chapter – 7
| Exercise Set 7.1 |
1. Rank the following events on a scale from 0 (Impossible) to 1 (Certain). Label each event: Impossible, less likely, equally likely (even chance), more likely, certain. Give reasons why you gave each event its ranking.
(i) The next Monday will come after Sunday.
(ii) It will snow in Mumbai in July.
(iii) An elephant will walk through your classroom today.
(iv) You will greet at least one friend at school tomorrow.
Ans: (i) The next Monday will come after Sunday.
Rank: 1
Label: Certain
Reason: The text defines a probability of 1 as “certain to happen.” Since the sequence of days in a week is a fixed, repeating pattern where Monday always follows Sunday, this event is guaranteed.
(ii) It will snow in Mumbai in July.
Rank: 0
Label: Impossible
Reason: The text uses 0 to represent impossible events. Given Mumbai’s geographical location and tropical climate, it does not reach the freezing temperatures required for snow, especially during the monsoon month of July. This is similar to the book’s example of “getting a number greater than 6 on a die.”
(iii) An elephant will walk through your classroom today.
Rank: 0
Label: Impossible
Reason: Classrooms are structured, urban environments where large wild animals do not have access.
Unless your school is specifically located inside a wildlife sanctuary or circus grounds, the probability of this occurring during a normal school day is zero.
(iv) You will greet at least one friend at school tomorrow.
Rank: Close to 1 (e.g., 0.8 or 0.9)
Label: More likely
Reason: The text explains that “more likely” applies to events that have a high chance of occurring but are not 100% guaranteed.
Since school is a social setting where you consistently interact with peers, the likelihood is very high.
| Exercise Set 7.2 |
1. A teacher mixes a large bag of sweets of different colours and randomly selects a sample of 30 sweets. She counts the number of sweets of each colour:
10 red sweets | 8 green sweets | 7 yellow sweets | 5 blue sweets
(i) Calculate the probability that a randomly picked sweet from the sample is green.
(ii) If there are 600 sweets in total in the large bag, estimate how many are likely to be yellow, based on the sample results.
Ans: Given sample (total = 30 sweets):
Red = 10
Green = 8
Yellow = 7
Blue = 5
(i) Probability of picking a green sweet
P(green) = Number of green sweets/Total sweets = 8/30
P(green) = 4/15
(ii) Estimate number of yellow sweets in 600 sweets
From the sample: P(yellow) = 7/30
Now estimate in 600 sweets:
Estimated yellow sweets = 7/30 × 600
= 7 × 20 = 140
2. A survey is conducted at a school where a random sample of 40 students is asked about their favourite club. The responses are:
14 students: Science Club | 11 students: Arts Club | 9 students: Sports Club | 6 students: Debate Club
Assume there are 800 students in the whole school.
(i) What is the probability that a randomly chosen student from the sample prefers the Arts Club?
(ii) Using the sample results, estimate how many students in the whole school are likely to prefer the Sports Club.
Ans: Number of all possible outcomes in sample = 14 + 11 + 9 + 6 = 40
(i) Number of favourable outcomes = 11 (students preferring the Arts club)
P(A student prefers Arts Club) = 11/40 = 0.275 or 27.5%
(ii) Number of favourable outcomes = 9 (students preferring the Sports Club)
P(A student prefers Sports Club) = 9/40
Estimate for 800 students = 9/40 × 800 = 180 students likely to prefer sports club.
3. Toss a coin 20 times and record the result each time (heads or tails).
(i) How many times did you get heads?
(ii) How many times did you get tails?
(iii) Calculate the experimental probability of getting heads.
(iv) If you toss the coin once more, what is the probability of getting tails?
Ans: Since I am an AI, I simulated twenty tosses resulting in 11 heads and 9 tails to answer your specific experiment. In this case, I got 11 heads and 9 tails, which directly answers the first two points of your question. The experimental probability of getting heads is calculated as eleven divided by twenty, which equals exactly 0.55 or 55%. For the final point, the probability of getting tails on the next toss is 0.5 because past results do not affect future independent trials. This exercise highlights the difference between actual observed data and the ideal 50% theoretical expectation for a fair coin.
1. Heads: 11
2. Tails: 9
3. Experimental Probability (Heads): 11/20 = 0.55
4. Probability of Tails next: 0.5 (or 1/2)
4. Toss a paper cup into the air 100 times. After each toss, record whether the cup lands on its bottom, upside down on its top or on its side (See Fig. 7.5). Assign probabilities to the outcomes by using experimental probability.
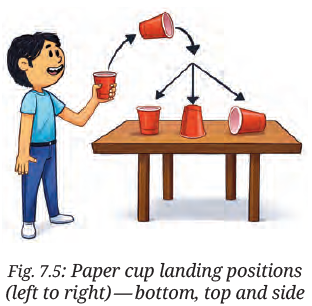
Ans: To solve this experiment, we simulate one hundred tosses and record the frequency of each landing position shown in your image. Suppose the cup lands on its side seventy times, on its bottom twenty times, and upside down on its top ten times. The experimental probability is then calculated by dividing these frequencies by the total trials, resulting in 0.7,0.2, and 0.1 respectively. These values represent the objective likelihood of each outcome based specifically on the data collected during this particular set of observations. Unlike a fair coin, a paper cup is biased due to its shape, so experimental data is essential for accurate measurement.
Side: 70/100 = 0.7
Bottom: 20/100 = 0.2
Top: 10/100 = 0.1
5. What is the probability of getting an even number when rolling a fair 6-sided die?
Ans: Number of all possible outcomes = 6 (numbers 1, 2, 3, 4, 5, 6)
Number of favourable outcomes = 3 (even numbers 2, 4, 6)
P(getting an even number) = Number of favourable outcomes/Number of all possible outcomes
= 36
= 0.5 or 50%
6. Suppose you roll a 6-sided die 12 times and get a ‘3’ three times.
(i) What is the experimental probability of rolling a ‘3’?
(ii) What is the theoretical probability of rolling a ‘3’?
(iii) Why might these probabilities be different? What would you expect to happen if you rolled the die 60, 600, or 6000 times?
Ans: (i) The experimental probability of rolling a three is 0.25, which we find by dividing the three times the number appeared by the twelve total rolls.
(ii) The theoretical probability for rolling a three is one divided by six, which equals approximately 0.167, as each of the six faces is equally likely.
(iii) These probabilities are different because a small sample of twelve rolls allows for random chance to skew the data away from the expected average. As you increase the number of trials to sixty, six hundred, or six thousand, you would expect the experimental results to get closer to the theoretical value. This phenomenon is known as the law of large numbers, where a larger amount of data provides a more accurate reflection of true probability.
| Exercise Set – 7.3 |
1. When a single 6-sided die is rolled, what is the total number of possible outcomes in the sample space?
Ans: Sample Space (S): {1, 2, 3, 4, 5, 6}
Number of all possible outcomes: 6
Description: Since each face of the die represents a unique result, there are six distinct possibilities.
2. For the following experiments, write down the sample space S.
(i) Rolling a die and tossing a coin together.
(ii) Choosing a random integer between -5 and +5.
(iii) A box containing 5 green and 7 red balls. One ball is drawn at random.
Ans: (i) When rolling a die and tossing a coin together, every number from one to six can pair with either heads or tails. This results in a sample space of twelve distinct outcomes: S = {1H, 1T, 2H, 2T, 3H, 3T, 4H, 4T, 5H, 5T, 6H, 6T}.
(ii) Choosing a random integer strictly between -5 and +5 means we list all whole numbers that fall within that specific range. The resulting sample space contains nine elements: S = {-4, -3, -2, -1, 0, 1, 2, 3, 4}.
(iii) For a box with five green and seven red balls, the sample space represents the possible colors you can draw. Since there are only two types of colors available, the sample space is simply S = {Green, Red}, though the total number of physical balls is twelve.
S = {1H, 1T, 2H, 2T, 3H, 3T, 4H, 4T, 5H, 5T, 6H, 6T}
S = {-4, -3, -2, -1, 0, 1, 2, 3, 4}
S = {Green, Red}
3. In a village fair, there are 3 popular snacks available: Samosa, Pakora, and Bhaji. For drinks, villagers can choose either Chai or Lassi.
(i) List the sample space of all possible snack and drink combinations a person could choose at the fair.
(ii) List the event ‘Selecting Samosa as a snack.’
Ans: (i) To find the sample space, we pair each snack with every possible drink.
There are 3 snacks (Samosa, Pakora, Bhaji) and 2 drinks (Chai, Lassi).
Sample Space (S): {(Samosa, Chai), (Samosa, Lassi), (Pakora, Chai), (Pakora, Lassi), (Bhaji, Chai), (Bhaji, Lassi)}
Each outcome represents one complete meal choice.
Number of all possible outcomes: 6
(ii) An event is a specific subset of the sample space that satisfies a given condition.
In this case, we only look for pairs where the snack is a Samosa.
Event (E): Selecting Samosa as a snack = {(Samosa, Chai), (Samosa, Lassi)}
Number of favourable outcomes: 2
| Exercise Set – 7.4 |
1. There are two fruit baskets, A and B. Basket A has one apple and two oranges. Basket B has one banana and one mango. You randomly pick one fruit from each basket.
(i) Draw a tree diagram showing all possible pairs of fruits.
(ii) List the sample space.
(iii) What is the probability of picking one apple and one banana?
Ans: (i) The experiment involves picking one fruit from Basket A, followed by picking one fruit from Basket B. The tree diagram starts with three branches for the possible choices from Basket A: one branch for the apple (A) and two branches for the two separate oranges (O1, O2). Since picking a fruit from Basket A is a single event and we are treating the oranges separately to maintain equally likely outcomes, the probability for each branch from the starting point is 1/3. From each of these three branches, we draw two new branches to represent the choices from Basket B, which has one banana (B) and one mango (M). Since there are two outcomes, the probability for each of these branches is 1/2. A complete outcome is a path from the start of the tree to one of the final leaves. There are six final leaves on the tree, which correspond to the six possible pairs of fruits. For example, following the path “Apple” then “Banana” gives the outcome (A,B).
Here is the tree diagram visualizing all possible outcomes and their probabilities:
(ii) The sample space S is the list of all final pairs of fruits seen at the ends of the branches. Since we have one apple (A), two distinct oranges (O1, O2), one banana (B), and one mango (M), the sample space is:
S = {(A,B), (A,M), (O1, B), (O1, M), (O2, B), (O2, M)}.
The size of the sample space is n(S) = 6.
(iii) To find the probability of picking one apple and one banana, we look at our sample space. There is only one outcome that matches this condition: (A,B). This is our single favorable outcome. The total number of equally likely outcomes is six. Therefore, the probability is calculated by dividing the number of favorable outcomes (1) by the total number of outcomes (6). This results in a probability of 1/6, which is approximately 0.167 or 16.7%.
(See the generated tree diagram image for the visualization)
Sample Space (S): {(A, B),(A, M),(O1, B),(O1, M), (O2, B),(O2, M}q
Probability of (Apple, Banana): 1/6 ≈ 0.167 (or 16.7%)
2. Let us say that you have a box containing 3 red pens, 4 black pens, and 2 green pens. You pick a pen (without looking) from the box and put it back. Then your friend does the same.
(i) What are the possible outcomes of the pen colours? Can you draw a tree diagram representing the possible outcomes?
(ii) Can you use the tree diagram to guess the probability that both you and your friend pick pens of the same colour?
Ans: (i) Since you put the pen back, the second person has the same choices as the first.
The possible colours are Red (R), Black (B), and Green (G).
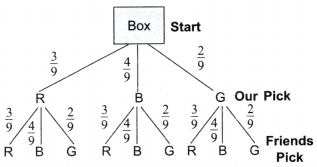
The possible outcome pairs are: (R, R), (R, B), (R, G), (B, R), (B, B), (B, G), (G, R), (G, B), (G, G)
Since the pen is replaced after the first pick, the number of outcomes remains the same for both selections.
Sample Space (S) = {(R, R), (R, B), (R, G), (B, R), (B, B), (B, G), (G, R), (G, B), (G, G)}
Number of all possible outcomes = 9
P(Red) = 3/9
P(Black) = 4/9
P(Green) = 2/9
(ii) Yes, to find the probability that both of us pick the same colour, we look at the three paths where the colours match: (R, R), (B, B), and (G, G).
We multiply the probabilities along those specific branches and then add them together.
Both Red: Your 3 choices × Friend’s 3 choices = 9 ways
P(R, R) = 3/9 × 3/9 = 9/81
P(B, B) = 4/9 × 4/9 = 16/81
P(G, G) = 2/9 × 2/9 = 4/81
Total probability = 9/81 + 16/81 + 4/81 = 29/81
P(Same colour) = 29/81 = 0.358 or 35.8%
The tree diagram helps you see that while there are only 3 “matching colour” scenarios, the likelihood of each scenario depends on how many pens of that colour were in the box to begin with.
| END-OF-CHAPTER EXERCISES |
1. Fill in the blanks.
(i) The probability of an impossible event is _____________.
Ans: The probability of an impossible event is 0.
(ii) The set of all possible outcomes of a random experiment is called the _____________.
Ans: The set of all possible outcomes of a random experiment is called the sample space.
(iii) The probability of an event that is certain to happen is _____________.
Ans: The probability of an event that is certain to happen is 1.
(iv) Tossing a fair coin has a probability of _____________ for getting heads.
Ans: Tossing a fair coin has a probability of 12 (or 0.5) for getting heads.
2. In a survey of 50 students, 15 students said they liked football. The number of students who like football is 15, and the _____________ (frequency/relative frequency) is _____________ (fill in the fraction or decimal).
Ans: The number of students who like football is 15, and the relative frequency is 15/50 = 3/10 (or 0.3).
3. Which of the following experiments has equally likely outcomes? Explain.
(i) A driver attempts to start a car. The car starts or does not start.
Ans: Describes an experiment influenced by external factors rather than pure randomness. A car starting depends on mechanical conditions like a functional battery or fuel levels. Because the probability of starting is usually much higher than not starting, these outcomes are not equally likely.
(ii) Tossing a fair coin once.
Ans: Involves a fair coin, which is physically symmetrical and balanced. This balance ensures that heads and tails each have exactly a 50% chance of occurring. Since every outcome in the sample space has the same probability, they are considered equally likely.
(iii) Rolling a fair 6-sided die.
Ans: Uses a fair six-sided die where each face is manufactured to be identical in size and weight. Each number from one to six has a 1/6 chance of appearing. This uniform distribution makes all six outcomes equally likely.
(iv) Choosing a marble randomly from a bag that contains 3 red marbles and 7 blue marbles.
Ans: Features a bag with an unequal distribution of marbles. With seven blue and only three red, you are more likely to pull a blue marble. Because 0.7 is not equal to 0.3, these results are not equally likely.
(v) A baby is born. It is a boy or a girl.
Ans: Refers to the birth of a baby, which in probability theory is modeled as a 50-50 chance. While minor biological variations exist, for most calculations, the outcomes of boy or girl are treated as equally likely.
4. Write the sample space and calculate the probability based on the given information.
(i) Two coins are tossed at the same time. What is the probability of getting at least one head?
(ii) Ten identical cards numbered 1 to 10 are placed in a box. One card is drawn at random. What is the probability of drawing a card with an even number?
(iii) A die is rolled once. What is the probability of getting a number greater than 4?
(iv) A bag contains 3 red balls, 2 blue balls, and 1 green ball. One ball is picked at random. What is the probability that it is not red?
(v) Three coins are tossed simultaneously. What is the probability of getting exactly two heads?
Ans: (i) Two coins are tossed at the same time.
Sample Space (S): {HH, HT, TH, TT}
Number of all possible outcomes = 4
Event (At least one head): {HH, HT, TH}
Number of favourable outcomes = 3
P(At least one head) = Number of favourable outcomes/Number of all possible outcomes
= 3/4
= 0.75 or 75%
(ii) Ten cards numbered 1 to 10.
Sample Space (S): {1, 2, 3, 4, 5, 6, 7, 8, 9, 10}
Number of all possible outcomes = 10
Event (Even number): {2, 4, 6, 8, 10}
Number of favourable outcomes = 5
P(Even number) = Number of favourable outcomes/Number of all possible outcomes
= 5/10
= 1/2
= 0.5 or 50%
(iii) A die is rolled once.
Sample Space (S): {1, 2, 3, 4, 5, 6}
Number of all possible outcomes = 6
Event (Number > 4): {5, 6}
Number of favourable outcomes = 2
P(Number > 4) = Number of favourable outcomes/Number of all possible outcomes
= 2/6
= 1/3
= 0.333 or 33.3%
(iv) A bag contains 3 red, 2 blue, and 1 green ball.
Number of all possible outcomes = 6 (Total: 3 + 2 + 1)
Event (Not red): {Blue, Blue, Green}
Number of favourable outcomes = 3
P(Not red) = Number of favourable outcomes/Number of all possible outcomes
= 3/6
= 1/2
= 0.5 or 50%
(v) Three coins are tossed simultaneously.
Using a tree diagram
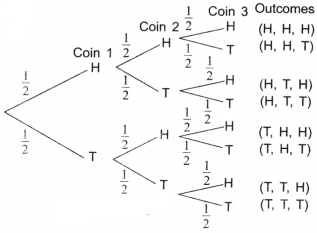
Sample Space (S): {HHH, HHT, HTH, THH, HTT, THT, TTH, TTT}
Number of all possible outcomes = 8
Event (Exactly two heads): {HHT, HTH, THH}
Number of favourable outcomes = 3
P(Exactly two heads) = Number of favourable outcomes/Number of all possible outcomes
= 3/8
= 0.375 or 37.5%
5. A bag has 3 candies: strawberry, lemon, and mint. One is picked at random. What is the probability of picking a strawberry candy?
Ans: The sample space S contains three equally likely outcomes: strawberry, lemon, and mint. Since there is only one strawberry candy, the probability is 1/3 or 33.3%.
6. A child has 2 shirts (one red and one blue) and 3 types of pants (jeans, khakis, and shorts). List all the possible combinations of outfits consisting of one shirt and one pair of pants. Display your answer in a table format.
Ans: A child has 2 choices for shirts and 3 choices for pants.
To find all possible combinations, we pair each shirt with every type of pants.
| Shirts | Pants | All Possible Outcomes |
| Red | Jeans | Red, Jeans |
| Khakis | Red, Khakis | |
| Shorts | Red, Shorts | |
| Blue | Jeans | Blue, Jeans |
| Khakis | Blue, Khakis | |
| Shorts | Blue, Shorts |
Number of all possible outcomes = Number of choices for shirts × number of choices for pants
= 2 × 3
= 6 outfits
7. A tyre company records distances before replacement in 1000 cases.
| Distance (km) | Less than 4000 | 4001 to 9000 | 9001 to 14000 | More than 14000 |
| Number of cases | 20 | 210 | 325 | 445 |
Find the probability that a randomly chosen tyre lasts:
(i) Less than 4000 km.
(ii) Between 4000 and 14000 km.
(iii) More than 14000 km.
Ans: (i) There are 20 cases under 4000 km out of 1000 total, making the probability 20/1000 or 0.02.
(ii) Sum cases for 4001-9000 km and 9001-14000 km (210 + 325 = 535), giving 535/1000 or 0.535.
(iii) The table shows 445 cases lasting more than 14000 km, resulting in a probability of 445/1000
or 0.445.
8. The letters of the word ‘PEACE’ are placed on cards. Leela draws a card without looking.
| P | E | A | C | E |
(i) What is the probability that it is a P, E, or C?
(ii) What is the probability that it is not an E?
Ans: The letters are P, E, A, C, E.
Sample Space (S): {P, E, A, C, E}
Number of all possible outcomes = 5
(i) Event: The card drawn is a P, E, or C
Favourable outcomes: {P, E, C, E} (E is counted twice)
Number of favourable outcomes = 4
P(P, E, or C) = Number of favourable outcomes/Number of all possible outcomes
= 4/5
= 0.8 or 80%
(ii) Event: The card drawn does not have an E.
Favourable outcomes: {P, A, C}
Number of favourable outcomes = 3
P(not E) = = Number of favourable outcomes/Number of all possible outcomes
= 3/5
= 0.6 or 60%
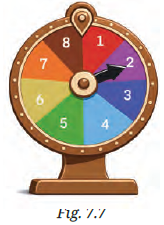
9. A game of chance consists of spinning an arrow (see Fig. 7.7), which comes to rest pointing at one of the numbers 1, 2, 3, 4, 5, 6, 7, 8, and these are equally likely outcomes. What is the probability that it will point at
(i) 8?
(ii) An odd number?
(iii) A number greater than 2?
(iv) A number less than 9?
(v) A multiple of 3?
Ans: The sample space contains 8 equally likely outcomes.
(i) There is only one 8, so the probability is 1/8 or 0.125.
(ii) Odd numbers are 1, 3, 5, 7. This gives 4 outcomes, making the probability 4/8 or 0.5.
(iii) Numbers greater than 2 are 3, 4, 5, 6, 7, 8. These 6 outcomes result in 6/8 or 0.75.
(iv) All numbers are less than 9, so this certain event has a probability of 8/8 or 1.
(v) Multiples of 3 are 3 and 6. These 2 outcomes give a probability of 2/8 or 0.25.
10. A basket contains 4 red balls and 5 blue balls. One ball is drawn and laid aside, and a second ball is drawn. Draw a tree diagram to represent the possible outcomes and probabilities. Use the tree diagram to answer the following questions.
(i) What is the probability of drawing a red ball and then a blue ball?
(ii) What is the probability of drawing 2 blue balls?
Ans: There are 4 Red (R) and 5 Blue (B) balls.
Total = 9.
Because the first ball is laid aside, the total becomes 8 for the second draw.
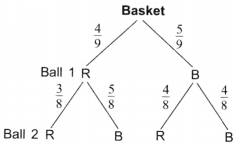
First draw: P(R) = 4/9, P(B) = 5/9
Second draw if first is Red: remaining 3
Red and 5 Blue, so P(R) = 3/8, P(B) = 5/8
Second draw if first is Blue: remaining 4 Red and 4 Blue,
so P(R) = 4/8, P(B) = 4/8
(i) Probability of Red then Blue (RB) = 4/9 × 5/8 = 20/72
= 5/18
= 0.278
(ii) Probability of two Blue balls (BB) = 5/9 × 4/8 = 20/72
= 5/18
= 0.278
11. I throw a pair of 6-sided dice. Write down an event that has a probability of 0 and an outcome that has a probability of 1.
Ans: An event with a probability of 0 is rolling a total sum of 13. An outcome with a probability of 1 is rolling a sum between 2 and 12.
12. Write the sample space and calculate the probability based on the given information.
(i) Two dice are rolled. What is the probability that the sum is a prime number greater than 5?
Ans: Two dice are rolled
Sample space (S): {(1, 1), (1,2), (1,3), (1,4), (1, 5), (1,6), (2, 1), (2, 2), (2, 3), (2, 4), (2, 5), (2, 6), (3, 1), (3, 2), (3, 3), (3,4), (3, 5), (3, 6), (4, 1), (4, 2), (4, 3), (4, 4), (4, 5), (4, 6), (5, 1), (5, 2), (5, 3), (5, 4), (5, 5), (5, 6), (6, 1), (6, 2), (6, 3), (6, 4), (6, 5), (6, 6)}
Sum is a prime number greater than 5.
Possible sums: 7 and 11
Favourable outcomes = {(2, 5), (1, 6), (3, 4), (4, 3), (6, 1), (5, 2), (5, 6), (6, 5)}
Number of favourable outcomes = 8
Total number of outcomes = 36
Probability = Number of favourable outcomes/Number of all possible outcomes
= 8/36
= 2/9
= 0.222
(ii) A bag contains 4 red, 3 green, and 2 blue balls. Two balls are drawn without replacement. What is the probability that both are of different colours?
Ans: 4 Red, 3 Green, 2 Blue (without replacement): different colours
Since balls are distinct, we label them R1, R2, R3, R4, G1, G2, G3, B1, B2
Sample space (S): Set of all combination of 2 balls from the 9 available {(R1, R2), (R1, R3), (R1, R4), (R1, G1, (R1, G2), (R1, G3), (R1, B1), (R1, B2), (R2, R3), (R2, R4), (R2, G1),….(G2, G3), (G2, B1), (G2, B2), (G3, B1), (G3, B2), (B1, B2)
Total outcomes = 8 + 7 + 6 + 5+ 4 + 3 + 2 + 1 = 36
P(same colour) = P(R, R) + P(G, G) + P(B, B)
= (4/9 × 3/8) + (3/9 × 2/8) + (2/9 × 1/8)
= 12 + 6 + 2/72
= 20/72
= 5/18
P(different colours) = 1 – P(same colour)
= 5/18
= 13/18
= 0.722
(iii) Three coins are tossed. What is the probability that the first coin shows heads and exactly two heads occur in total?
Ans: Three coins are tossed.
Sample space (S) = {HHH, HHT, HTH, THH, HTT, THT, TTH, TTT}
Event: First is Heads and exactly two heads
Favourable outcomes = {HHT, HTH}
No. of Favourable outcome = 2
Total no outcomes = 8
Probability = Number of favourable outcomes/Number of possible outcomes
= 2/8
= 1/4
= 0.25
(iv) A four-digit number is formed using the digits 1, 2, 3, and 4 with no repetition. What is the probability that the number is even?
Ans: Four-digit numbers formed using 1, 2, 3, 4 without repetition.
Event: Number is even
Sample space (S) = {1234, 1243, 1324, 1342, 1423, 1432, 2134, 2143, 2314, 2341, 2413, 2431, 3124, 3142, 3214, 3241, 3412, 3421, 4123, 4123, 4213, 4231, 4312, 4321}
Total number outcomes = 24
An even number must end in 2 or 4.
Favourable outcomes = 12
Probability = Number of favourable outcomes/Number of possible outcomes
= 12/24
= 1/2
= 0.5
(v) A student takes a multiple-choice test with 3 questions, each having 4 options (A, B, C, D), with only one correct answer. What is the probability that the student guesses and gets exactly 2 answers correct?
Ans: Data: 3 questions, 4 options (1 correct (C), 3 wrong (W))
For 3 questions, Sample space (S) = {CCC, CCW, CWC, WCC, CWW, WCW, WWC, WWW}
For each question, P(C) = 1/4, P(W) = 3/4
Favourable (outcomes) for exactly 2 correct answers = {CCW, CWC, WCC}
Calculation for one path (for example, CCW):
1/4 × 1/4 × 3/4 = 3/64
Total probability (sum of all 3 paths):
P(E) = 3 × 3/64
= 9/64
= 0.141 or 14.1%
13. A box contains 4 balls numbered 1 to 4. Record a sample space using a tree diagram for the following experiments:
(i) A ball is drawn, and the number is recorded. Then the ball is returned, and a second ball is drawn and recorded.
(ii) A ball is drawn and recorded. Without replacing the first ball, the experimenter draws and records a second ball.
(iii) What are the sizes of these two sample spaces?
Ans: In (i), each of the four initial branches (1, 2, 3, 4) splits into four identical branches because the first ball is replaced.
In (ii), each initial branch splits into only three branches because the ball already drawn cannot be selected a second time.
In (iii), the first sample space contains 4 × 4 = 16 outcomes, while the second contains 4 × 3 = 12
distinct outcomes.
14. List the elements of a sample space for the simultaneous tossing of a coin and drawing of a card from a set of 6 cards numbered 1 through 6.
Ans: For this experiment, we are combining two independent actions: tossing a coin and drawing a numbered card.
To list the sample space systematically, we pair each possible result of the coin with each possible result of the card.
1. Identity Individual Outcomes
Coin: {Heads (H), Tails (T)} → 2 outcomes
Cards: {1, 2, 3, 4, 5, 6} → 6 outcomes
2. Form the Pairs (Sample Space S)
We list every combination, starting with Heads and then repeating the process for Tails.
S = {(H, 1), (H, 2), (H, 3), (H, 4), (H, 5), (H, 6), (T, 1), (T, 2), (T, 3), (T, 4), (T, 5), (T, 6)}
Number of elements n(S) = 2 × 6 = 12
15. Three coins are tossed, and the number of heads is recorded. Which of the following lists is a sample space for this experiment? Why do the other lists fail to qualify as a sample space?
(i) {1, 2, 3}
(ii) {0, 1, 2}
(iii) {0, 1, 2, 3, 4}
(iv) {0, 1, 2, 3}
Ans: (i) fails because it omits the possibility of zero heads, which occurs if all three coins show tails.
(ii) fails because it omits the possibility of three heads, which occurs if all coins show heads.
(iii) fails because it includes four heads, which is impossible since only three coins are tossed in total.
(iv) {0, 1, 2, 3} is the correct sample space because it lists all possible head counts from zero to three.
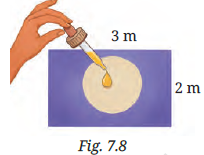
16. Suppose you drop a dye at random on the rectangular region shown in Fig. 7.8. What is the probability that it will land inside the circle with a diameter of 1 m?
Ans: This problem uses geometric probability, where probability is found using area instead of counting outcomes.
Step 1: Find the total area
The dye can land anywhere in the rectangle.
Length = 3 m, Breadth = 2 m
Area of rectangle = 3 × 2 = 6 m2
Step 2: Find the favourable area
The favourable region is the circle.
Diameter = 1 m, so radius = 0.5 m
Area of circle = π × (0.5)2 = 0.25π m2
Step 3: Calculate the probability
Probability = Number of favourable outcomes/Number of possible outcomes
= Area of circle/Area of rectangle
= 0.25π/6
∴ Probability of landing a dye inside the circle = π/24 = 0.13 or 13%.
If you find this NCERT Class 9 Maths Chapter 7 The Mathematics of Maybe: Introduction to Probability post helpful, please share it with your friends. If you find any mistake in the NCERT Class 9 Maths Chapter 7 The Mathematics of Maybe: Introduction to Probability Solutions, please let us know in the comment box. We will correct it as soon as possible. Your feedback is valuable to us.
Subject Ka Complete Video Solution Dekhein
Step-by-step easy concept explanation aur full questions Answer ke liye watch karein ya app download karein:

 Buy Now