
NIOS Class 12 Economics Chapter 9 Measures of Dispersion, Solutions to each chapter is provided in the list so that you can easily browse through different chapters NIOS Class 12 Economics Chapter 9 Measures of Dispersion and select need one. NIOS Class 12 Economics Chapter 9 Measures of Dispersion Question Answers Download PDF. NIOS Study Material of Class 12 Economics Notes Paper 318.
NIOS Class 12 Economics Chapter 9 Measures of Dispersion


Also, you can read the NIOS book online in these sections Solutions by Expert Teachers as per National Institute of Open Schooling (NIOS) Book guidelines. These solutions are part of NIOS All Subject Solutions. Here we have given NIOS Class 12 Economics Chapter 9 Measures of Dispersion, NIOS Senior Secondary Course Economics Solutions for All Chapters, You can practice these here.
Measures of Dispersion
Chapter: 9
Module – IV Statistical Tools
TEXT BOOK QUESTIONS WITH ANSWERS
INTEXT QUESTIONS 9.1.
Q.1. The difference between the largest and the smallest data values is the:
(a) Variance.
(b) Inter – quartile range.
(c) Range.
(d) Coefficient of variation.
Ans. (c) Range.
Q.2. A researcher has collected the following sample data. The mean of the sample is 5. 3, 5, 12, 3, 2. The range is:
(a) 1
(b) 2
(c) 10
(d) 12
Ans. (c) 10 Range = L-S = 12 – 2 = 10
INTEXT QUESTIONS 9.2.
Q.1. If the first quartile is 104 and Quartile deviation is 18. Find the third quartile.
Ans. Third quartile is 140.
INTEXT QUESTIONS 9.3.
Q.1. Which of the following is a measure of dispersion?
(a) Percentiles.
(b) Quartiles.
(c) Interquartile range.
(d) All of the above are measures of dispersion.
Ans. (c) Interquartile range.
Q.2. The interquartile range is:
(a) The 50th percentile.
(b) Another name for the standard deviation.
(c) The difference between the largest and smallest values.
(d) The difference between the third quartile and the first quartile.
Ans. (b) Another name for the standard deviation.
Q.3. Which of the following limitation of the range is overcome by the interquartile range?
(a) The sum of the range variances is zero.
(b) The range is difficult to compute.
(c) The range is influenced too much by extreme values.
(d) The range is negative.
Ans. (c) The range is influenced too much by extreme values.
Q.4. A researcher has collected the following sample data. The mean of the sample is 5.
3 5 12 3 2
The inter – quartile range is:
(a) 1
(b) 2
(c) 10
(d) 12
Ans. (d) 12.
INTEXT QUESTIONS 9.4.
Q.1. Calculated mean deviation and coefficient of mean deviation from median.
| No. of tomatoes per plant | 0 | 1 | 2 | 3 | 4 | 5 | 6 | 7 | 8 | 9 | 10 |
| No. of plants | 2 | 5 | 7 | 11 | 18 | 24 | 12 | 8 | 6 | 4 | 3 |
Ans.
| X | f | Cf | |D| | f|D| |
| 0 | 2 | 2 | 5 | 10 |
| 1 | 5 | 7 | 4 | 20 |
| 2 | 7 | 14 | 3 | 21 |
| 3 | 11 | 25 | 2 | 22 |
| 4 | 18 | 43 | 1 | 18 |
| 5 | 24 | 67 | 0 | 0 |
| 6 | 12 | 79 | 1 | 12 |
| 7 | 8 | 87 | 2 | 16 |
| 8 | 6 | 93 | 3 | 18 |
| 9 | 4 | 97 | 4 | 16 |
| 10 | 3 | 100 | 5 | 15 |
| 30 | 168 |
Median = Size of (N + 1/2)th items
= 100 + 1/2 = 101/2 = 55.5th items
M.D = Σf |D|/N = 168/100 = 1.68
Coefficient of M.D = MD/ Media = 1.68/5 = 0.336
Q.2. Calculate mean deviation from mean:
| Class | 3-4 | 4-5 | 5-6 | 6-7 | 7-8 | 8-9 | 9-10 |
| Frequency | 3 | 7 | 22 | 60 | 85 | 32 | 8 |
Ans.
| Class (X) | Frequency (f) | Mid point (M) | d’=M-6.5/31 | fd’ | |D|=M-7.5 | f|D| |
| 3-4 | 3 | 3.5 | 0.09 | 0.27 | 4 | 12 |
| 4-5 | 7 | 4.5 | 0.06 | 0.42 | 3 | 21 |
| 5-6 | 22 | 5.5 | 0.03 | 0.63 | 2 | 44 |
| 6-7 | 60 | 6.5 | 0 | 0 | 1 | 60 |
| 7-8 | 85 | 7.5 | 0.03 | 2.55 | 0 | 0 |
| 8-9 | 32 | 8.5 | 0.06 | 1.92 | 1 | 32 |
| 9-10 | 8 | 9.5 | 0.09 | 0.72 | 2 | 16 |
| 217 | 185 |
X̅ = ΣX/N = 217/7 = 31
A = 6.5
X̅ = A + Σfd’/Σf x C
= 6.5 + 6.96/217 x 31 = 6.5 + 215.75/217 = 6.5 + 0.99 = 7.49 ≈ 7.5
MD = Σf|D|/N = 185/217 = 0.85
INTEXT QUESTIONS 9.5.
Q.1. Sona, Karina, Omar, Mustafa and Anil obtained marks of 6, 7, 3, 7, 2 on a standardized test respectively. Find the standard deviation of their scores.
Ans.
| Students | Scores | X-X̅ | (X-X̅)² |
| 1 | 6 | 1 | 1 |
| 2 | 7 | 2 | 4 |
| 3 | 3 | -2 | 4 |
| 4 | 7 | 2 | 4 |
| 5 | 2 | -3 | 9 |
| 25 | 22 |
X̅ = 25/5 = 5
Standard deviation (S.D) =
INTEXT QUESTIONS 9.6.
Q.1. The hourly wages of a sample of 130 system analysts are given below:
mean = = 60
range = 20
mode = 73
variance = 324
median = 74
The coefficient of variation equals:
(a) 0.30%
(b) 30%
(c) 5.4%
(d) 54%
Ans. (b) 30%
Q.2. The measure of dispersion that is influenced most by extreme values is:
(a) The standard deviation.
(b) The range.
(c) The interquartile range.
Ans. (b) The range.
Q.3. The descriptive measure of dispersion that is based on the concept of a deviation about the mean is:
(a) The range.
(b) The interquartile range.
(c) The absolute value of the range.
(d) The standard deviation.
Ans. (d) The standard deviation.
Q.4. The numerical value of the standard deviation can never be:
(a) Zero.
(b) Negative.
(c) One.
Ans. (b) Negative.
Q.5. A researcher has collected the following sample data. The mean of the sample is 5.
3 5 12 3 2
The Standard deviation is:
(a) 8.944
(b) 4.062
(c) 13.2
(d) 16.5
Ans. (b) S.d is 4.062
Or
The coefficient of variation is:
(a) 72.66%
(c) 264%
(b) 81.24%
(d) 330%
Ans. (b) 81.24%
TERMINAL EXERCISE
RANGE
Q.1. The following are the prices of shares A, B Co. Ltd. from Monday to Saturday:
| Days | Mon. | Tues. | Wed. | Thur. | Fri. | Sat. |
| Prices (in ₹) | 200 | 210 | 208 | 160 | 220 | 250 |
Calculate the range and its coefficient.
Ans. Range = L – S
= 250 – 160 = 90
Coefficient of Range = L – S / L + S = 250 – 160/ 250 + 160 = 90/410 = 0.21
Q.2. Find the range of given data:
108, 107, 105, 106, 107, 104, 103, 101, 104.
Ans. Range = L – S
= 108 – 101 = 7
Q.3. Find the value of range of frequency distribution:
| Age (in yrs) | 14 | 15 | 16 | 17 | 18 | 19 | 20 |
| No. of students | 1 | 2 | 2 | 2 | 6 | 4 | 0 |
Ans. Range = L – S = 20 – 14 = 6
Hence, Range = 6
Q.4. Calculate the range for the distribution given below:
| Height (in cms) | 150 | 151 | 152 | 154 | 159 | 160 | 165 | 166 |
| No. of boys | 2 | 2 | 9 | 15 | 18 | 10 | 4 | 1 |
Ans. Range = L – S = 166 – 150 = 16
Q.5. Find the range of the following:
| Profit (in 1000 ₹) | 0-10 | 10-20 | 20-30 | 30-40 | 40-50 |
| No. of firms | 0 | 6 | 0 | 7 | 15 |
Ans. Range = L – S
= 50 – 0 = 50
Q.6. Find the range of the following distribution:
| Class Interval | 10-20 | 20-30 | 30-40 | 40-50 | 50-60 |
| Frequency | 8 | 10 | 15 | 18 | 19 |
Ans. Range = L – S = 60 – 10 = 50
Q.7. Calculate the QD for a group of data,
241, 521, 421, 250, 300, 365, 840, 958
Ans. The data: 241, 250, 300, 365, 421, 521, 840, 958
Here, N = 8
Q₁ = Size of (N + 1/4)th item = Size of (8 + 1/4)th item
= Size of 2.25th item
= 250+ (0.25) x (300 – 250)
= 250 + 12.5 = 262.5
Q₃ = Size of 3(N + 1) / 4th item = Size of 3(8 + 1)/4 = 27/4th item
= 6.25 item
= 521 + 0.25 x (840 – 521)
= 521 + 79.75 = 600.75
Q.D = Q₃ – Q₁/2 = 600.75 – 162.5/2 = 219.125
Q.8. From the following figures find the quartile deviation and its coefficient:
| Height (cms) | 150 | 151 | 152 | 153 | 154 | 155 | 156 | 157 | 158 |
| No. of Students | 15 | 20 | 32 | 35 | 33 | 22 | 20 | 12 | 10 |
Ans.
| Height (cms) | No. of students (f) | Cumulative frequency |
| 150 | 15 | 15 |
| 151 | 20 | 15 + 20 = 35 |
| 152 | 32 | 35 + 32 = 67 |
| 153 | 35 | 67 + 35 = 102 |
| 154 | 33 | 102 + 33 = 135 |
| 155 | 22 | 135 + 22 = 157 |
| 156 | 20 | 157 + 20 = 177 |
| 157 | 12 | 177 + 12 = 189 |
| 158 | 10 | 189 + 10 = 199 |
Here, N = 199
Q₁ = Size of (N+1/4) th item
= 199 + 1/4 = 200/4 = 50th
It is in 152 cms. Q₃ = Size of 3(N+1)/4th item = 3 (199 + 1)/4 = 600/4 = 150th item
It is in 155 cms. Q.D = Q₃ – Q₁/2 = 155 – 152/2 = 3/2 = 1.5 cm
Coefficient of Q.D = Q₃ – Q₁/ Q₃ + Q₁ = 155 – 152/ 155 + 152 = 3/307 = 0.009
Q.9. Using quartile deviation, state which of the two variables – A and B is more variable:
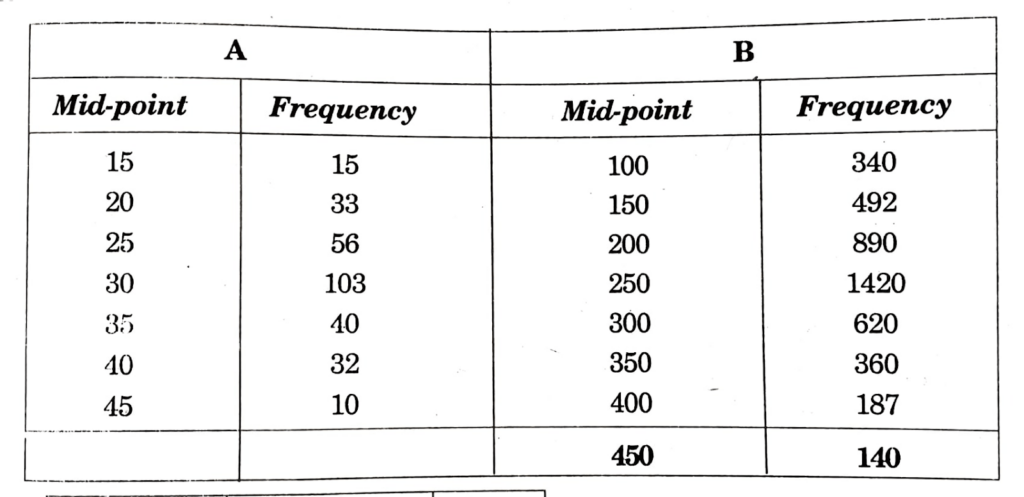
Ans. A.
| Mid – point | Frequency | cf |
| 15 | 15 | 15 |
| 20 | 33 | 48 |
| 25 | 56 | 104 |
| 30 | 103 | 207 |
| 35 | 40 | 247 |
| 40 | 32 | 279 |
| 45 | 10 | 289 |
Q₁ = N + 1/4 = 289 + 1/4 = 290/4 = 72.5
It lies in 25
Q₃ = 3 (N + 1)/4 = 3 (289 + 1)/4 = 3 × 210/4 = 870/4 = 217.5
It lies in 40
Q.D = Q₃ – Q₁/2 = 40 – 25/2 = 15/2 = 7.5
B.
| Mid – point | Frequency | cf |
| 100 | 340 | 340 |
| 150 | 492 | 832 |
| 200 | 890 | 1724 |
| 250 | 1420 | 3144 |
| 300 | 620 | 3764 |
| 350 | 360 | 4124 |
| 400 | 187 | 4311 |
| 450 | 140 | 4451 |
Q₁ = N + 1/4 = 4451 + 1/4 = 4452/4 = 2226
It lies in 250
Q₃ = 3 (N +1)/4 = 3(4451 + 1)/4 = 3 x 4452/4 = 3339
It lies in 300
Q.D = Q₃ – Q₁/1 = 300 – 250/2 = 50/2 = 25
Thus, B is more variable
Q.10. Find the quartile deviation from the following table:
| Size | 4-8 | 8-12 | 12-16 | 16-20 | 20-24 | 24-28 | 28-32 | 32-36 | 36-40 |
| Frequency | 6 | 10 | 18 | 30 | 15 | 12 | 10 | 6 | 2 |
Ans.
| Size | Frequency | cf |
| 4-8 | 6 | 6 |
| 8-12 | 10 | 16 |
| 12-16 | 18 | 34 |
| 16-20 | 30 | 64 |
| 20-24 | 15 | 79 |
| 24-28 | 12 | 91 |
| 28-32 | 10 | 101 |
| 32-36 | 6 | 107 |
| 36-40 | 2 | 109 |
Q₁ = N + 1/4 = 109 + 1/4 = 110/4 = 27.5
Q₁ lies in 12 – 16
Q₃ = 3(N + 1)/4 = 3(109 + 1)/4 = 3 x 110/4 = 330/4 = 82.5
Q₃ lies in 24 – 28
Q₁ = l₂ + l₂ – l₁/f (N/4 – cf) = 12 + 4/18 (109/4 – 34) = 10.5
Q₃ = l₂ + l₂ – l₁/f (3N/4 – cf) = 24 + 4/12 (327/4 – 91) = 20.91
Q.D = Q₃ – Q₁/2 = 20.91 – 10.5/2 = 5.2
Q.11. Calculate the coefficient of quartile deviation from the following data:
| Class Interval | Frequency |
| 10-15 | 4 |
| 15-20 | 12 |
| 20-25 | 16 |
| 25-30 | 22 |
| 30-40 | 10 |
| 40-50 | 8 |
| 50-60 | 6 |
| 60-70 | 4 |
| 8 |
Ans.
| Class Interval | Frequency | Cumulative Frequency |
| 10-15 | 4 | 4 |
| 15-20 | 12 | 4+12=16 |
| 20-25 | 16 | 16+16=32 |
| 25-30 | 22 | 32+22=54 |
| 30-40 | 10 | 54+10=64 |
| 40-50 | 8 | 64+8=72 |
| 50-60 | 6 | 72+6=78 |
| 60-70 | 4 | 78+4=82 |
Q₁ = N/4 = 82/4 = 20.5
Q₁ lies in 20 – 25
Q₃ = 3N/4 = 3 x 82/4 = 246/4 = 61.5
Q₁ = l₁ + l₂ – l₁/f (N/4 – cf)
= 20 + 5/16 (20.5 – 32) = 20 + 5/16 (11.5) = 16.4
Q₃ = l₁ + l₂ – l₁/f (3N/4 – cf) = 30 + 40 – 30/10 (61.5 – 64)
= 30 + (-2.5) = 30 – 2.5 = 28.75
Coeff. of Q.D = Q₃ – Q₁/Q₃ + Q₁ = 28.75 – 16.4/28.75 + 16.4 = 0.273
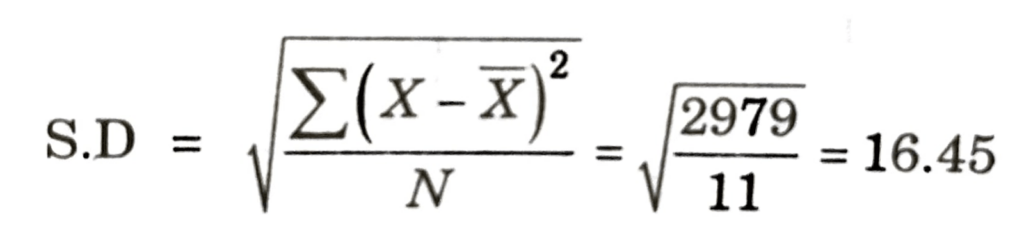
Q.12. Determine the standard deviation of the following students test results percentage
92%, 66%, 99%, 75%, 69%, 51%, 89%, 75%, 54%, 45%, 69%
Ans.
| Students | Marks | X – X̅ = X – 71 | (X – X̅)² |
| 1 | 45 | -26 | 676 |
| 2 | 51 | 20 | 400 |
| 3 | 54 | -17 | 289 |
| 4 | 66 | -5 | 25 |
| 5 | 69 | -2 | 4 |
| 6 | 69 | -2 | 4 |
| 7 | 75 | 4 | 16 |
| 8 | 75 | 4 | 16 |
| 9 | 89 | 18 | 324 |
| 10 | 92 | 21 | 441 |
| 11 | 99 | 28 | 784 |
| Σ (X – X̅)² = 2979 |
X̅ = ΣX/N = 784/11 = 71.27
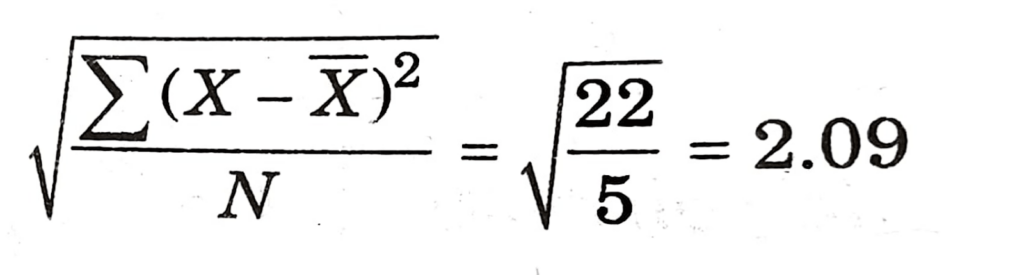
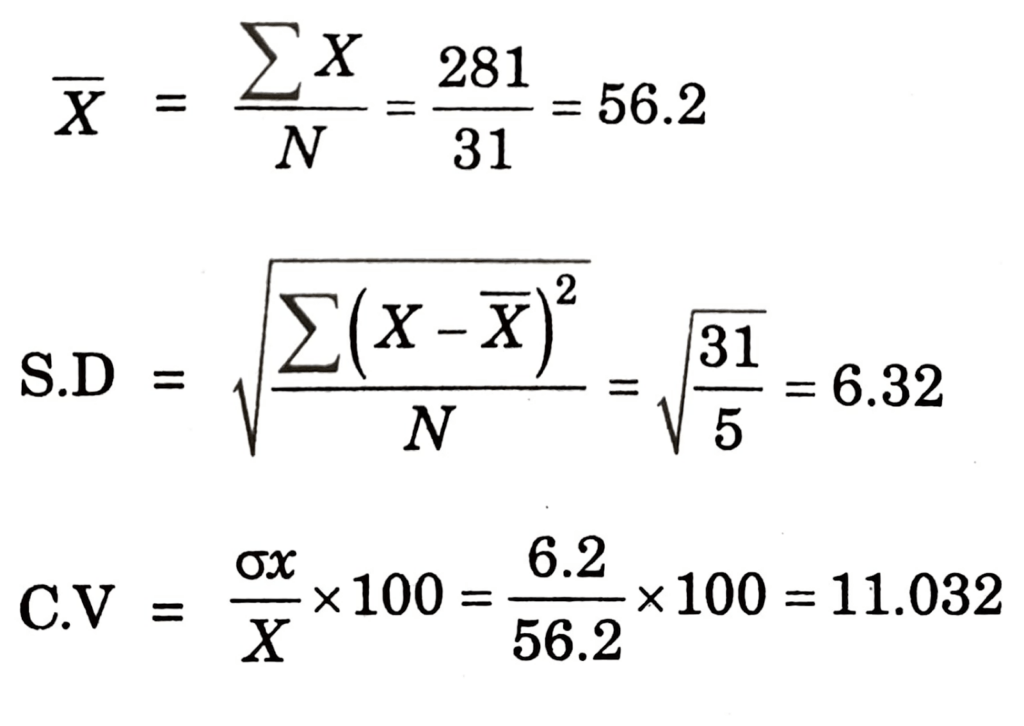
Q.13. Calculate the coefficient of variation for the following data set: The price (in ₹) of a stock over five trading days was 52, 58, 55, 57, 59.
Ans.
| Days | Prices | X – X̅ | (X – X̅)² |
| 1 | 52 | -4 | 16 |
| 2 | 55 | -1 | 1 |
| 3 | 57 | 1 | 1 |
| 4 | 58 | 2 | 4 |
| 5 | 59 | 3 | 9 |
| 31 |
Q.14. The frequency table of the monthly salaries of 20 people is shown below:
| Salary (in ₹) | 3500 | 4000 | 4200 | 4300 |
| Frequency | 5 | 8 | 5 | 2 |
(a) Calculate the mean of the salaries of the 20 people.
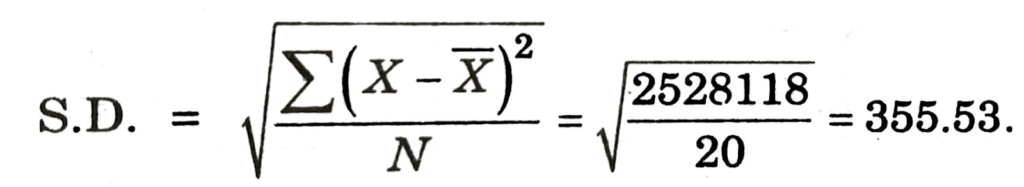
(b) Calculate the standard deviation of the salaries of the 20 people.
Ans.
| Salary in (₹) | Frequency (f) | X – X̅ | (X – X̅)² |
| 3500 | 5 | -795 | 632025 |
| 4000 | 8 | -792 | 627264 |
| 4200 | 5 | -795 | 632025 |
| 4300 | 2 | -798 | 636804 |
| 2528118 |
X̅ = ΣX/N = 16000/20 = 800
The mean of the salaries of the 20 people is 800.
(b)
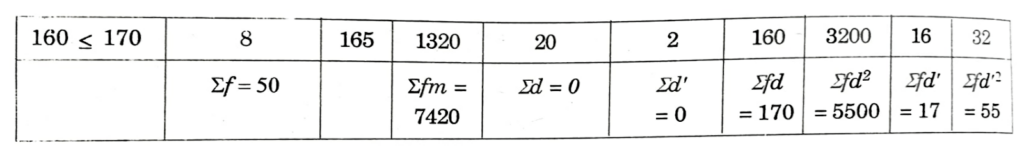
Q.15. The following table shows the grouped data in classes, for the height of 50 people.
| Height (in cm) – classes | Frequency |
| 120 ≤ 130 | 2 |
| 130 ≤ 140 | 5 |
| 140 ≤ 150 | 25 |
| 150 ≤ 160 | 10 |
| 160 ≤ 170 | 8 |
(a) Calculate the mean of the salaries of the 50 people.
(b) Calculate the standard deviation of the salaries of the 50 people.
Ans.
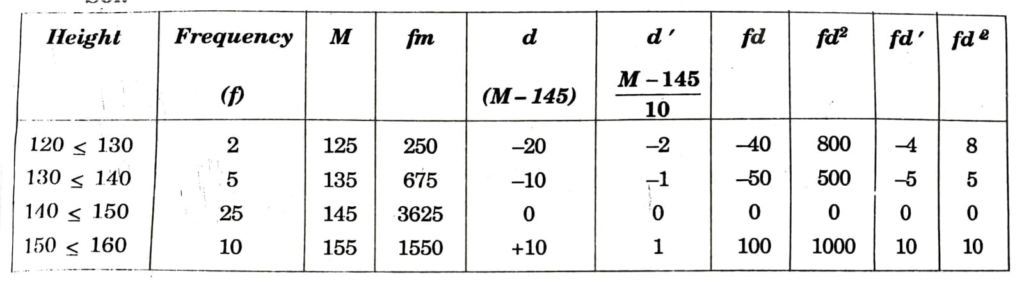
(a) Mean (X̅) = Σfx / Σf
= 7420/50
= 148.4
(b) Standard Deviation
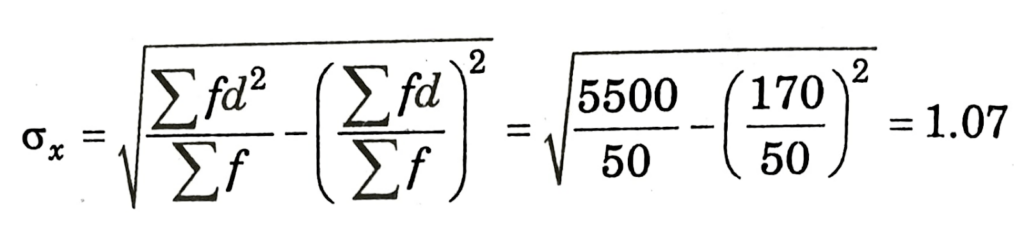
Q.16. The following is the frequency distribution for the speeds of a sample of automobiles travelling on an interstate highway:
| Speed Miles per Hour | Frequency |
| 50-54 | 2 |
| 55-59 | 4 |
| 60-64 | 5 |
| 65-69 | 10 |
| 70-74 | 9 |
| 75-79 | 5 |
| 35 |
Calculate the mean and the standard deviation of speed.
Ans.
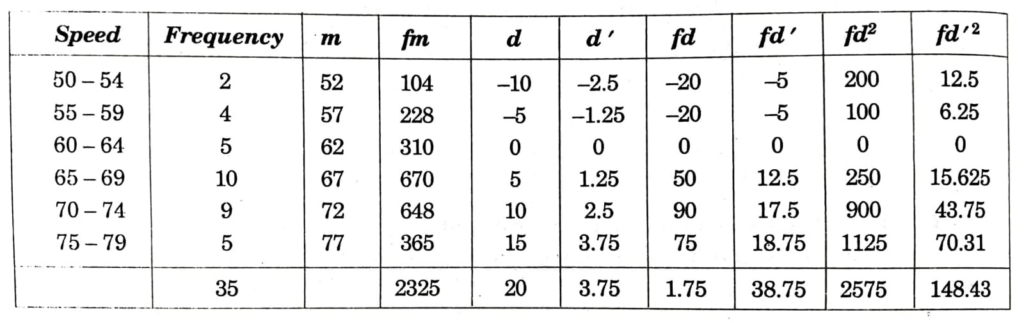
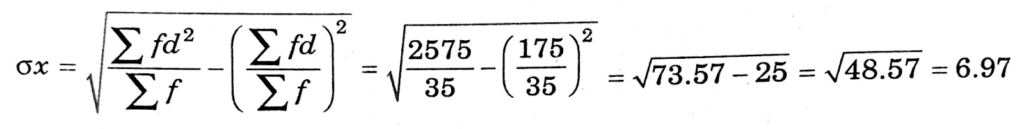
Mean (X̅) = Σfm/Σf = 2325/35 = 66.42
Standard deviation (S.D)
Q.17. In 2012, the average age of workers in a company was 22 with a standard deviation of 3.96. In 2013, the average age was 24 with a standard deviation of 4.08. In which year do the ages show a more dispersed distribution? Show your complete work and support your answer.
Therefore the year 2012 shows a more dispersed distribution.
Ans. In 2012, Mean = 22, σx = 3.96
In 2013, Mean = 24, σx = 4.08
In Comparison Distribution Reason
Average Magnitude II > I
X̅₁₁ = 25 > X̅₁ = 22
Variation I > II
CV₁ = 3.96/22 x 100 = 18
CV₁₁ = 4.08/24 x 100 = 18 = 17
Q.18. The following is a frequency distribution for the ages of a sample of employees at a local company
| Age (in years) | Frequency |
| 30-39 | 2 |
| 40-49 | 3 |
| 50-59 | 7 |
| 60-69 | 5 |
| 70-79 | 1 |
(a) Determine the average age for the sample.
(b) Compute the standard deviation.
(c) Compute the coefficient of variation.
Ans.
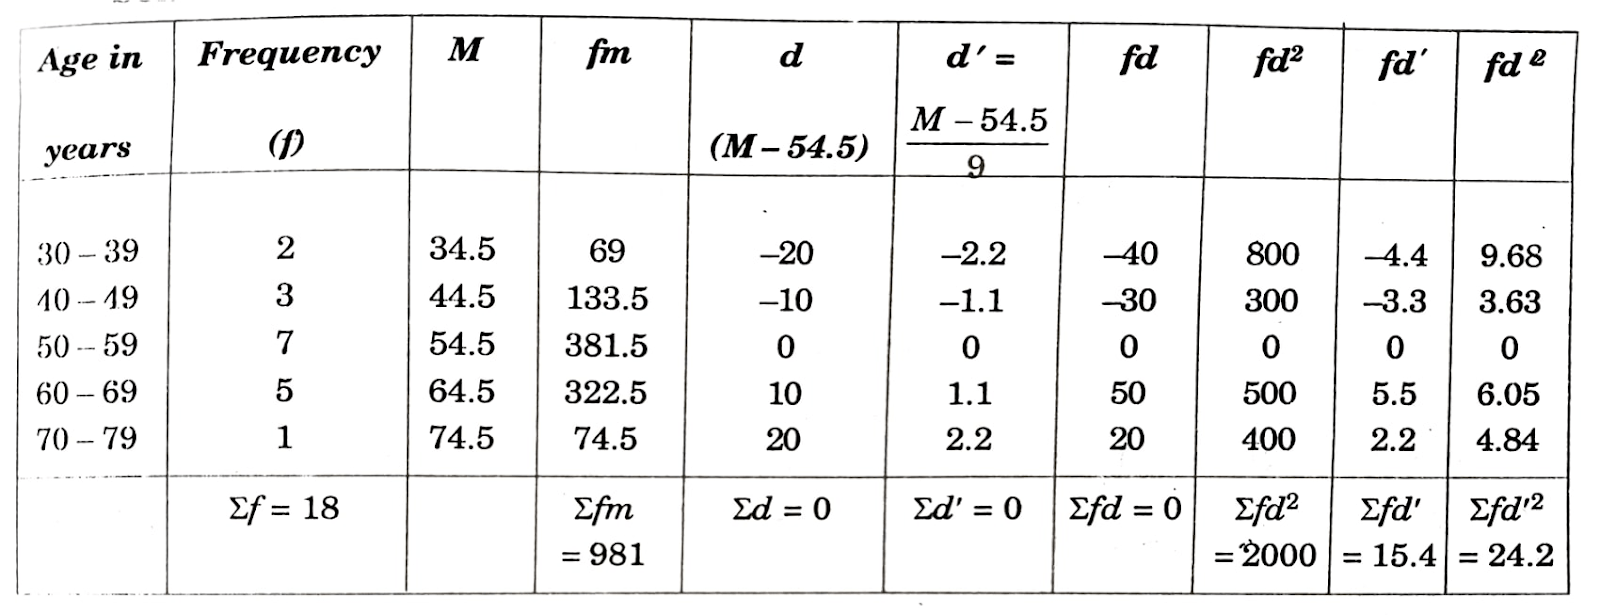
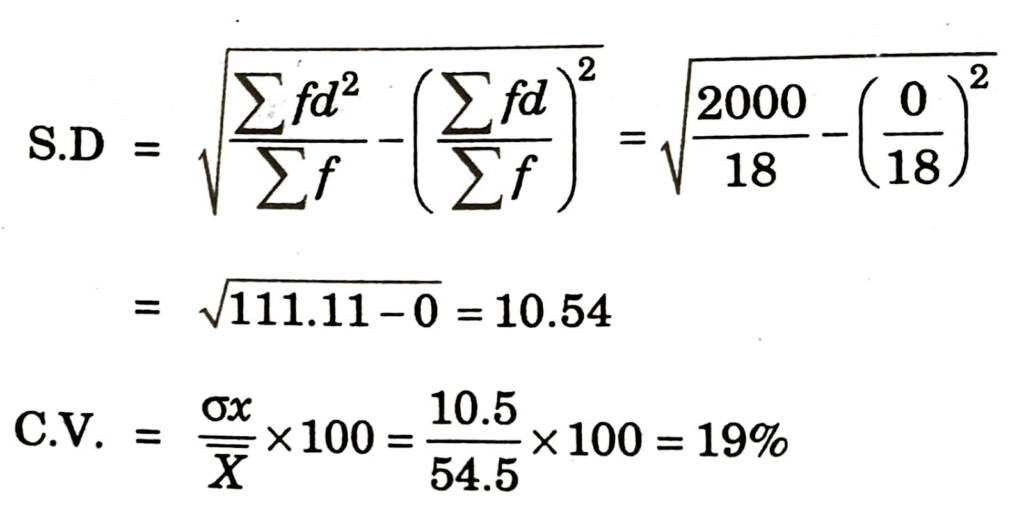
(a) Average age of the sample = Σfm/Σf = 981/18 = 54.5
(b)
Q.19. The population change between 1990 and 2000 for several small cities are shown below:
| City | A | B | C | D | E | F | G | H |
| Population Change | 3083 | 1466 | -461 | 1113 | -11 | 395 | 3290 | 437 |
For the above sample, determine the following measures
(a) The Mean.
(b) The standard deviation.
(c) The median.
Ans.
| City | Population | X – X̅ | (X – X̅)² |
| A | 3083 | 1919 | 3682561 |
| B | 1466 | 302 | 91204 |
| C | -461 | 703 | 494209 |
| D | 1113 | -51 | 2601 |
| E | -11 | 1153 | 1329409 |
| F | 395 | -769 | 591361 |
| G | 3290 | 2126 | 4519876 |
| H | 437 | 727 | 528529 |
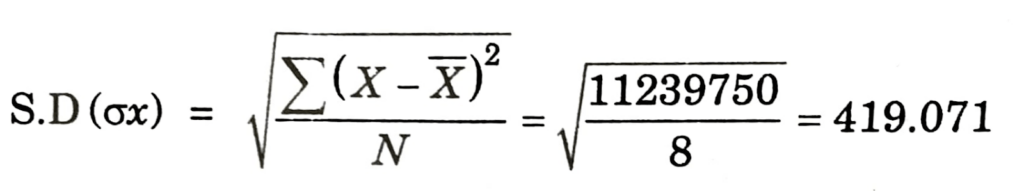
| 9312 | 11239750 |
(a) X̅ = Σfx / Σf = 9312/8 = 1164
(b)
(c) In ascending order, the changes will be: -11, -461, 395, 437, 1113, 1466, 3083, 3290
Median = N/2 = 4th item
Hence it is in 437
Median = 437
Some Other Important Questions For Examinations
Very Short Answer Type Questions
Q.1. Define coefficient of range.
Ans. It is a relative measure of the range. It is used in the comparative study of the dispersion.
Coefficient of Range = L – S/L + S
In case of continuous series Range is just the difference between the upper limit of the highest class and the lower limit of the lowest class.
Q.2. Define Quartile deviation.
Ans. Quartile deviation is based on the lower Quartile Q₁ and the upper Quartile Q₃. The difference Q₃ – Q₁ is called the inter – Quartile range. The difference Q₃ – Q₁ is divided by 2 is called semi-inter – quartile range or the quartile deviation.
Q.3. Find out the quartile deviation of daily wages (in ₹) of 7 persons is given below: 120, 70, 150, 100, 190, 170, 250.
Ans. Arrange the data in an ascending order, we get 70, 100, 120, 150, 170, 190, 250
Here, n = 7
Q₁ = Size of = (N + 1/4) th item
= Size of (7+1/4) th item
= 2nd item = 100 rupees
Q₃ = Size of 3(N + 1)/4 th item
= 3(7 + 1)/4 = 3 x 8/4
= th item = 190 rupees
Q.D = Q₃ – Q₁/2 = 190 – 100/2 = 90/2 = 45 rupees.
Q.4. What is dispersion.
Ans. Dispersion measures the extent to which different items tend to dispense away from the central tendency.
Q.5. Define quartile deviation.
Ans. Quartile deviation is half of Inter Quartile Range.
Quartile Deviation = Q₃ – Q₁/2
Q.6. How is coefficient of quartile deviation calculated?
Ans. Coefficient of quartile deviation is calculated by using the following formula:
Coefficient of QD
= Q₃ – Q₁/2 ÷ Q₃ + Q₁/2 = Q₃ – Q₁/Q₃ + Q₁
Q.7. Define mean deviation.
Ans. Mean deviation is the arithmetic average of the deviations of all the values taken from some average value (mean, median, mode) of the series, ignoring sign (+ or -) of the deviations.
Q.8. What is Mean absolute deviation?
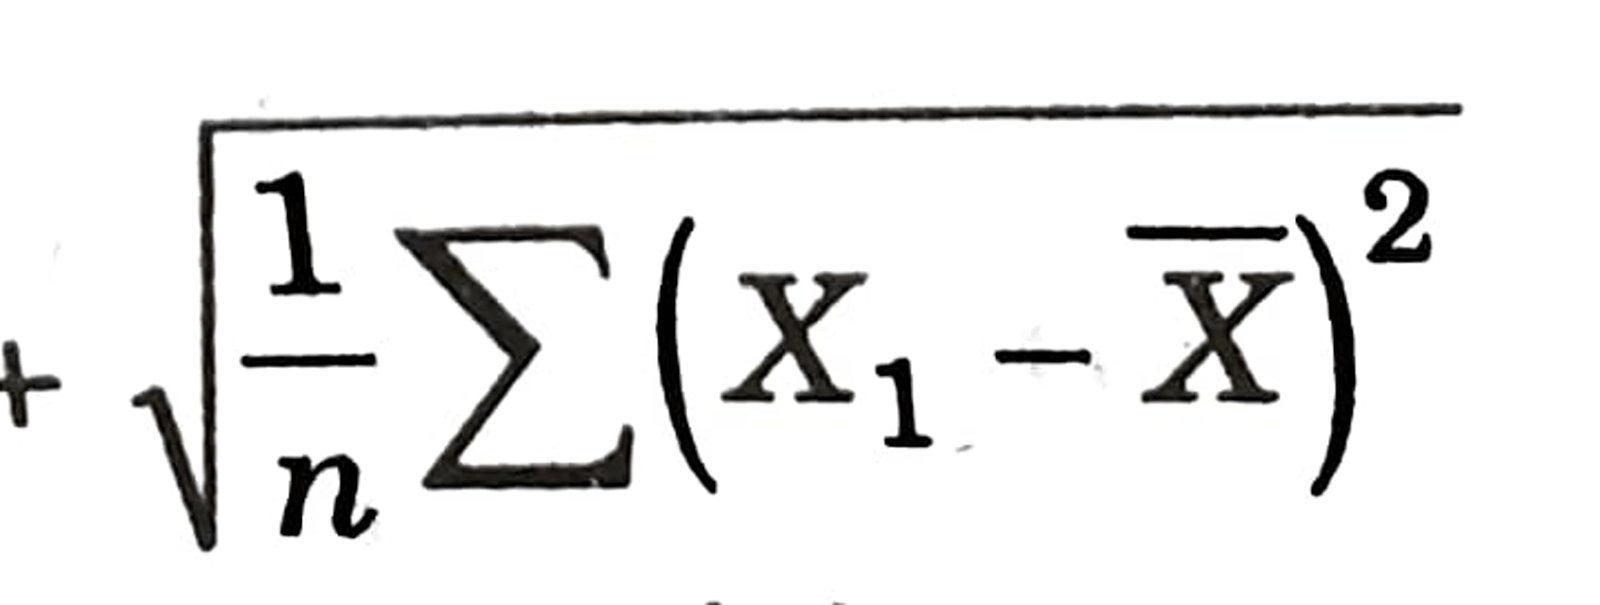
Ans. The arithmetic mean of the absolute deviation is called the mean deviation or mean absolute deviation. Thus 1/n Σ |X – X̅| is the mean deviation of X about the arithmetic mean.
Q.9. Define standard deviation.
Ans. The positive square root of the variance is called the standard deviation of the given value. In equation.
Standard Deviation (s) =
Standard deviation is always positive. It is absolute measure.
Q.10. Give formula to calculate standard deviation of a frequency distribution series by direct method.
Ans. X̅ = Σfm/N
where x = X – X̅
x = deviation
X = mid value
X̅ = Mean value
Q.11. What is Lorenz Curve?
Ans. Lorenz Curve is a measure of deviation of actual distribution from the line of equal distribution.
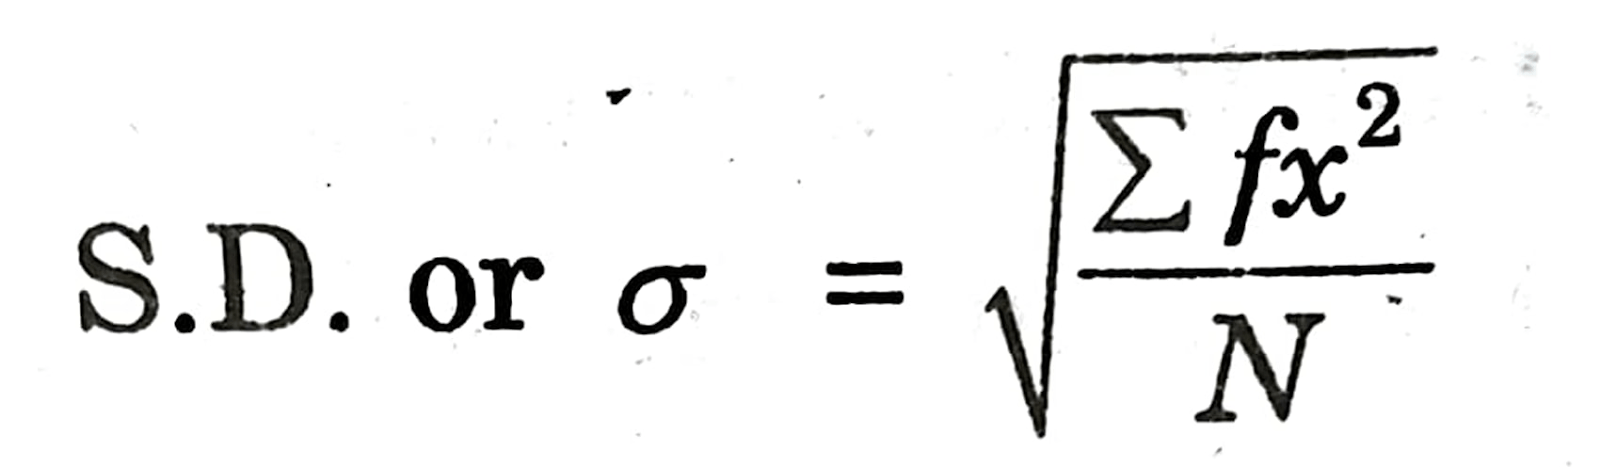
Q.12. Give formula of standard deviation for discrete series.
Ans.
Q.13. Give formula of mean deviation through mean for individual series.
Ans. Mean Deviation through mean for individual series.
MDX̅ = Σ|X – X̅/N or Σ|d – X̅/N
X – X̅ = Deviation from the arithmetic average
N = No. of items.
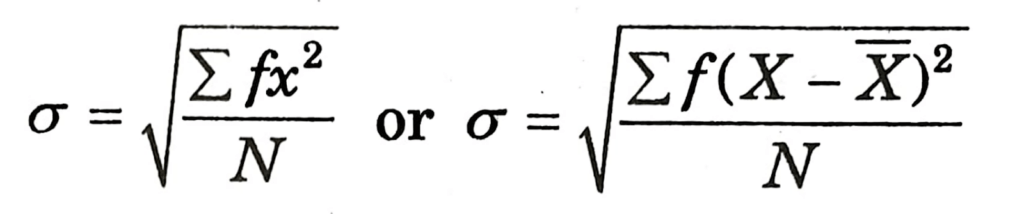
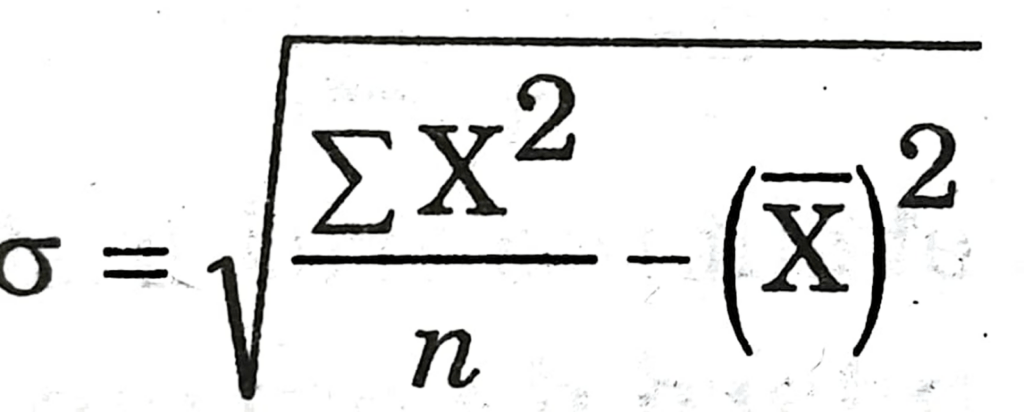
Q.14. Write down the formula for calculating standard deviation directly.
Ans.
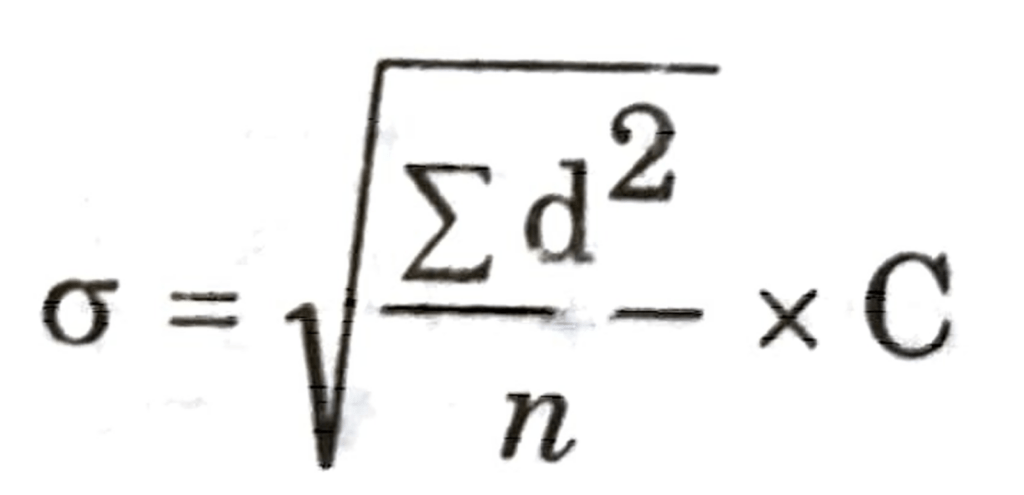
Q.15. Which formula is used for calculating standard deviation of individual series by step deviation method.
Ans.
Q.16. What is the variance?
Ans. Variance is the square of standard deviation. In equation, Variance = (σ)².
Q.17. Define the range.
Ans. The range is defined as the difference between the largest and the smallest value of the variable in the given set of values.
R = L – S.
Q.18. How is Q₁ calculated in individual and discrete series?
Ans. In individual and discrete series. Q₁ is calculated by adopting the following formula:
Q₁ = Size of n + 1/4 th value.
Q.19. How is standard deviation independent of origin?
Ans. Standard deviation is independent of origin as it is not affected by the value of constant from which deviations are calculated. The value of the constant does not figure in the standard deviation formula.
Q.20. Write down any one difference between mean deviation and standard deviation.
Ans. In the calculation of mean deviation, signs of deviations (+) or (-) are ignored, but in the calculation of standard deviation there signs are not ignored.
Q.21. Calculate coefficient of standard coefficient from the following information:
(i) S.D. = 4.93
(ii) Mean = 11
Ans. Coefficient of S.D. = S.D./Mean = 4.93/11
= 0.45
Q.22. Write the formula for the calculation of the coefficient of range?
Ans. Coefficient of Range = L – S / L + S
Q.23. Write the formula of Quartile Deviation.
Ans. Quartile Deviation:
QD = Q₃ – Q₁/2

Hi! my Name is Parimal Roy. I have completed my Bachelor’s degree in Philosophy (B.A.) from Silapathar General College. Currently, I am working as an HR Manager at Dev Library. It is a website that provides study materials for students from Class 3 to 12, including SCERT and NCERT notes. It also offers resources for BA, B.Com, B.Sc, and Computer Science, along with postgraduate notes. Besides study materials, the website has novels, eBooks, health and finance articles, biographies, quotes, and more.