NIOS Class 12 Economics Chapter 19 Supply, Solutions to each chapter is provided in the list so that you can easily browse through different chapters NIOS Class 12 Economics Chapter 19 Supply and select need one. NIOS Class 12 Economics Chapter 19 Supply Question Answers Download PDF. NIOS Study Material of Class 12 Economics Notes Paper 318.
NIOS Class 12 Economics Chapter 19 Supply
Also, you can read the NIOS book online in these sections Solutions by Expert Teachers as per National Institute of Open Schooling (NIOS) Book guidelines. These solutions are part of NIOS All Subject Solutions. Here we have given NIOS Class 12 Economics Chapter 19 Supply, NIOS Senior Secondary Course Economics Solutions for All Chapters, You can practice these here.
Supply
Chapter: 19
Module – VII: Producer’s Behaviour
TEXT BOOK QUESTIONS WITH ANSWERS
INTEXT QUESTIONS 19.1.
Q.1. Define supply.
Ans. Supply may be defined as the quantity of a commodity offered for sale at given price per unit of time.
Q.2. What is the meaning of supply?
Ans. Supply a commodity by a firm or seller may be defined as the quantity of a commodity that a firm or seller offers for sale at a given price during a given time period. But the actual sale of the commodity may be different from its supply. For example a farmer (produced of wheat) is willing to sell 50 quintals of wheat at a price of 15 per kg but he is able to sell only 30 quintals at this price. So this case the supply of wheat is 50 quintals but the actual sale is 30 quintals. So these two concepts should not be confused with each other. Like demand supply also has three elements. The definition of supply include
(i) the quantity of the commodity that a firm is willing to supply.
(ii) the price at which it is willing to supply that quantity. and
(iii) the time period during which it is willing to supply that quantity.
Q.3. State any three determinants of supply.
Ans. Determinants of supply:
(i) Price of inputs/factors: Change in the price of inputs like raw material, wage, rent or interest also influences the supply of a commodity. For example, in the production of cloth, cotton is the main raw material. If the price of cotton increases, the cost of production of cloth will increase. At the same price, the margin of profit will decrease. So the producer will decrease the supply of cloth at the same price. On the other hand if the price of cotton falls, the cost of production per unit of cloth will decrease and hence the supply of cloth will increase. The price of other inputs will also influence the supply of a good in the same manner.
(ii) Technology of production: An improvement in the technology of production of a commodity decreases the per unit cost of the commodity. The margin of profit will increase at the same price. So the supply of a commodity will increase, with improvement in technology of production, at the same price. On the other hand if a firm uses absolute technology of production, the cost of production per unit of the commodity will increase. The margin of profit will decrease, so the firm will decrease its supply at the same price. This is the main reason that the firms are trying to use better technology of production because it not only reduces the cost of production per unit but also improves the quality of the product.
(iii) Taxation policy of government: If the government reduces the excise duty or the production of a commodity, the cost of production per unit of the commodity will decrease, the margin of profit will increase at the same price so the producer of the commodity will increase its supply. It happens when the government wants to increase the production of the commodity. On the other hand to discourage the production of some harmful goods, like cigarettes, liquor etc, the government increases the rate of excise duty on the production of such goods. So the cost of production per unit of the commodity increases and the supply of such commodities decreases.
Q.4. How does technological progress influence the supply of a commodity?
Ans. With the technological progress, the firm can produce more output with the same levels of inputs. In other words, to produce a given level of output, the firm now requires less of inputs. As a result, the marginal costs fall, this results in a rightward (or downward) shift of MC curve and supply curve is essentially a segment of MC. Hence with technological progress, the supply curve of the firm shifts to the right.
Q.5. What is the effect of change in price of inputs on the supply of a commodity?
Ans. Price if inputs affect the supply of a commodity for example, the increases in the cotton price may increase the cost of production of cloth. It may reduce the profits of business and that in turn the producer may lower its production and supply.
Q.6. How does change in the price of other related goods affect the supply of a commodity?
Ans. The change in the price of related goods affects the supply of a commodity. For example, if the price of pulses increase, the farmers may produce pulses in stead of the food grain like paddy and wheat.
INTEXT QUESTIONS 19.2.
Q.1. State the law of supply.
Ans. The law of supply depicts the relationship between price and quantity supplied of a commodity when all other determinants of supply remain constant. This law states that there is a direct relationship between price and quantity supplied of a commodity, other factors determining supply remaining constant. It means quantity supplied of a commodity increases with increase in price and decreases with decrease in price.
Q.2. Define market supply.
Ans. Market supply of a commodity is the total of various quantities offered for sale by all the individual firms in the market at a given price during a given period of time. Market supply is obtained by adding the supply of all the individual sellers (three in example) of the commodity in the market. It has been explained below with the help of a table.
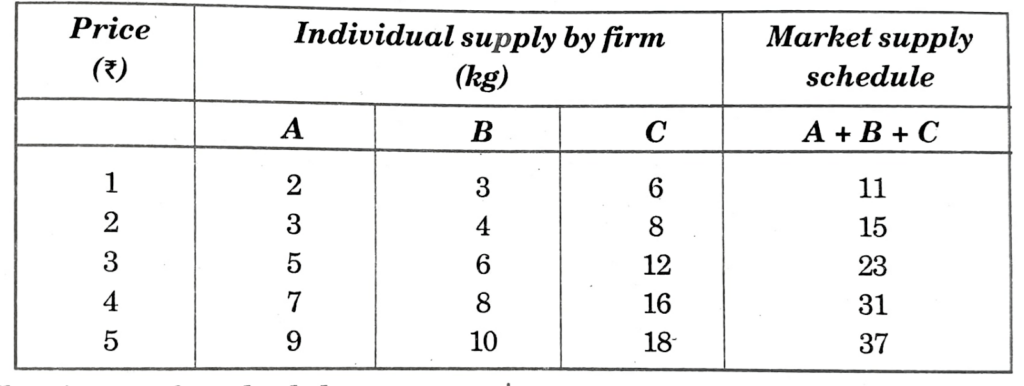
Q.3. What is supply schedule.
Ans. A supply schedule is a table that illustrates how much of a good or service suppliers are willing and able to supply at many different prices. For example, the supply schedule for local bananas sold at the supermarket might look like this:
Supply Schedule for Bananas
| Cost (in ₹) | Supply |
| 30 | 500 bananas.a week |
| 40 | 600 bananas a week |
| 50 | 775 bananas a week |
| 60 | 1000 bananas a week |
The supply schedule shows the supply changes when you increase or decrease the price. As you can see from this supply schedule, when the price goes from ₹ 30 to ₹ 60, the amount of bananas supplied goes up.
Q.4. How is market supply schedule deviated from individual supply schedule?
Ans. Supply schedule is a table showing different quantities of a commodity that a firm is willing to sell at different prices during a given period of time. Supply schedule can be of two types:
(i) Individual supply schedule: When we represent a single firm, willingness to sell different quantities of a commodity at different prices during a given time period, we get individual supply schedule.
(ii) Market supply schedule: Market supply schedule is constructed by summing up the supplies of all the individual firm at different prices during a given period of time. A market supply schedule is a table showing the total supply of a good by all the firms at different price during a given time period. Market supply schedule can be explained with the help of the following table:

In the above table we see that at a price of ₹ 25 per kg. the firms A, B and C willing to sell 100, 200 and 0 kgs of sugar respectively. So the market supply as ₹ 25 is 100 + 200 + 0 = 300 kgs of sugar. In the same way the market supply has been calculated at other prices also. The market supply is influenced by the number of firms in the market.
Q.5. What is supply curve?
Ans. Supply curve is the graphical presentation of a supply schedule. It shows the quantity that all the firms in the market are willing to supply at a given price during a given time period when all other factors influencing supply remain constant. Supply curve is also of two types:
(i) Individual supply curve: Graphical presentation of individual supply schedule is called individual supply curve. It shows the different quantities of a commodity, an individual firm is willing to sell at different prices during a given time period.
(ii) Market supply curve: Market supply can be derived by horizontal summation of all individual supply curve: It show the different quantities of a commodity that all the firms are willing to sell at different prices during a given time period.
Let us assume that these are only 3 firms supplying sugar in the market. The supply curves of these firms are represented by SA, SB and SC respectively. If at ₹ 30 per kg each firm is willing to sell 200, 300 and 100 kgs of sugar respectively.
The market supply at ₹ 30 per kg is the sum of a the supply of the three firms 200 + 300 + 100 = 600 kgs of sugar. This gives us one point A on the market supply curve as shown in the figure given below-

Q.6. How is the market supply curve derived from individual supply curves?
Ans. Supply and demand are two of the most fundamental concepts in economics, examining the interaction of price, consumer demand for products and the willingness of firms to supply those goods. Economists and business managers often use supply and demand graphs to examine the relationship of these phenomena. These graphs consist of supply and demand curves. The supply curve measures the quantity of products that sellers are willing to supply at different price levels. Just as non-price factors affect the demand curve, several factors determine the shape of the supply curve.
The market supply curve is a visual display of the relationship between the price of a product and the quantity that companies are willing to supply, holding other factors constant. Economists display supply curves on a two-dimensional graph in which the vertical axis represents price and the horizontal axis represents quantity. The market supply curve for most products slopes upward and to the right, reflecting greater supply as prices rise. As prices rise, companies have a greater incentive to produce more of a good and offer it for sale.
Q.7. Explain the law of supply with the help of a schedule and a diagram.
Ans. Law of Supply: The law of supply states that quantity supplied of a good usually varies directly with its price, assuming that all other factors determining supply remains the same.
Supply schedule of a producer for a good
| Price (₹) | Quantity Supplied (Units) |
| 1 | 100 |
| 2 | 200 |
| 3 | 300 |
| 4 | 400 |
| 5 | 500 |
The table shows that there is direct relation between price and supply of a good and that as price changes there is no change in factors other than the price influencing supply.
INTEXT QUESTIONS 19.3.
Q.1. If the quantity supplied of a commodity falls only due to rise in its price, what is that fall in supply called?
Ans. If the quantity supplied of a commodity falls only due to rise in its price, it is called contraction in supply.
Q.2. If the supply of a commodity rises due to improvement in technology, what is that rise in supply called?
Ans. If the supply of a commodity rises due to improvement in technology the rise in supply called increase in supply.
Q.3. State any three factors causing increases in supply of a commodity.
Ans. Three factors causing increase in supply of commodity are:
1. Price of the given Commodity.
2. Prices of Other Goods.
3. Prices of Factors of Production (inputs).
Q.4. State any three factors causing decrease in supply of commodity.
Ans. Three factors causing decrease in supply of commodity are:
1. Technological changes influence the supply of a commodity. Advanced and improved technology reduces the cost.
2. Government Policy (Taxation Policy).
3. Goals/Objectives of the firm.
Q.5. Write any three factors causing right ward shift to supply curve.
Ans. Lower costs would result in an increase in output, shifting the supply curve outward (to the right) and the supplier will be willing sell a larger quantity at each price level. The supply curve will shift in relation to technological improvements and expectations of market behaviour in very much the same way described for production costs.
Technological improvements that result in an increase in production for a set amount of inputs would result in an outward shift in supply. Supply will shift outward in response to indications of heightened consumer enthusiasm or preference and will respond by shifting inward if there is an assessment of a negative impact to production costs or demand.
Q.6. Write any three factors causing left ward shift to supply curve.
Ans. If production costs increase, the supplier will face increasing costs for each quantity level. Holding all else the same, the supply curve would shift inward (to the left), reflecting the increased cost of production. The supplier will supply less at each quantity level.
(a) This may happen because of technological changes.
(b) Changes in the government policy.
(c) Changes in consumer’s behaviour.
Q.7. Distinguish between expansion of supply and increase in supply of a commodity.
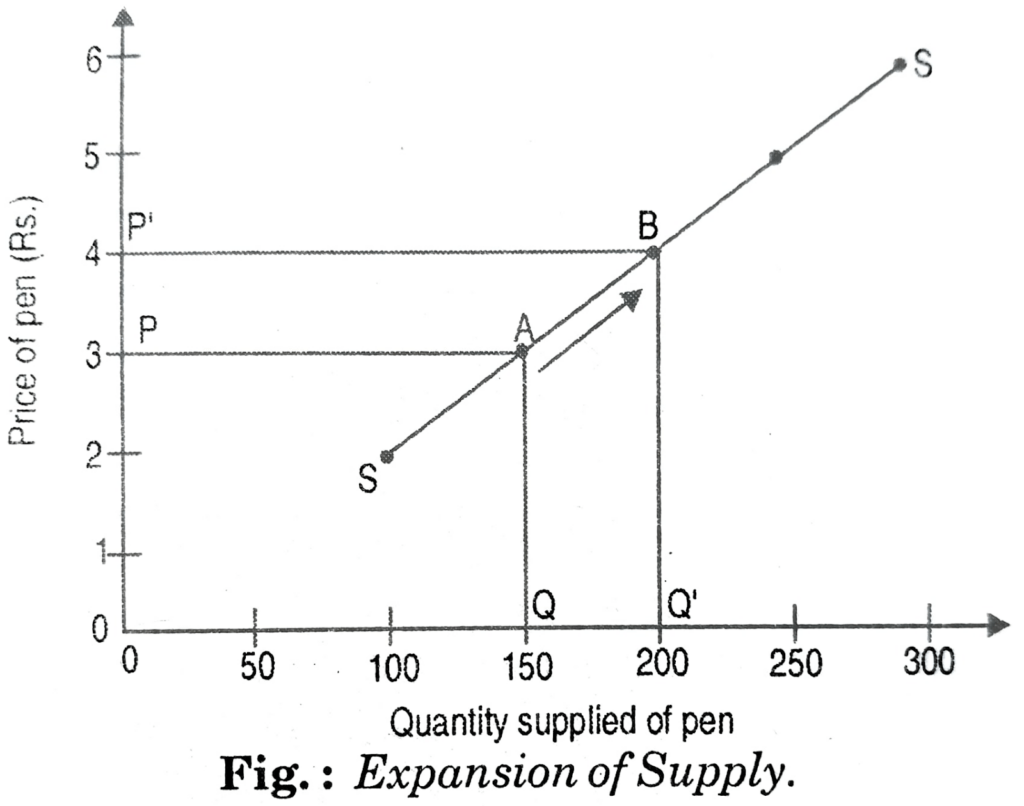
Ans. Expansion of Supply: When the quantity supplied of a commodity rises, due to a rise in its price other things remaining the same.
Table Supply schedule of a firm.
| Price (per pen) (₹) | Quantity supplied of Pen (Per month) |
| 2 | 100 |
| 3 | 150 |
| 4 | 200 |
| 5 | 250 |
| 6 | 300 |
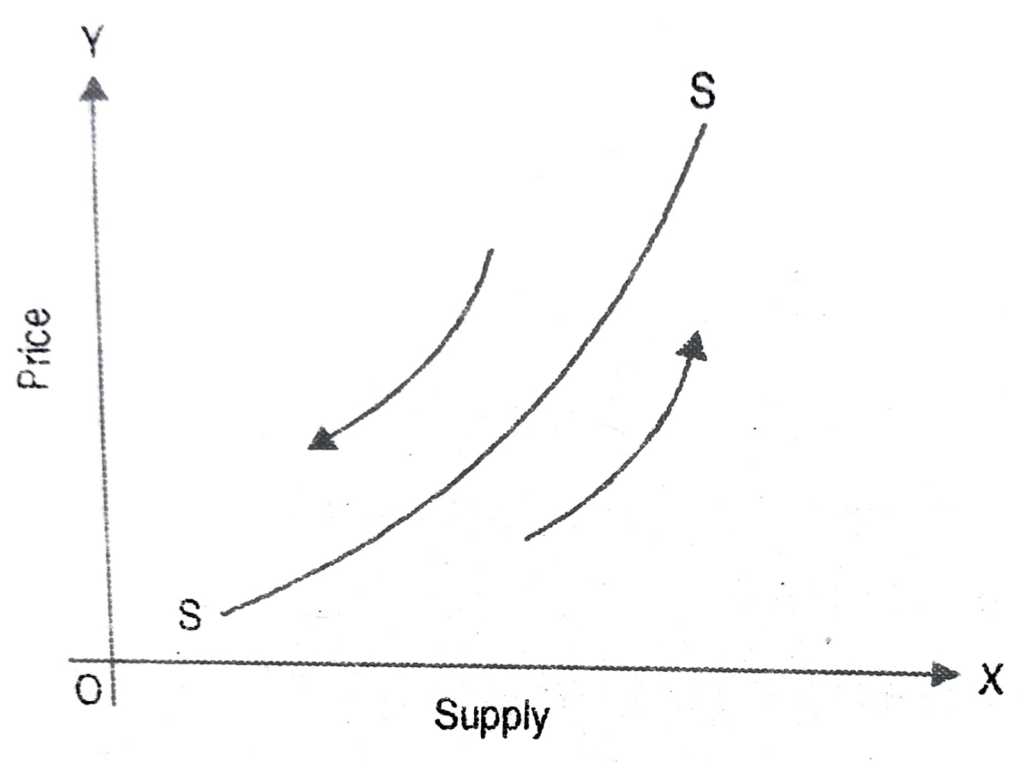
it is called expansion of supply. Table shows a supply schedule. As the price of pen rises the supply is rising. This is called expansion of supply. Diagrammatically it would mean an upward movement along the given supply curve. as shown in Fig.
Increase in Supply: When at the same price, the supply of a commodity rises due to changes in anyone or more of other factors, then
Table.
| Price of pens (Rs.) | Original Supply | Increased Supply |
| (1) | (2) | (3) |
| 2 | 20 | 30 |
| 3 | 30 | 40 |
| 4 | 40 | 50 |
| 5 | 50 | 60 |
| 6 | 60 | 70 |
it is called an increase in supply. Thus, increase in supply means more supply of a commodity at the same price. The following table shows the increase in supply.
In the above table, notice that at each of the prices shown in column (1) the supply has.increased [compare the quantities given in columns (2) and (3)]. If we plot this table on a graph paper we will get the Fig.
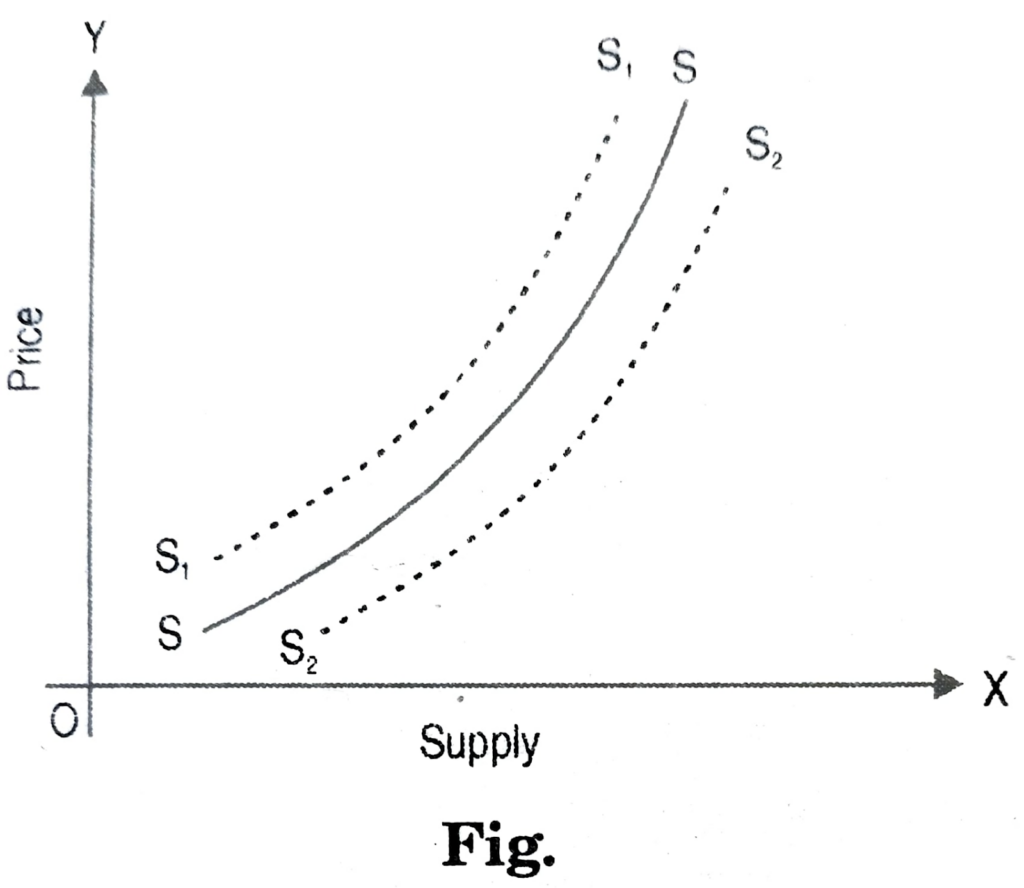
The original supply curve is SS and the new supply curve showing increased supply at each price is S¹S¹. Thus when an increase in supply takes place the supply curve shifts rightwards indicating that at the same price the supply has increased.
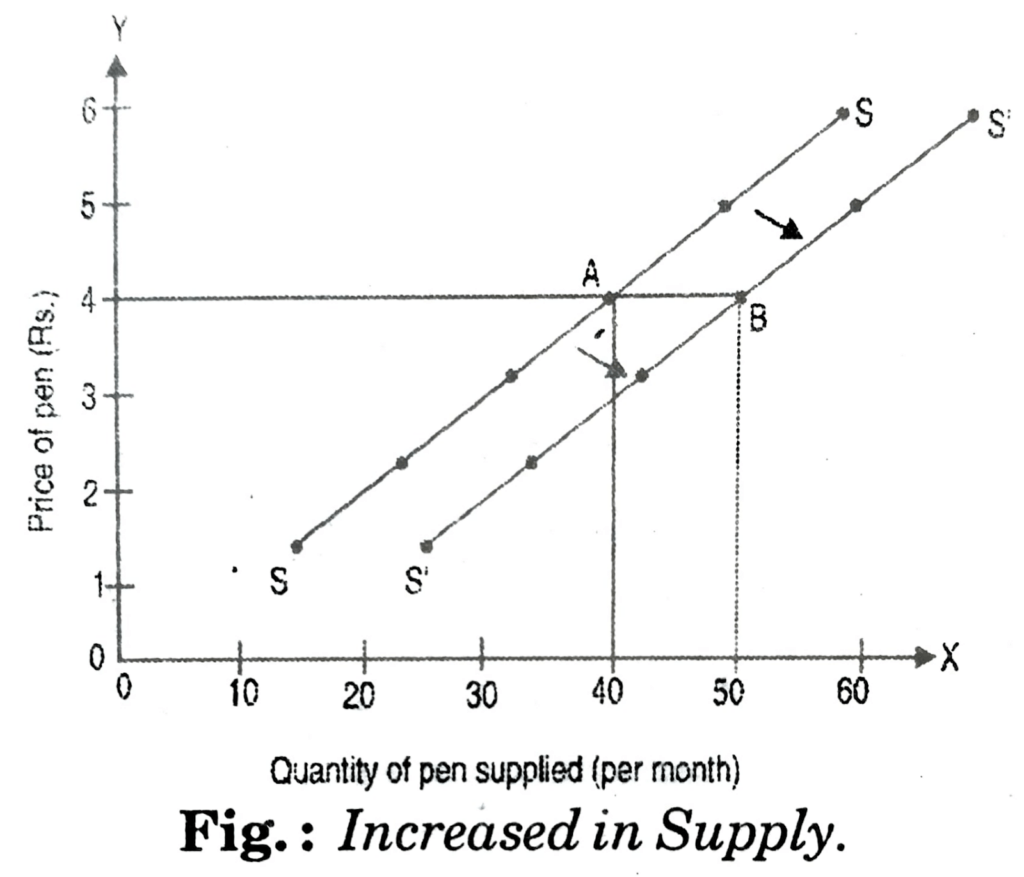
Point A on original supply curve SS shows that at a price of Rs. 4 per pen the quantity supplied is 40 pens. Point B on the new supply curve S¹S¹ shows that at the same price of Rs. 4 per pen the quantity supplied has increased to 50 pens. The arrows in the figure show the rightward shift of supply curve.
Q.8. Distinguish between contraction of supply and decrease in supply of a commodity.
Ans. (a) Contraction of supply: When the quantity supplied of a commodity falls due to a fall in its price, other factors remaining the same, it is called contraction of supply. At price OP, the quantity OQ of the commodity is supplied. When the price of the commodity falls to OP¹, the quantity supplied of the commodity is reduced to OQ₁. This reduction in quantity supplied due to the fall in price is called contraction of supply.

(b) Decrease in supply: When at the same price of a commodity its supply falls due to other factors it is called decrease in supply. In other words, decrease in supply of a commo-dity means less supply to it at the same price.
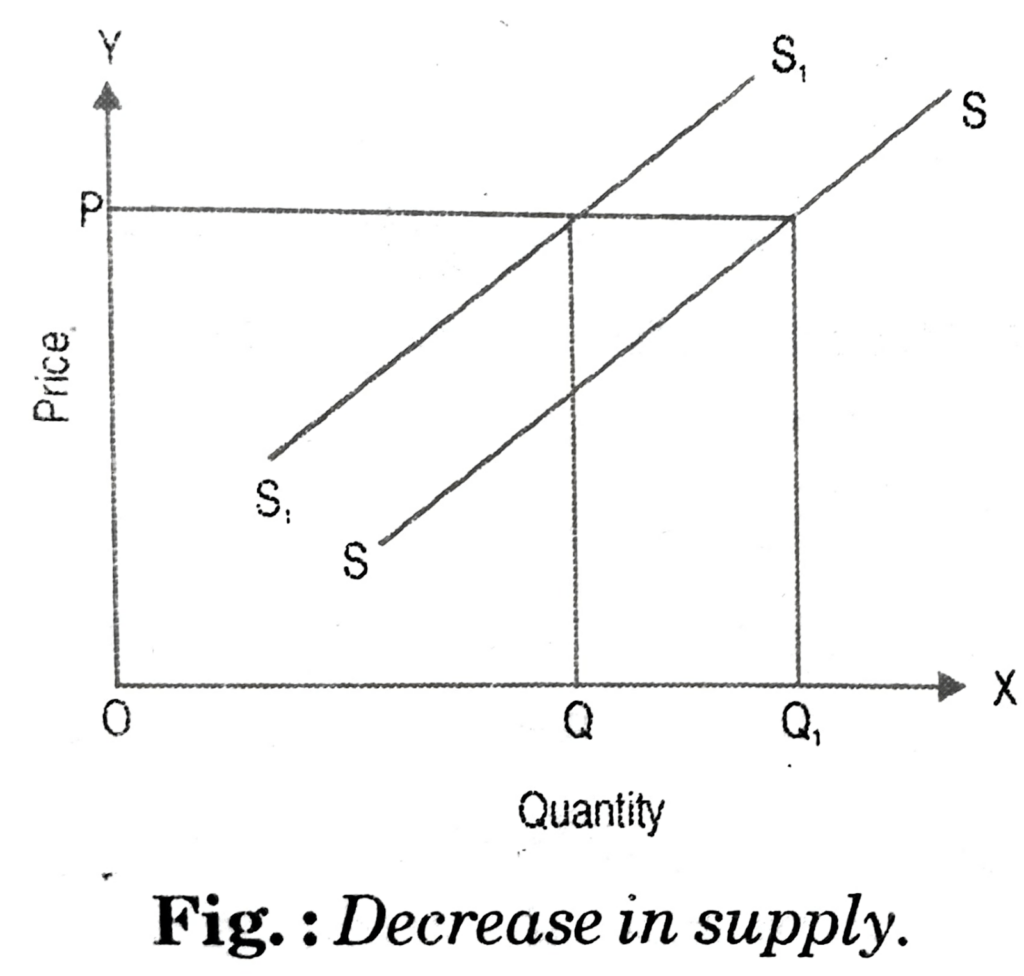
SS is the original supply curve and supply curve S¹S¹ shows the decreased supply (as given in column). The supply curve has shifted leftward. So, a decrease in supply results in a leftward shift of the supply curve.
Thus a contraction of supply of a commodity means a fall in supply due to a fall in its price whereas a decrease in supply of a commodity means a fall in supply at the same price.
Q.9. Distinguish between ‘shift in supply curve’ and ‘movement along the supply curve’.
Ans. In the situations of increase and decrease in supply there is a shift in the supply curve upwards or downwards as a case may be. The shift is upward towards the left in the case of decrease in supply and downward to the right in the case of increase in supply. In the cases of expansion and contraction of supply there is movement on the same supply curve upwards in the case of extension and downward in the case of contraction.
(a) Movement along supply curve
(b) Shift in supply curve
Q.10. Distinguish between change in quantity supplied and change in supply.
Ans. A change in supply and a change in quantity supplied are different things. The first is shown graphically as a movement of a supply curve while the second is shown as a movement along a curve. The first is caused by changes in costs and incentives that change how much a producer can and will produce at a given price. The second is caused simply by a change in the retail price of the product. A change in quantity supplied happens when the retail price of the good or service changes. For example, if I am selling jeans for ₹ 35 per pair and all of a sudden.jeans are seen as a fashionable item, people will want more of them. Demand will change, raising the price of jeans to, say, ₹ 40. At that point, I will produce more jeans because the law of supply says that, all other things being equal, producers will be willing and able to sell more of their product as me price of that product rises. I am not willing to produce more jeans at ₹ 35 per pair; that would be a change in supply. Instead, the price went up to ₹ 40 causing me to produce.more jeans, but at a different price. So, change in supply make produces able and milling to sell more to given price.
TERMINAL EXERCISE
Q.1. What is meant by the term ‘supply’?
Ans. Supply of a commodity by a seller (called a firm) is the quantity of the commodity that he is willing to supply at a given price during a time period.
The definition of supply must include:
(i) the quantity of the commodity that a firm is willing to supply.
(ii) the price at which it is willing to supply that quantity. and
(iii) the time period during which it is willing to supply that quantity.
Q.2. Explain briefly the various factors which influence the supply of a commodity.
Ans. Following are the main factors influencing supply:
(i) Goal of the firm: The main objective of the firm may be to maximise profits or to maximise sales. If the objectives is to maximise sales, more of the quantity may be supplied even at lower price.
(ii) Price of the commodity: Supply rises with a rise in price and falls with a fall in price.
(iii) Price of the factors of production: Cheaper availability of the factors of production facilitates larger supply even at the reduced price.
(iv) Price of the related goods: Related goods may be
(a) substitutes. and
(b) complementaries.
If the price of goods rises, the supply of substitute goods increases. Likewise, if the price of complementary goods increases, their supply may fall.
(v) State of technology: If the state of technology improves, there is a shift in production functions. Accordingly, more of the commodity is supplied even at the same price.
Q.3. Explain how the price of a commodity influences its supply.
Ans. Other things remaining the same, a rise in the price of a commodity provide an incentive to its seller to sell more of it as it fetches more profits and a fall in the price is a disincentive to the seller as his profits fall. So when price of a commodity rises its quantity supplied rises and when the price of a commodity falls its quantity supplied falls. Thus there is a direct relationship between the price of a commodity and its quantity supplied.
Q.4. Explain the law of supply and point out the main assumptions behind the law.
Ans. Law of Supply: The direct relationship between the price of a commodity and its supply is stated in the form of a law the law of supply. The law of supply states that other things remaining the same, there is a direct relationship between the price of a commodity and its quantity supplied in the market.
The market supply curve is a diagrammatic representation of the law of supply.
This can be explained with the help of following supply schedule and diagram:
Supply Schedule
| Px (Rs.) | Sx (Units) |
| 1 | 2 |
| 2 | 7 |
| 3 | 11 |
| 4 | 14 |
| 5 | 16 |

Assumptions behind the law: In the law of supply we use the phrase ‘other things remaining the same’ which indicates the assumptions of law. Main assumptions are as follows:
(i) No change in price of other goods.
(ii) No change in prices of factors of production.
(ii) No change in the production technology.
(iv) No change in the goal of producers.
Q.5. Distinguish between market supply schedule and market supply curve.
Ans. Market Supply Schedule: Market supply is the total supply in the market of a commodity at a given price and in a given period of time. It is found by adding the supply by each seller of the commodity at a given price in a given period of time. Suppose there are only two firms A and B, selling pens in the market. The supply schedule of these two firms and the market supply schedule are given below in table.
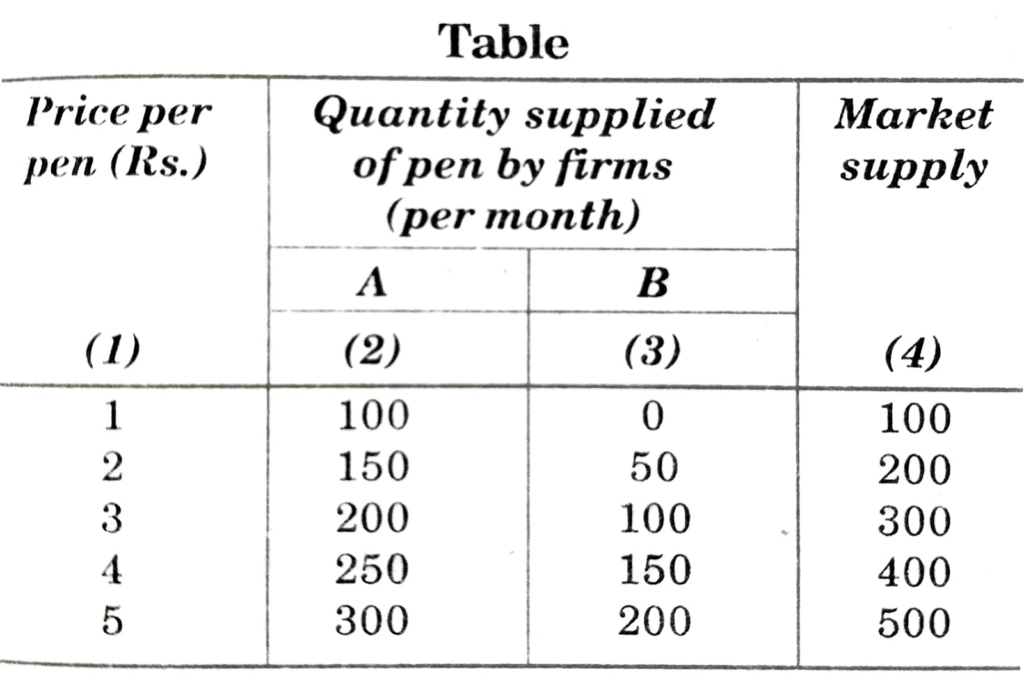
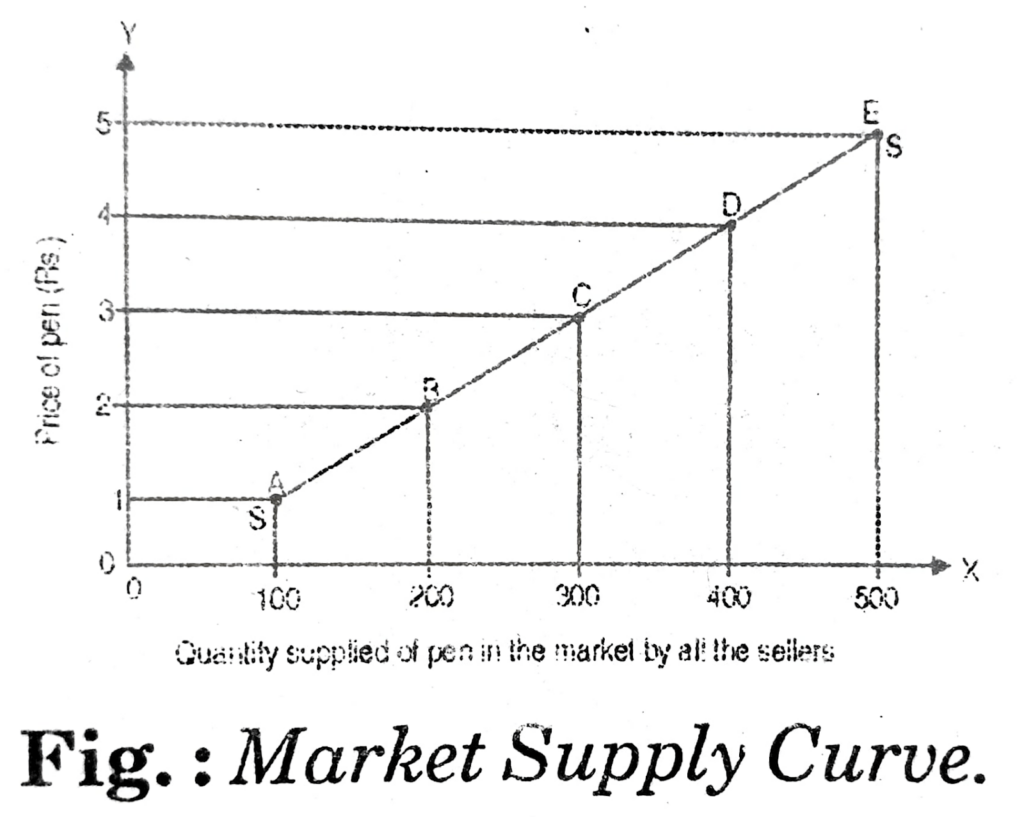
By adding the quantities of pen supplied by these two firms at each price, we get the market supply at each price. It is shown in column 4 of the table. At a price of Re. 1 per pen, the quantity supplied by firms A and B is 100 pens and 0 pens per month respec-tively. As in the market there are only these two sellers of pens, the total market supply is 100 pens per month (100 + 0) at a price of Re. 1 per pen. Similarly we find the market supply at all other prices by adding the quantities supplied by firms A and B at each price.
Market Supply Curve: If we plot the market supply schedule as given in table 15.1, we get a market supply curve. The horizontal summation of individual supply curve is known as market supply curve.

Hi! my Name is Parimal Roy. I have completed my Bachelor’s degree in Philosophy (B.A.) from Silapathar General College. Currently, I am working as an HR Manager at Dev Library. It is a website that provides study materials for students from Class 3 to 12, including SCERT and NCERT notes. It also offers resources for BA, B.Com, B.Sc, and Computer Science, along with postgraduate notes. Besides study materials, the website has novels, eBooks, health and finance articles, biographies, quotes, and more.


Adha Adhura kyo post kiye ho