NIOS Class 10 Economics Chapter 17 Collection and Presentation of Data Solutions to each chapter is provided in the list so that you can easily browse through different chapters NIOS Class 10 Economics Chapter 17 Collection and Presentation of Data and select need one. NIOS Class 10 Economics Chapter 17 Collection and Presentation of Data Question Answers Download PDF. NIOS Study Material of Class 10 Economics Notes Paper 214.
NIOS Class 10 Economics Chapter 17 Collection and Presentation of Data
Also, you can read the NIOS book online in these sections Solutions by Expert Teachers as per National Institute of Open Schooling (NIOS) Book guidelines. These solutions are part of NIOS All Subject Solutions. Here we have given NIOS Class 10 Economics Chapter 17 Collection and Presentation of Data, NIOS Secondary Course Economics Solutions for All Chapters, You can practice these here.
Collection and Presentation of Data
Chapter: 17
MODULE 6: PRESENTATION AND ANALYSIS OF DATA IN ECONOMICS
TEXTBOOK QUESTIONS (SOLVED)
INTEXT QUESTIONS 17.1
Identify whether following are data or not. Write yes/no in the brackets.
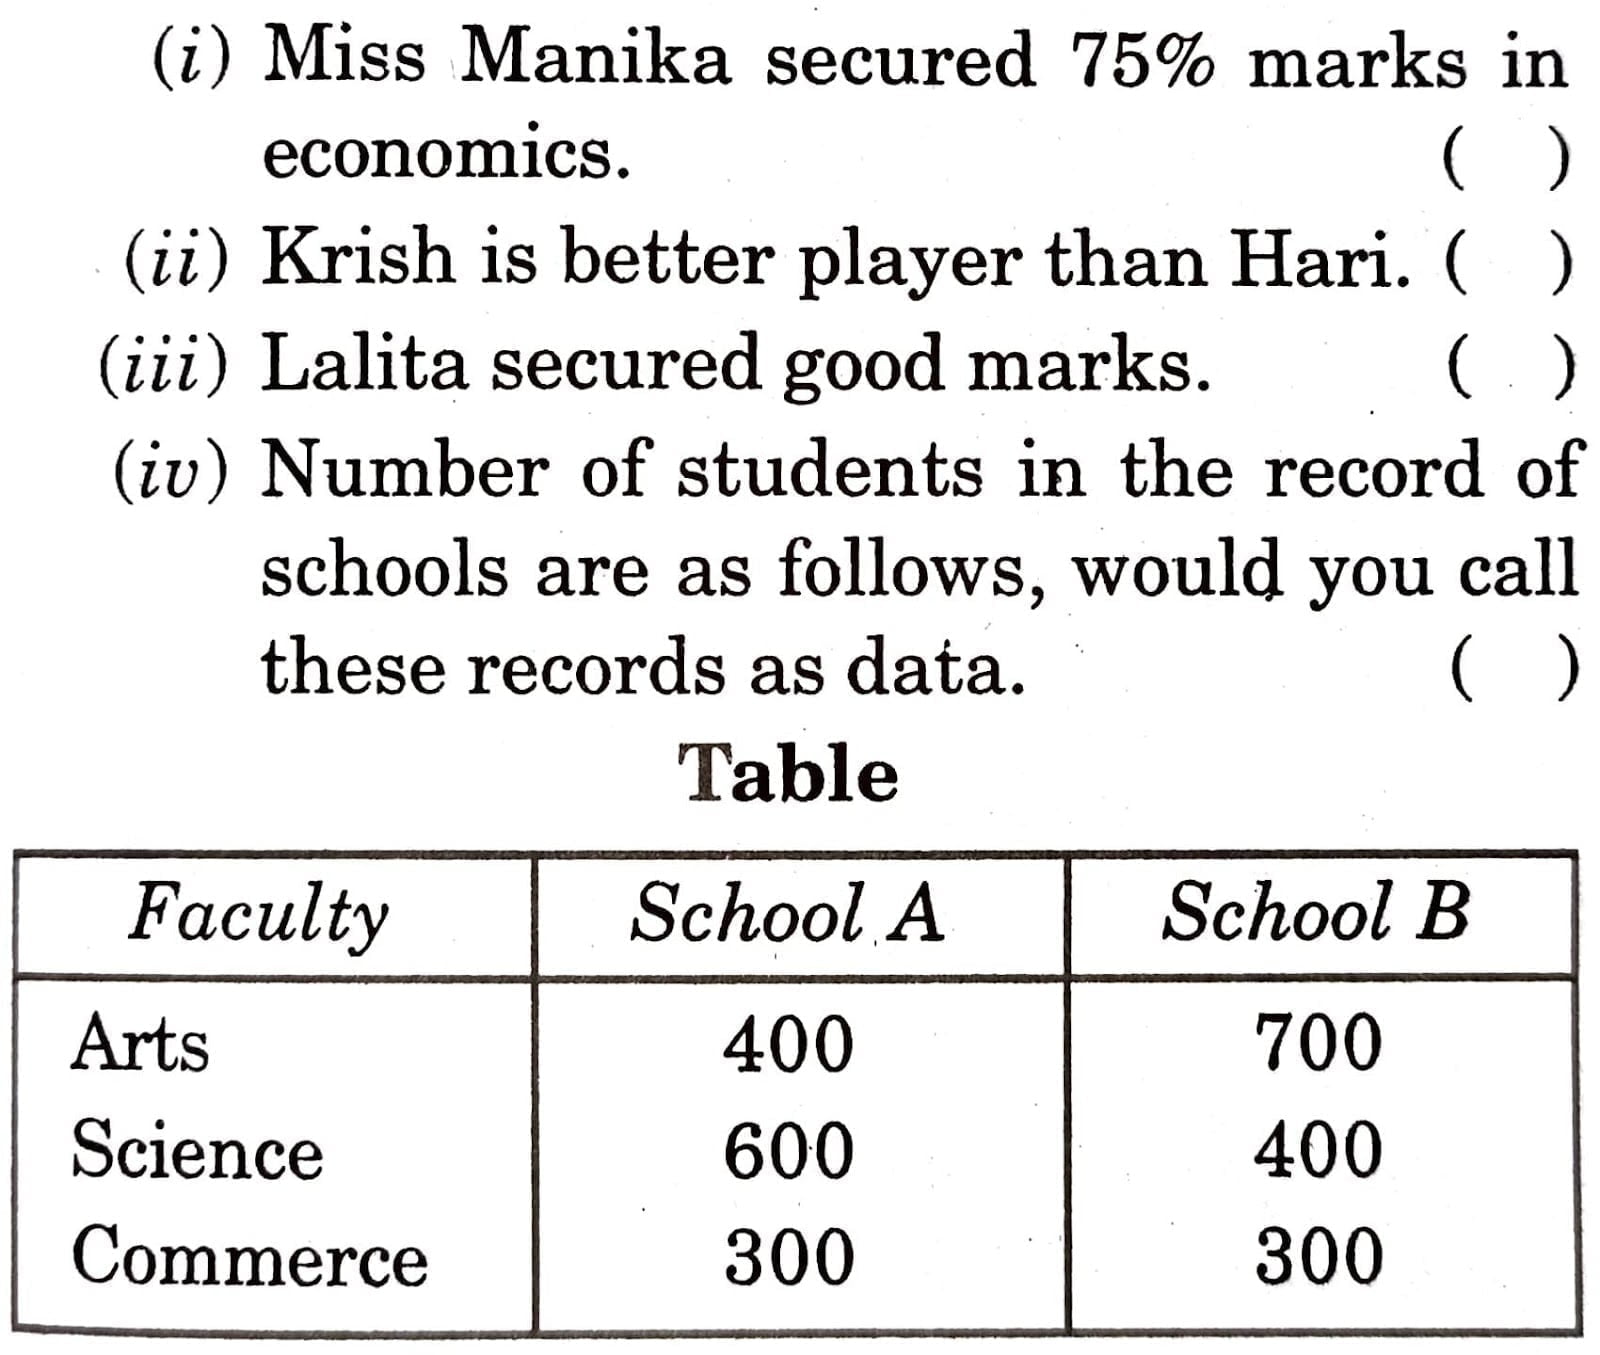
Ans. (i) No, (ii) No, (iii) No, (iv) Yes
INTEXT QUESTION 17.2
Identify whether the following items are variable or attributes:
(i) Height of a student.
(ii) Beauty of a girl.
(iii) Intelligence level of a boy.
(iv) Mileage of a car.
(v) Weight of Mr. X.
Ans. (i) Variable.
(ii) Attribute.
(iii) Attribute.
(iv) Variable.
(v) Variable.
TERMINAL EXERCISE
Q.1. Define data.
Ans. Data may be defined as any quantitative information about income, population, price etc.
Q.2. What is the difference between Primary Data and Secondary Data?
Ans.
| Points of Difference | Primary Data | Secondary Data |
| 1. Originality | These are original. | These are collected by original investigator but if used by others become secondary. |
| 2. Accuracy | These are accurate. | These may not be as accurate as may be required. |
| 3. Need of modification | No need, as they are suitable. Since these are collected according to the need and objectives. | Yes, there is a need of modification as these may have to be adjusted so as to suit the requirement of the enquiry. |
| 4. Precaution | No precaution. | Precaution is necessary as this has been collected by someone else. |
| 5. Cost | Costlier | Less costlier. |
Q.3. Distinguish between variable and an attribute.
Ans. A variable is a quantitative information whereas an attribute is a qualitative information such as good, bad, average, handsome, ugly etc.
Q.4. Explain classification.
Ans. Classification: Classification is a process of arranging data into classes or groups according to their resemblance and affinities.
Q.5. Explain the following methods of representation of data:
(a) Tabulation.
(b) Diagram.
Ans. (a) Tabulation: Tabulation means putting the collected and classified data into rows and columns in a table. A statistical table may be a simple one, depending upon number of variable incorporated into it.
(b) Diagram: Diagrammatic presentation is a geometrical version of data. Diagrams present the facts in such a manner that just by glancing at them one can understand the most complex data. Diagrams may be one- dimensional or two-dimensional and even three-dimensional.
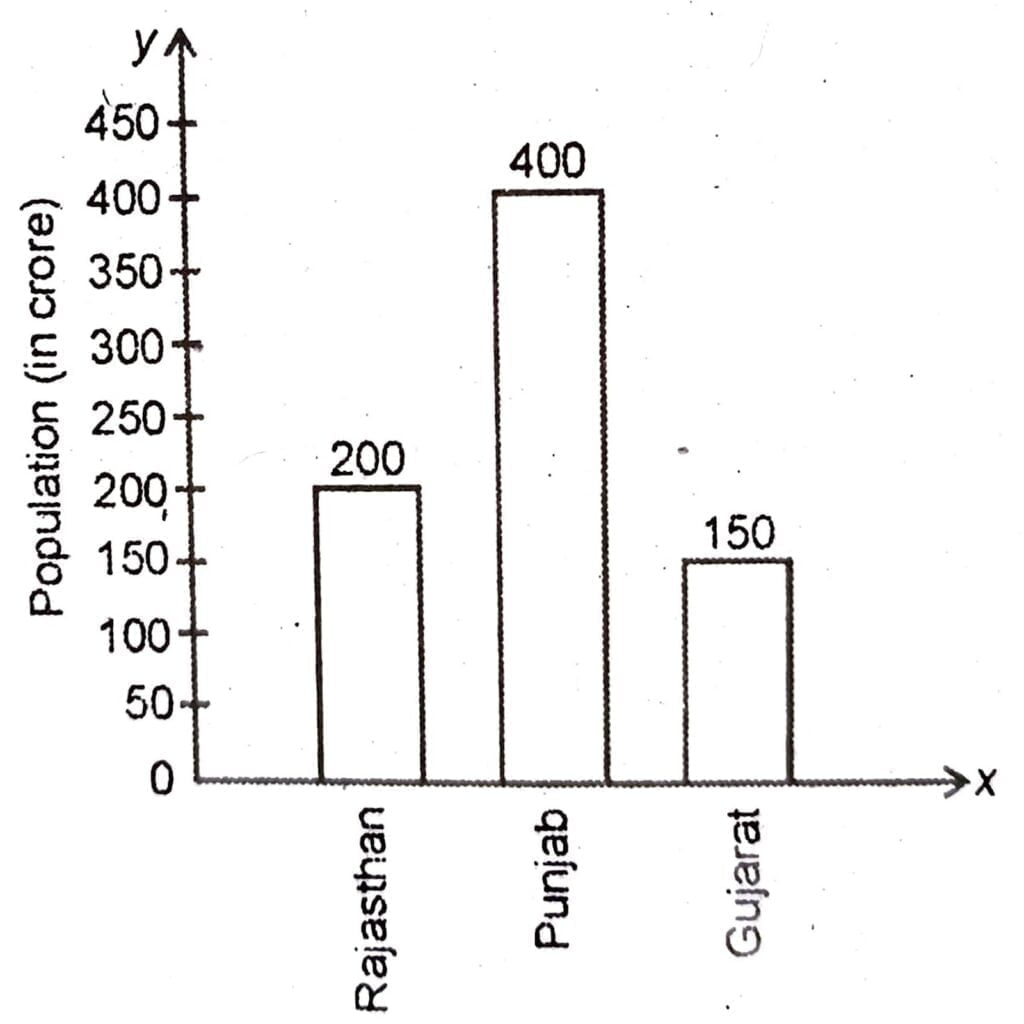
Q.6. Construct a simple bar diagram from the following data:
| State | Number of Management Colleges |
| Rajasthan | 200 |
| Punjab | 400 |
| Gujarat | 150 |
Ans.
SOME IMPORTANT QUESTIONS FOR EXAMINATIONS
VERY SHORT ANSWER TYPE QUESTIONS
Q.1. What is the nature of information?
Ans. Information is both qualitative and quantitative in nature.
Q.2. Give any three examples of information which are qualitative in nature.
Ans. (i) Good.
(ii) Bad and
(iii) Ugly.
Q.3. Give any three examples of information which are quantitative in nature.
Ans. (i) Income.
(ii) Expenditure. and
(iii) Saving.
Q.4. Which type of informations are mostly used for economies in economics?
Ans. Quantitative information.
Q.5. What does data mean?
Ans. Data means quantitative information providing facts in an aggregate manner.
Q.6. State the features of data.
Ans. (i) Statistics are aggregate of facts.
(ii) They are numerically expressed.
(iii) They have reasonable standard of accuracy.
(iv) They are collected for pre-determined purpose.
Q.7. State any three points of the importance of Economics.
Ans. (i) Economic planning.
(ii) Determination of national income.
(iii) Basis of government policies.
Q.8. Classify data on the basis of source of collection.
Ans. (i) Primary Data.
(ii) Secondary Data.
Q.9. What are primary data?
Ans. Primary data are original data which are collected by the investigator himself.
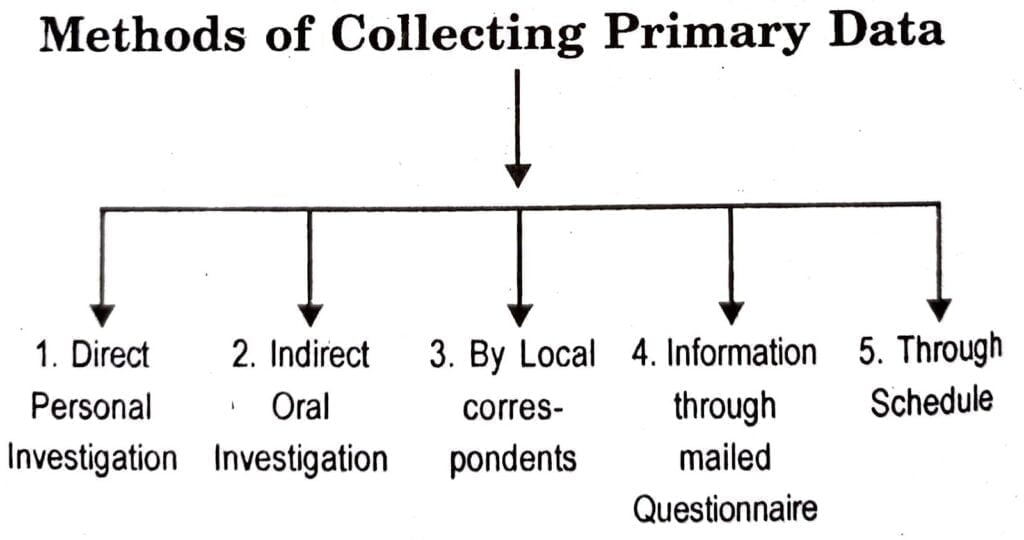
Q.10. Write down the methods of collecting primary data.
Ans.
Q.11. What are secondary data?
Ans. Secondary data are those which have already been collected and which are obtained by the investigator from someone else records.
Q.12. There are many sources of secondary data. Write any two of them.
Ans. (i) Bank of India.
(ii) Report of Finance Commission.
Q.13. What is classification?
Ans. Classification is a process of arranging data into classes or groups according to their resemblance and affinities.
Q.14. What are variables?
Ans. Variables are those data which are capable of being classified in the magnitude of time or size.
Q.15. Give any four examples of variables.
Ans. (i) Height.
(ii) Weight.
(iii) Length.
(iv) Distance.
Q.16. Name the various types of variables.
Ans. (i) Discrete Variables.
(ii) Continuous Variables.
Q.17. What are attributes?
Ans. Attributes are those data which cannot be classified in the magnitude of time or size.
Q.18. Give any four examples of attributes.
Ans. (i) Beauty.
(ii) Bravery.
(iii) Ability.
(iv) Laziness.
Q.19. Write down the various types of statistical series.
Ans. (i) Individual series.
(ii) Discrete series. and
(iii) Continuous series.
Q.20. What is an individual series?
Ans. An individual series is that series in which items are shown individually with their respective value. Each item has its separate and individual existence.
Q.21. What are raw data?
Ans. Mass data in their original firms are called raw data. They are also known as unorganised data.
Q.22. What is array?
Ans. The presentation of individual series either in ascending order or in descending order is known as array.
Q.23. What do you mean by discrete series?
Ans. Discrete series means that series which shows variables with definite break with their respective frequencies.
Q.24. What do you mean by frequency?
Ans. Frequency means the repetitiveness of a value of an item. If a particular value is 4 times in a set data, then that item will have a frequency of 4.
Q.25. What do you mean by continuous series?
Ans. Continuous series is that series in which the values along with their frequencies are shown in a continuous manner.
It is of two types-
(i) Inclusive Series. and
(ii) Exclusive Series.
Q.26. What is the direct personal investigation as the method of collecting primary data?
Ans. Direct personal investigation as the method of collecting primary data is that method in which the investigator collects the information personally from the respondent.
Q.27. Who is investigator?
Ans. Investigator is that person who collects the information.
Q. 28. Who is a respondent?
Ans. A respondent is that person who gives responses/answers the questions asked by the investigator.
Q.29. Write down any two limitations of Direct Personal Investigation as the method of collecting primary data.
Ans. (i) This method is more time-consuming.
(ii) This method is very expensive.
Q.30. Under which method of collecting primary data, questionnaire is mailed to the respondent?
Ans. Mailed Questionnaire Method.
Q.31. Write down any two limitations of collecting information through mailed questionnaire.
Ans. (i) This method is not suitable for illiterate respondent.
(ii) The data received by this method are not reliable.
Q.32. Write the advantages of collecting information through mailed questionnaire.
Ans. (i) The method is less expensive.
(ii) It saves time.
Q.33. An investigator collected data (information) from the respondent by direct personal investigation. Which type of data they will be called _________ (Primary or secondary)?
Ans. Primary data.
Q.34. Which type of data we get the estimation of national income and population census?
Ans. Primary data.
Q.35. Railway department has published data on its progress. Which type of data they will be for an investigator (Primary/Secondary).
Ans. Secondary.
Q.36. What is a schedule?
Ans. A schedule is a set of questions (Questionnaire) relating to investigation which is filled up by the enumerator after asking questions from the informants.
Q.37. Out of primary data and secondary data, which are original?
Ans. Primary data.
Q.38. Write down the following in ascending order:
17, 8, 14, 5, 4, 2, 25
Ans. Data in ascending Order: 2, 4, 5, 8, 14, 17, 25.
Q.39. Write down the following data in descending order:
13, 22, 15, 32
Ans. 32, 22, 15 and 13.
Q.40. Below is given a picture of a shopkeeper. State whether the goods lying in his shop are organised or unorganised.
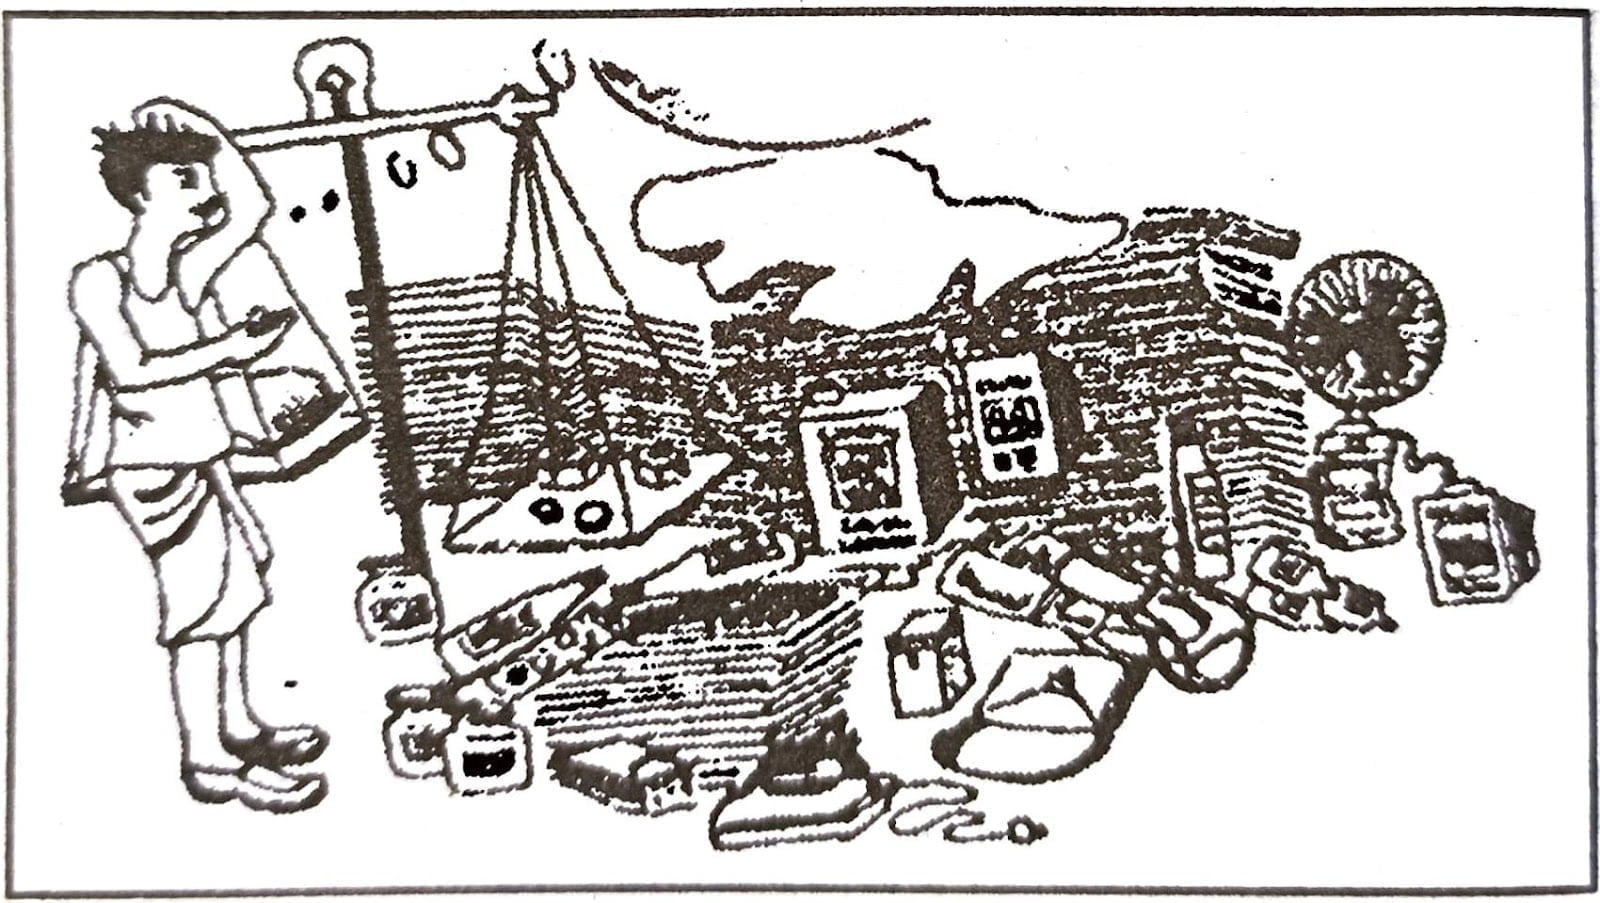
Ans. They are unorganised.
Q.41. Look at the pictures given below carefully. Name the picture in which books are organised.
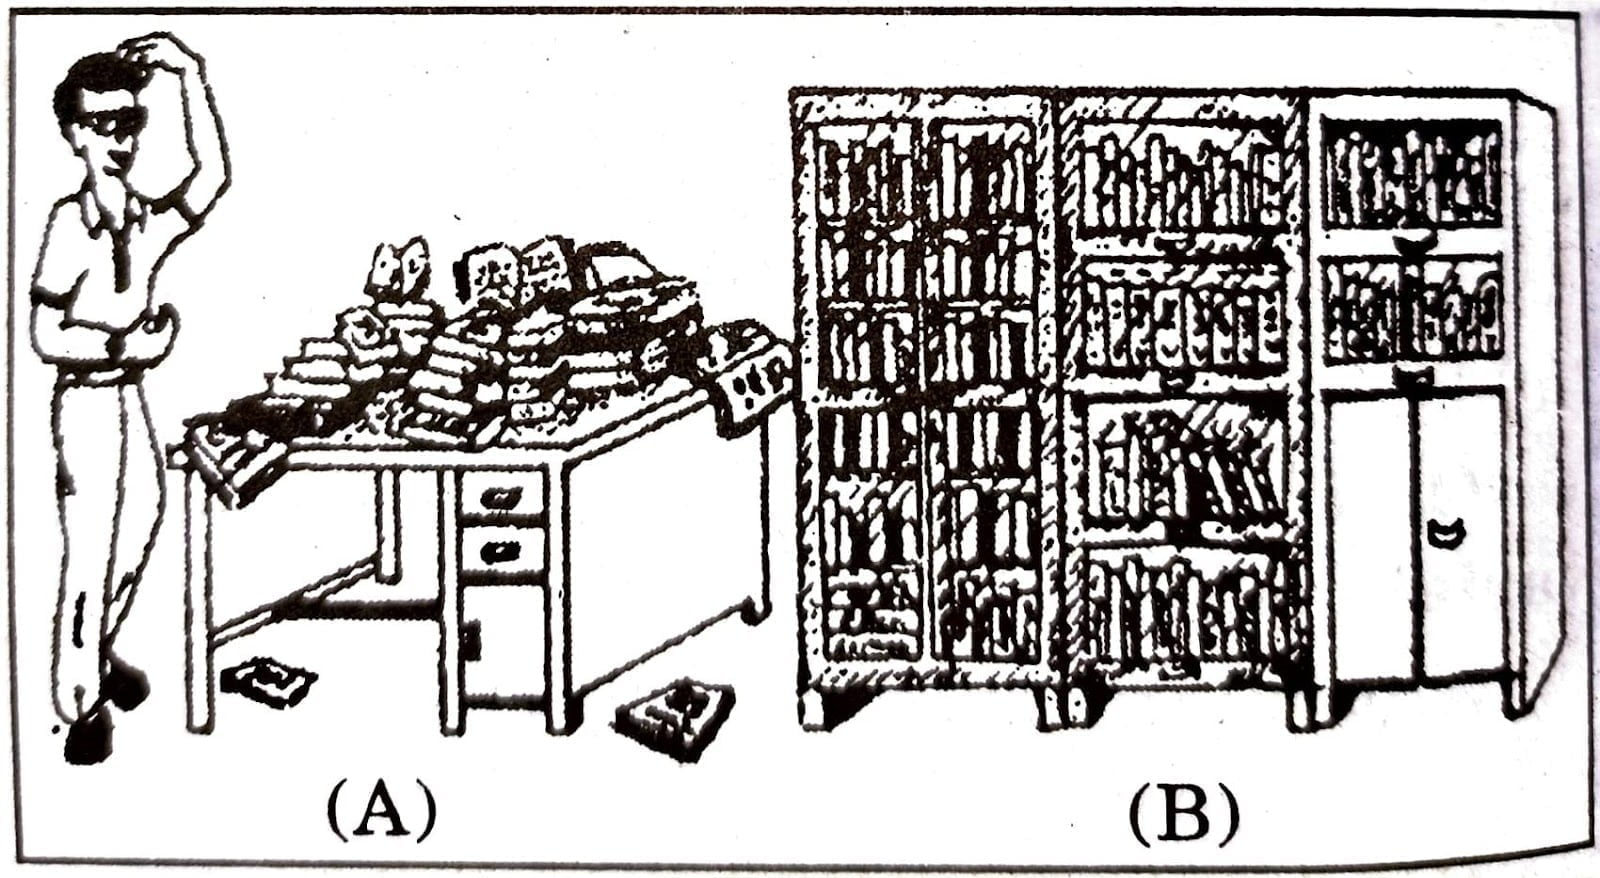
Ans. Books are organised in picture (B).
Q.42. Write down the main objective of classification of data.
Ans. The main objective of classifying of data is to make the data simple, brief and organised.
Q.43. Study the following table. Tell the number of families who have no children.
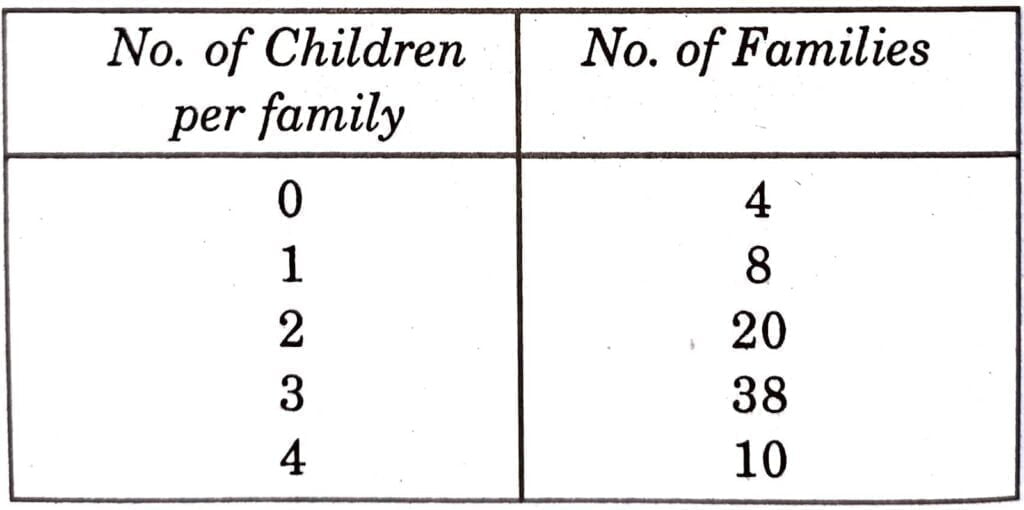
Ans. Four families have no children.
Q.44. State whether following data are organised or raw data? Why?
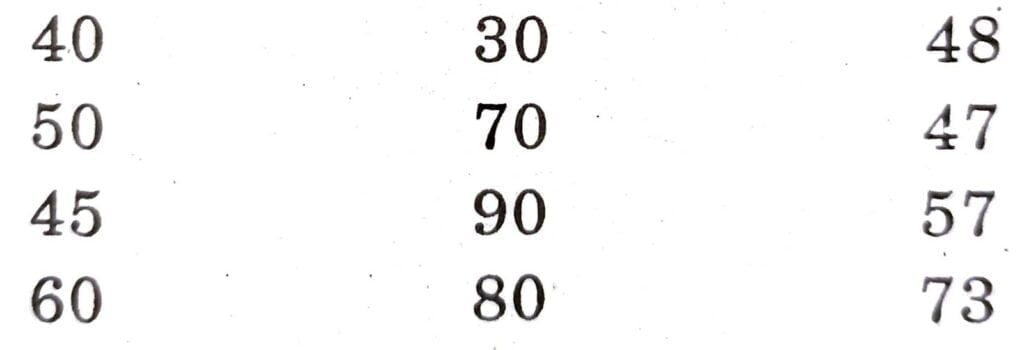
Ans. They are raw data because they are not organised.
Q.45. Study the following table and state the number of students who secured 70 marks:
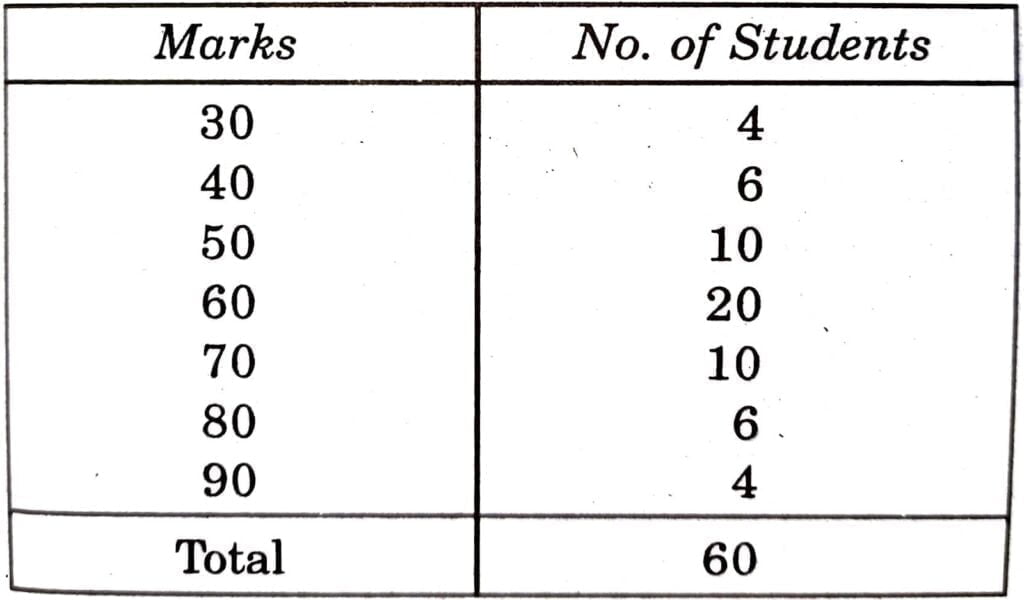
Ans. Ten students secured 70 marks.
Q.46. What do you mean by exclusive series?
Ans. Exclusive series means that series in which the upper limit of one class-interval is the lower limit of the next class-interval.
Q.47. What is an inclusive series?
Ans. An inclusive series is that series in which both the lower limit and upper limit of class-interval are included in the class. In other words the upper limit of one class- interval is not equal to the lower limit of its next class-interval.
Q.48. Out of the following two series A and B, which series is exclusive series:
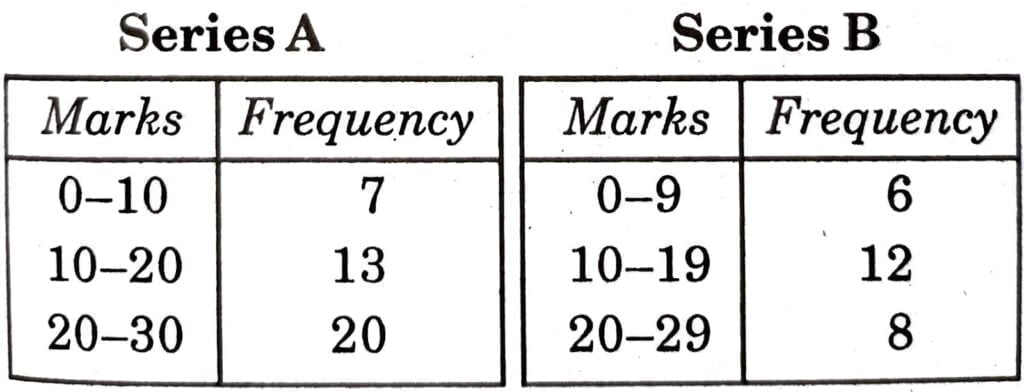
Ans. Series A is an exclusive series.
Q.49. Name the type of data which are raw and original.
Ans. Primary data.
Q.50. Name that type of data which do not require enumerators for collecting them.
Ans. Secondary Data.
Q.51. Name that type of data which requires a lot of time and money to collect them.
Ans. Primary data.
Q.52. With the help of the following diagram, find out the number of students in a school in 2012.
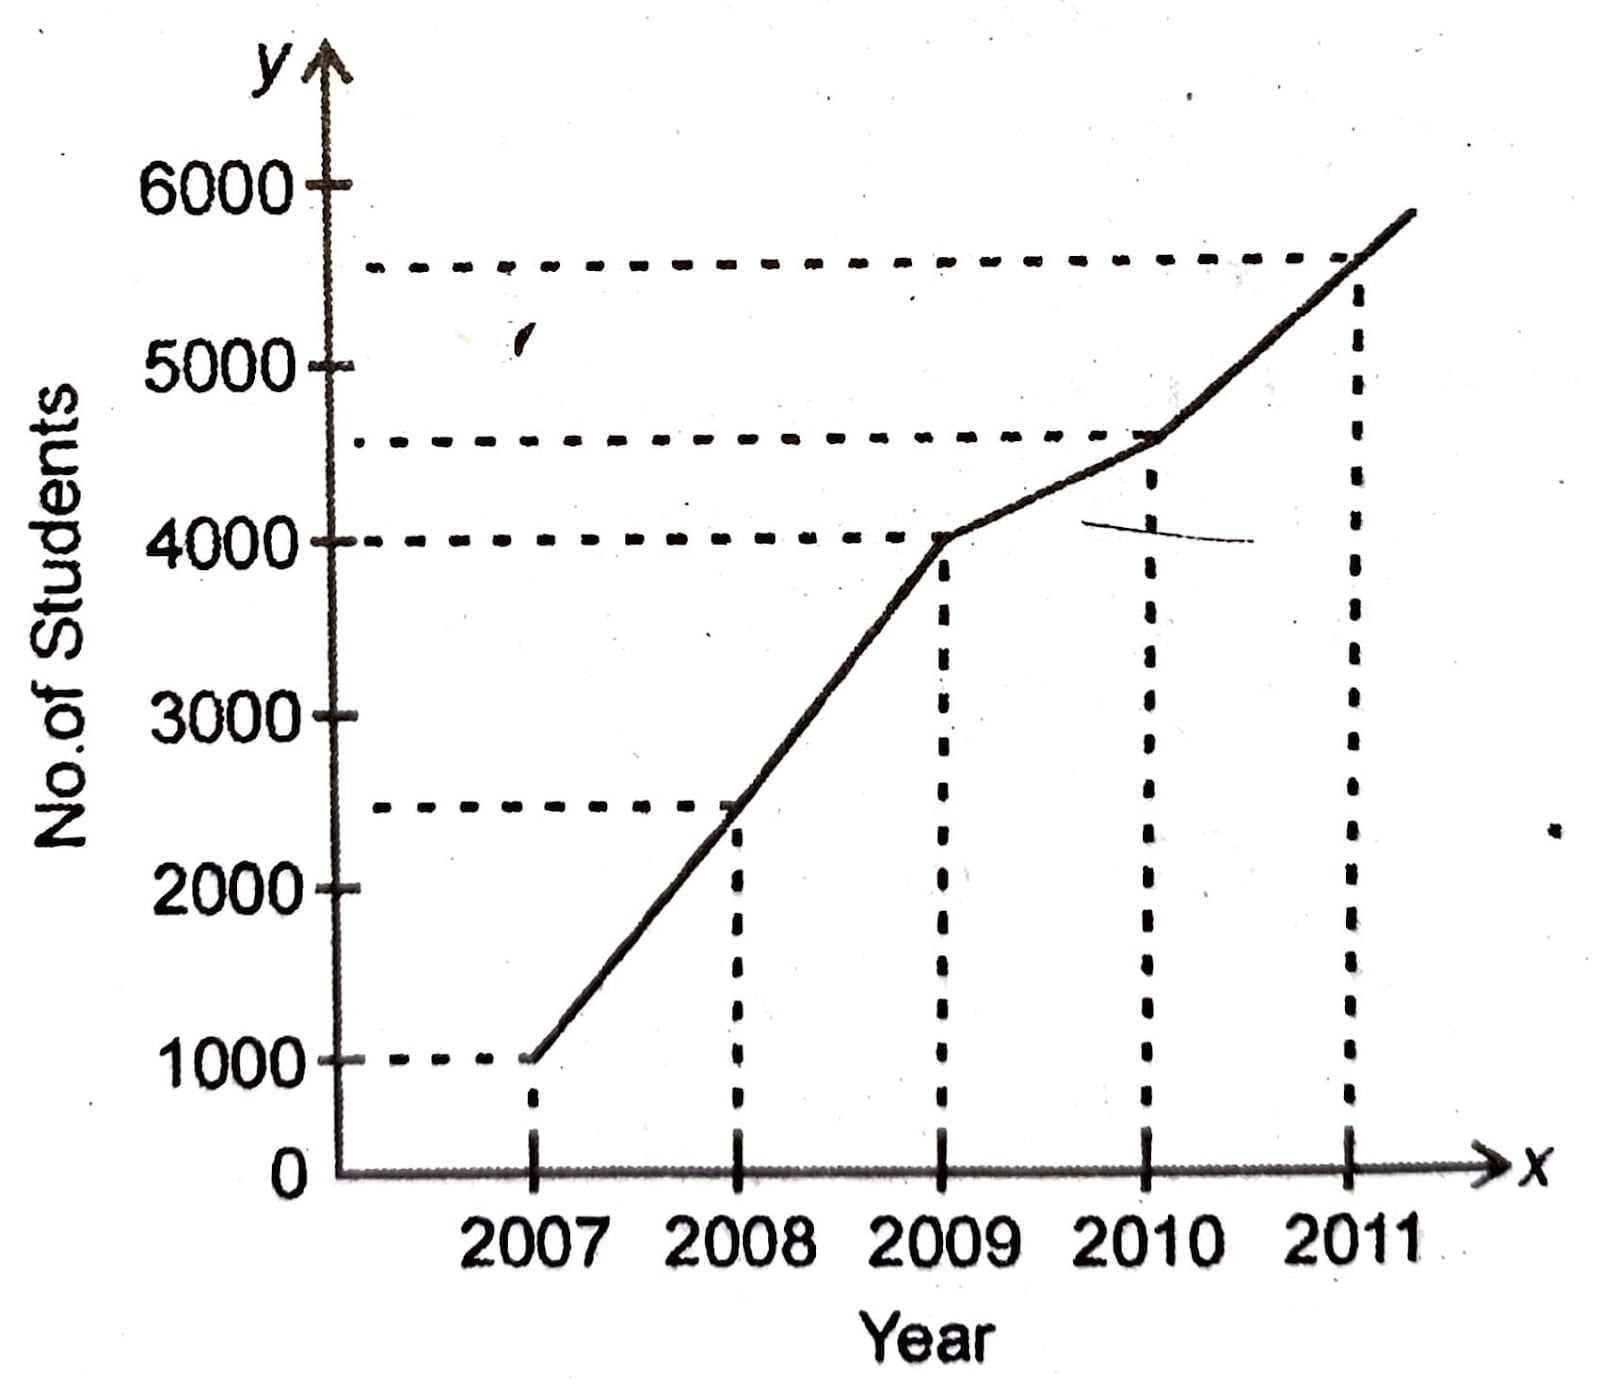
Ans. The number of students in 2010 was 3000.
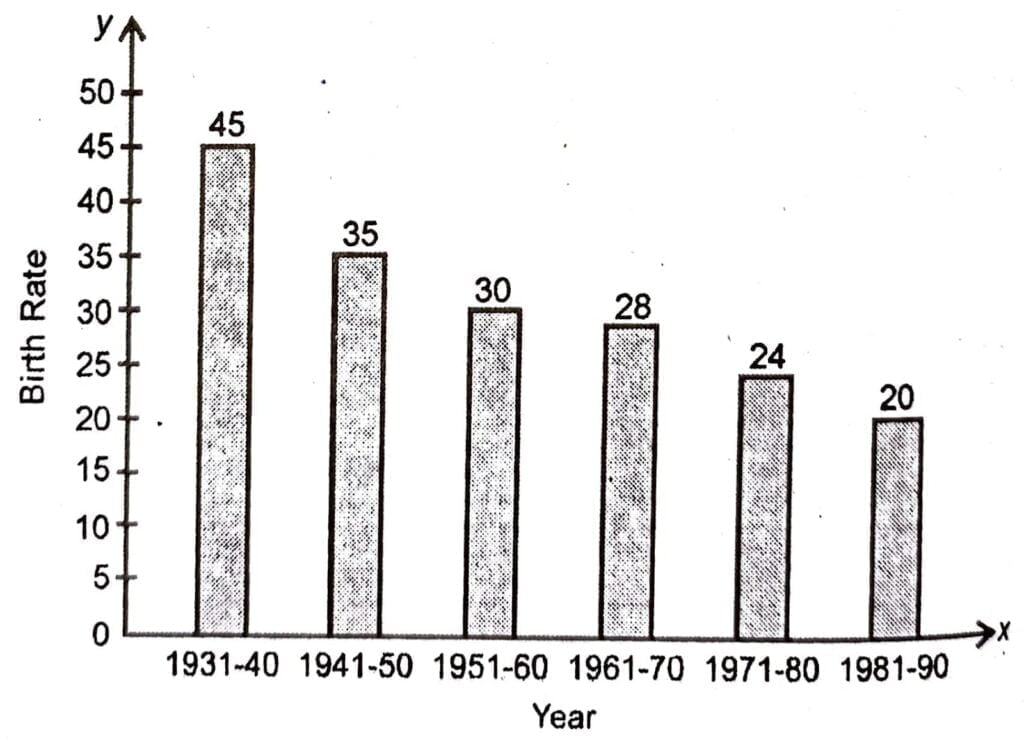
Q.53. Study the following diagrams and find out the birth rate in 1961-70:
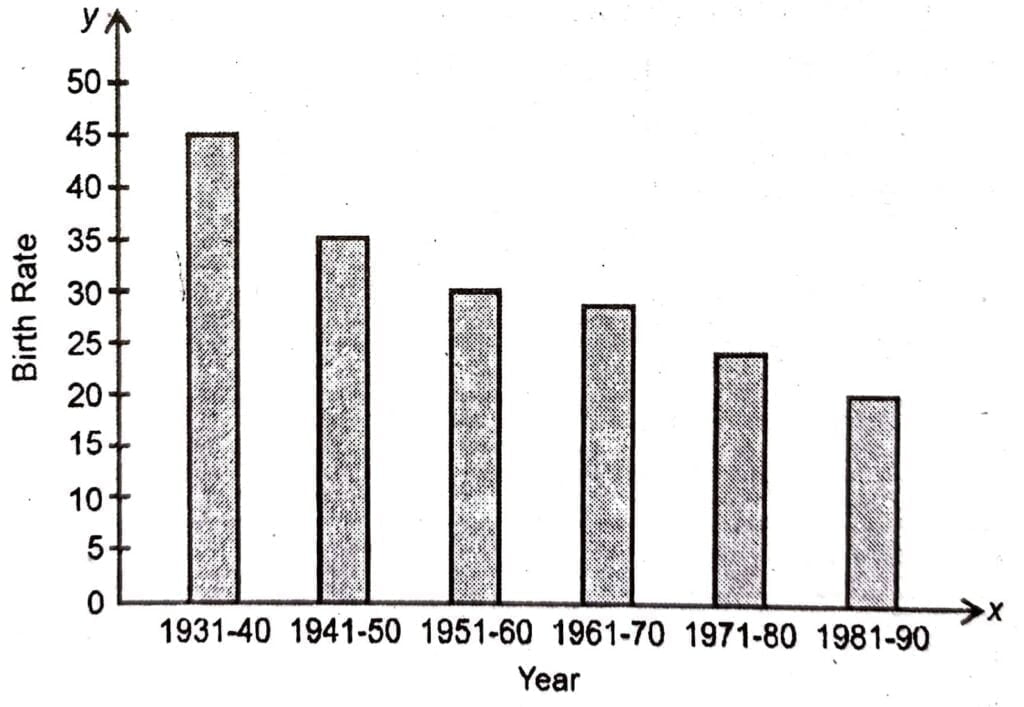
Ans. In 1961-70, the birth rate was 28.
Q.54. What are simple bar diagrams?
Ans. Simple bar diagrams are those bar diagrams in which one bar diagrams representing only one figure and as there will be as many as the number of figures. Bars in these diagrams are of the same breadth.
Q.55. What is the meaning of diagrammatic presentation of data?
Ans. It is a geometrical version of data.
Q.56. State one advantage of diagrammatic presentation of data.
Ans. With the help of diagrams the most complex data become simple and understand- able.
Q.57. What do you mean by graphical presentation of data?
Ans. By graphical presentation of data, we mean the presentation of all statistical data on graph-paper in the form of lines or curves.
Q.58. Give one advantage of graphic presentation of data.
Ans. Graphs represents the complex and unorganised data in a simpler or understandable form.
Q.59. Give one point of difference between table and diagram.
Ans. Tables are not attractive and effective while diagrams are more attractive and effective.
Q.60. What is a time series?
Ans. Time series is that graph which shows the values of a variable at different points of time.
Q.61. In case of time-series graph, which axis represents time?
Ans. In case of time-series graph, X-axis represents time.
Q.62. In case of time series graph, which axis representation variable?
Ans. In case of time series graph, y-axis representations variables.
Q.63. Should the scale for each axis to accommodate the complete data given be same?
Ans. No, they may be different.
Q.64. How many dimensions does a simple bar-diagram have?
Ans. A simple bar-diagram has only one dimension.
Q.65. Out of height and width, which is relevant in bar-diagrams.
Ans. In bar diagrams only height of the is relevant.
Q.66. Write down any three types of diagrams.
Ans. (i) One-dimensional diagram.
(ii) Two-dimensional diagrams. and
(iii) Three- dimensional diagrams.
Q.67. Name any three types of bar-diagrams.
Ans. (i) Simple bar diagram.
(ii) Multi bar diagram.
(iii) Sub-divided bar diagram.
Q.68. Give one point of difference between classification and tabulation.
Ans. Classification is a process of statistical analysis whereas tabulation is the process of presentation of statistical data in rows and columns.
Q. 69. Name the two types of table.
Ans. (i) Simple Table.
(ii) Complex Table.
SHORT ANSWER TYPE QUESTIONS
Q.1. Study the table and answer the following questions:
(a) How many students secured marks above 90?
(b) How many students secured marks below 40?

Ans. (a) Only two students (Mohan and Joginder) secured marks above 90.
(b) Only two students (Kamal and Mahesh) secured marks below 40.
Q.2. Explain any two features of statistics.
Ans. Two Features of Statistics: Statistics have many features. Two of them have been explained below:
(i) Aggregates of facts: Statistics are aggregate of factors. A single and unconnected figures not statistics. For example, 25 is not statistics. But when it is said that Ram, Shyam, Mohan and Gopal of the same school and of the same class have 30, 35, 45 and Rs. 50 in their respective pockets on a particular day, then it is statistics, because it represents aggregates of facts.
(ii) Numerically expressed: Qualitative expression is not statistics. There should be quantitative expression. All statistics are numerically expressed. Qualitative expressions like good, bad, young, old etc. do not constitute statistics.
Q.3. Explain the following features of statistics?
(i) Reasonable standards of accuracy.
(ii) Affected to a marked extent by multiplicity of causes.
(iii) Predetermined purposes.
Ans. (i) Reasonable standard of accuracy: Statistical data must be reasonable and accurate. Cent per cent accuracy in statistics is neither possible nor desirable. What is needed and expected is only a reasonable standard of accuracy.
(ii) Affected to a marked extent by multiplicity of causes: Data are not influenced by a single factor, but are influenced by many factors. For example, rise in prices of commodities may have been due to several causes like reduction in supply, increase in demand, rise in taxes, rise in wages etc.
(iii) Predetermined purposes: Before collecting the data, the purpose of their collection should be decided in advance. Data collected without the determination of purpose will be confusing, irrelevant and will be of no use.
Q.4. Differentiate between individual series, discrete series and continuous series.
Ans. Difference between Individual, Discrete and Continuous Series:

Q.5. Write down the following raw data in descending order: Raw Data:

Ans.

Q.6. Arrange the following data in ascending order:
Raw Data

Ans. Data arranged in ascending order:

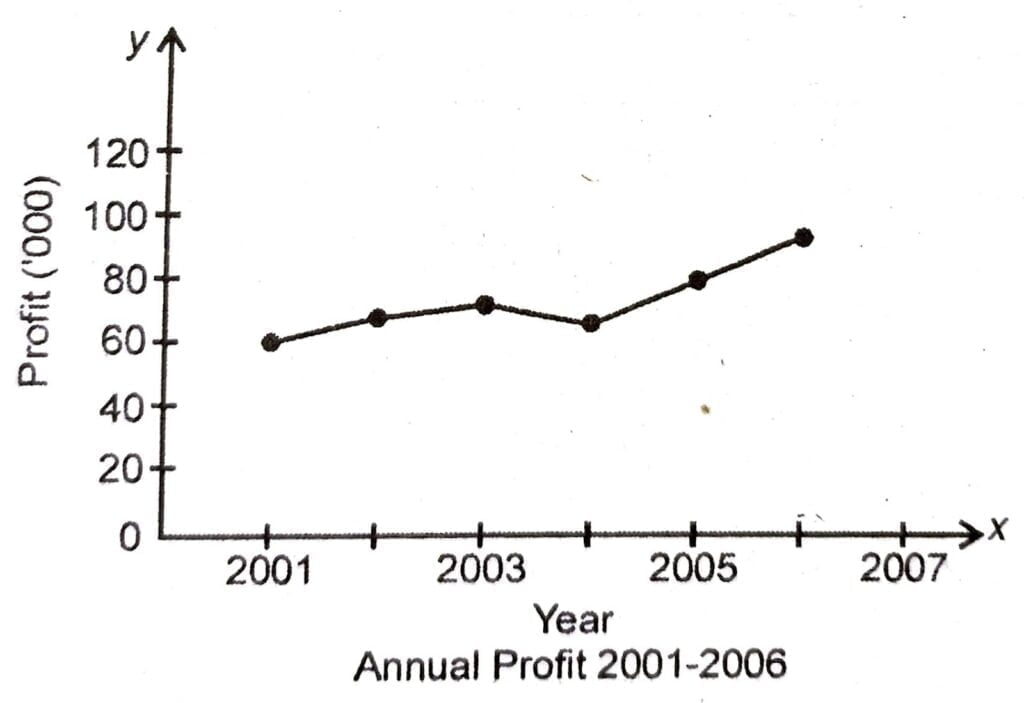
Q.7. Plot the following data of annual profits of a firm on a time series graph:
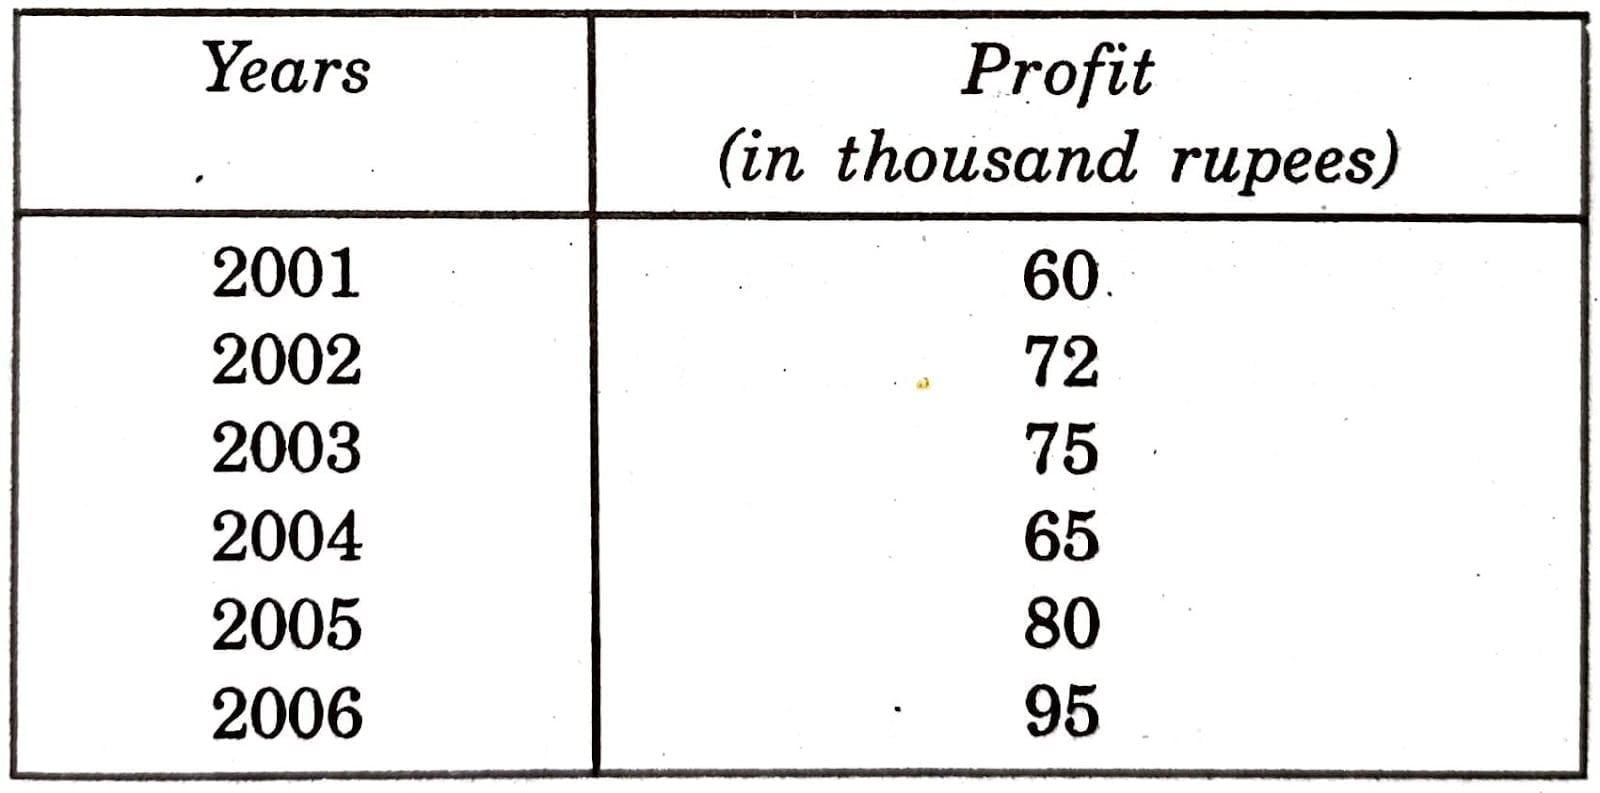
Ans. The above data may be presented as illustrated below:
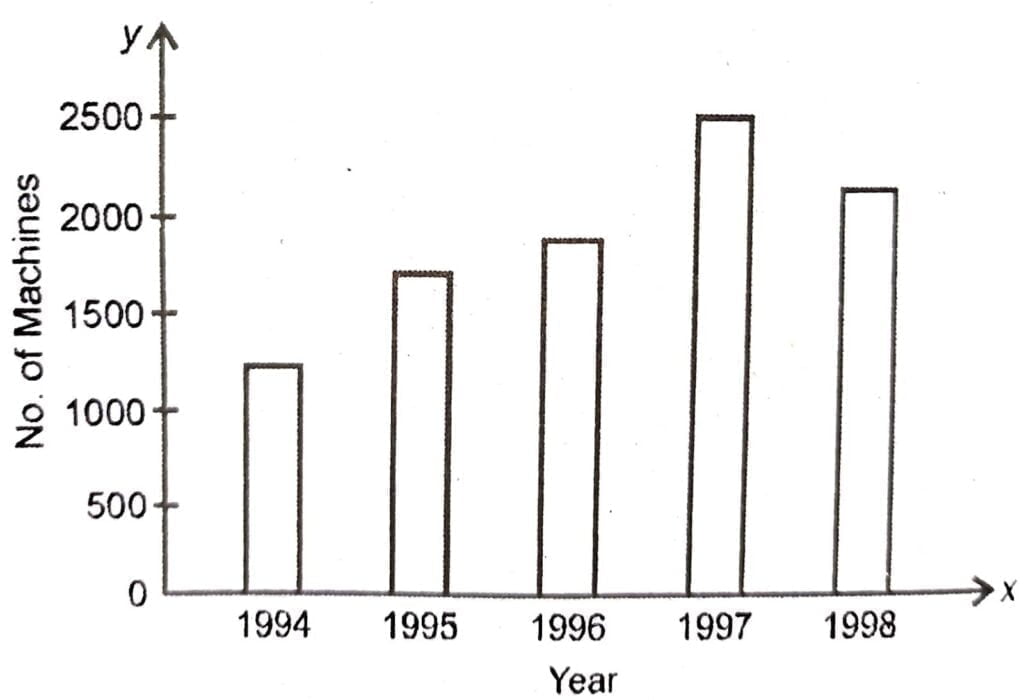
Q.8. Present the following data in a simple bar diagram:
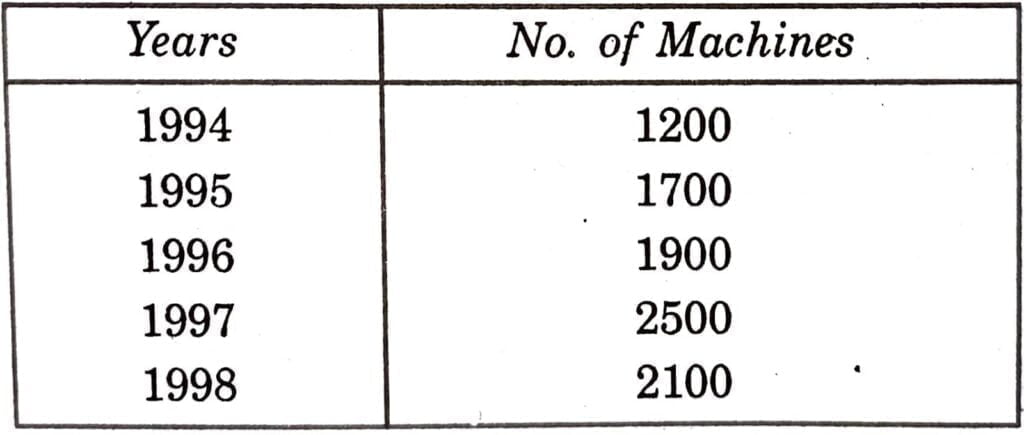
Ans.
Q.9. The following table gives data on birth rate of India, according to census survey of different years. Present this information in a simple bar diagram.
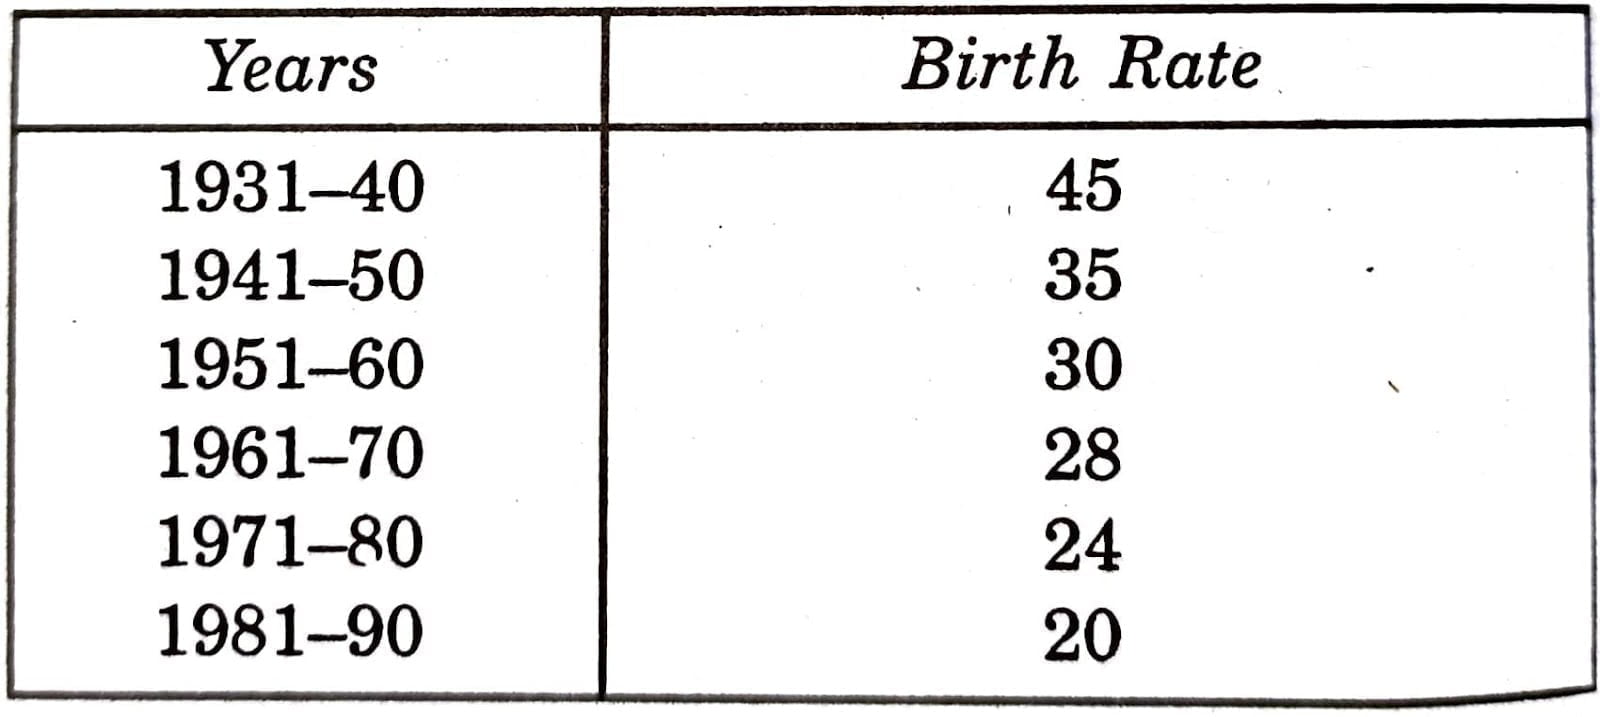
Ans.
Q.10. Present the following data in a graph:
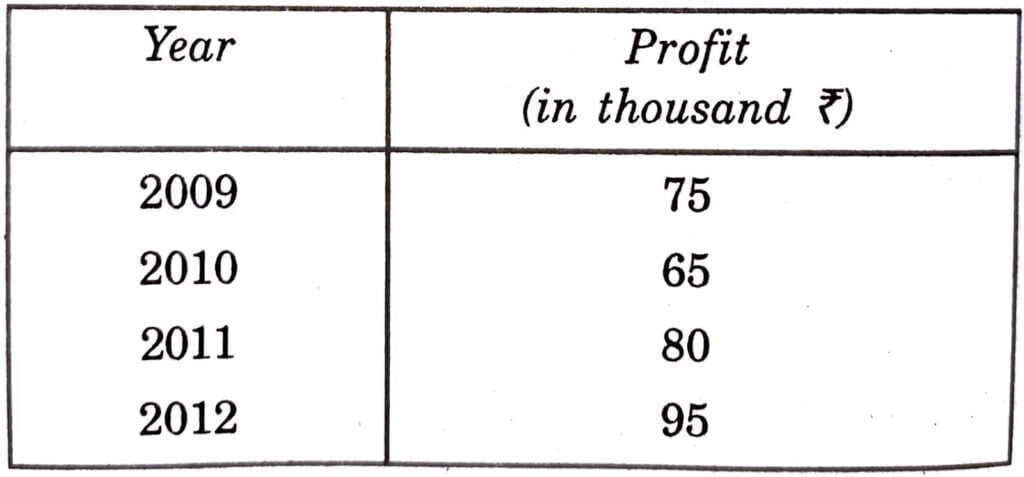
Ans.
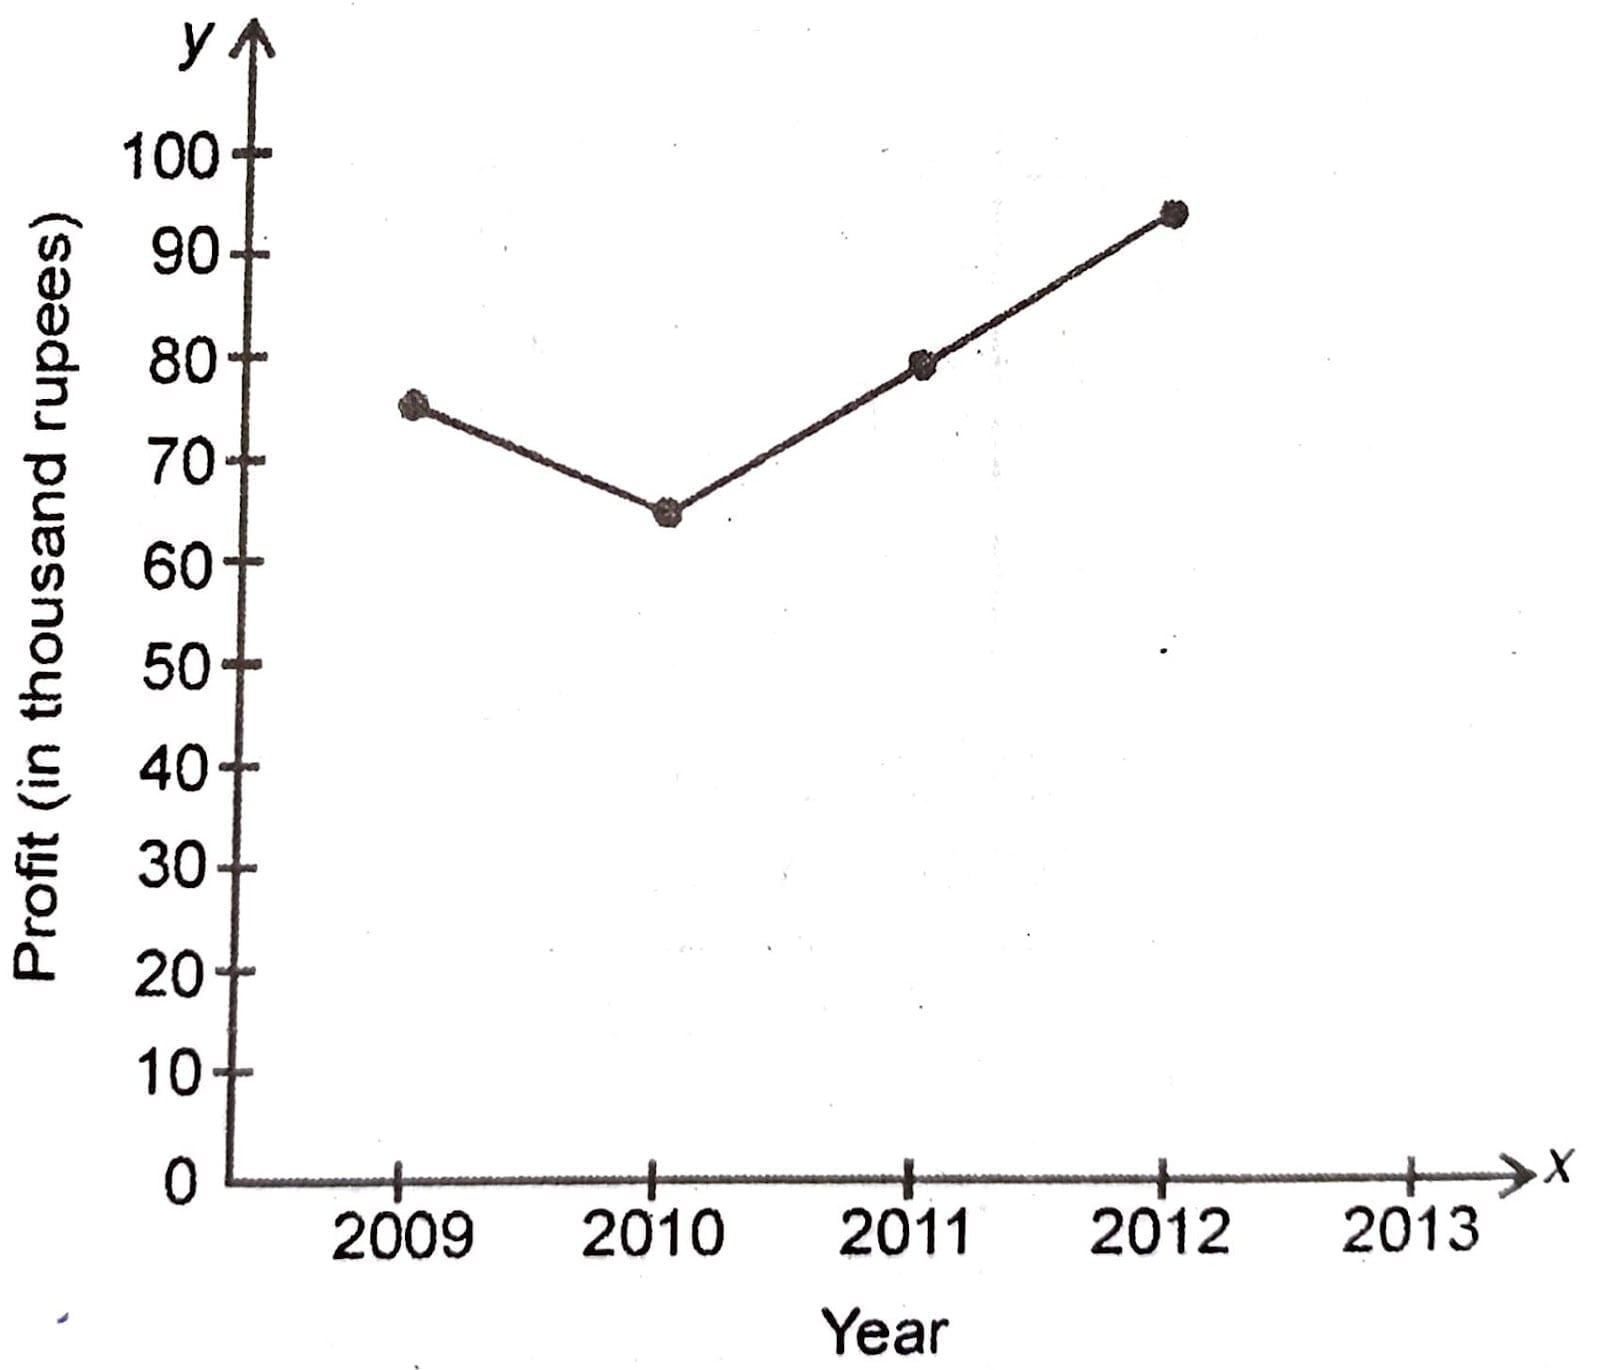
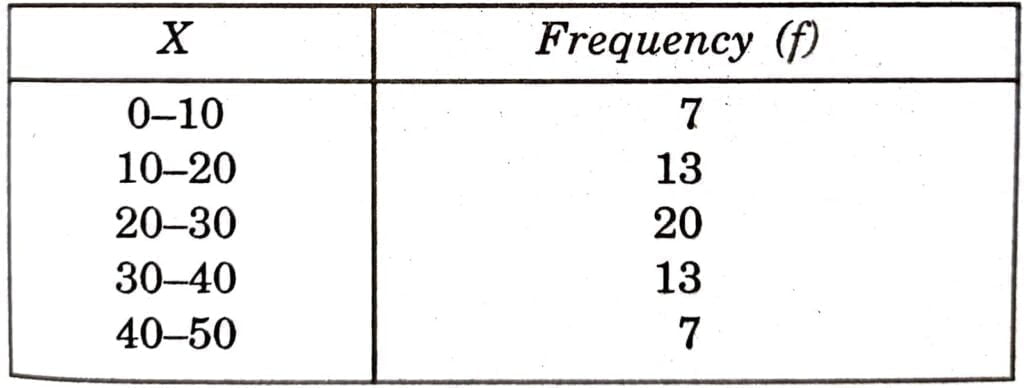
Q.11. What is an exclusive continuous series? Draw a table showing exclusive continuous series.
Ans. Exclusive Continuous Series: It is continuous series in which the upper limit of one class is the lower class of the next class, but normally the frequency is classified in the next higher class even though in the preceding class also the value is there.
Exclusive Continuous Series
Q.12. What is inclusive continuous series? Draw a table showing inclusive continuous series.
Ans. Inclusive Continuous Series: It is that continuous series in which upper limit of class is included in the class itself instead of it in the next higher class.
Inclusive Continuous Series
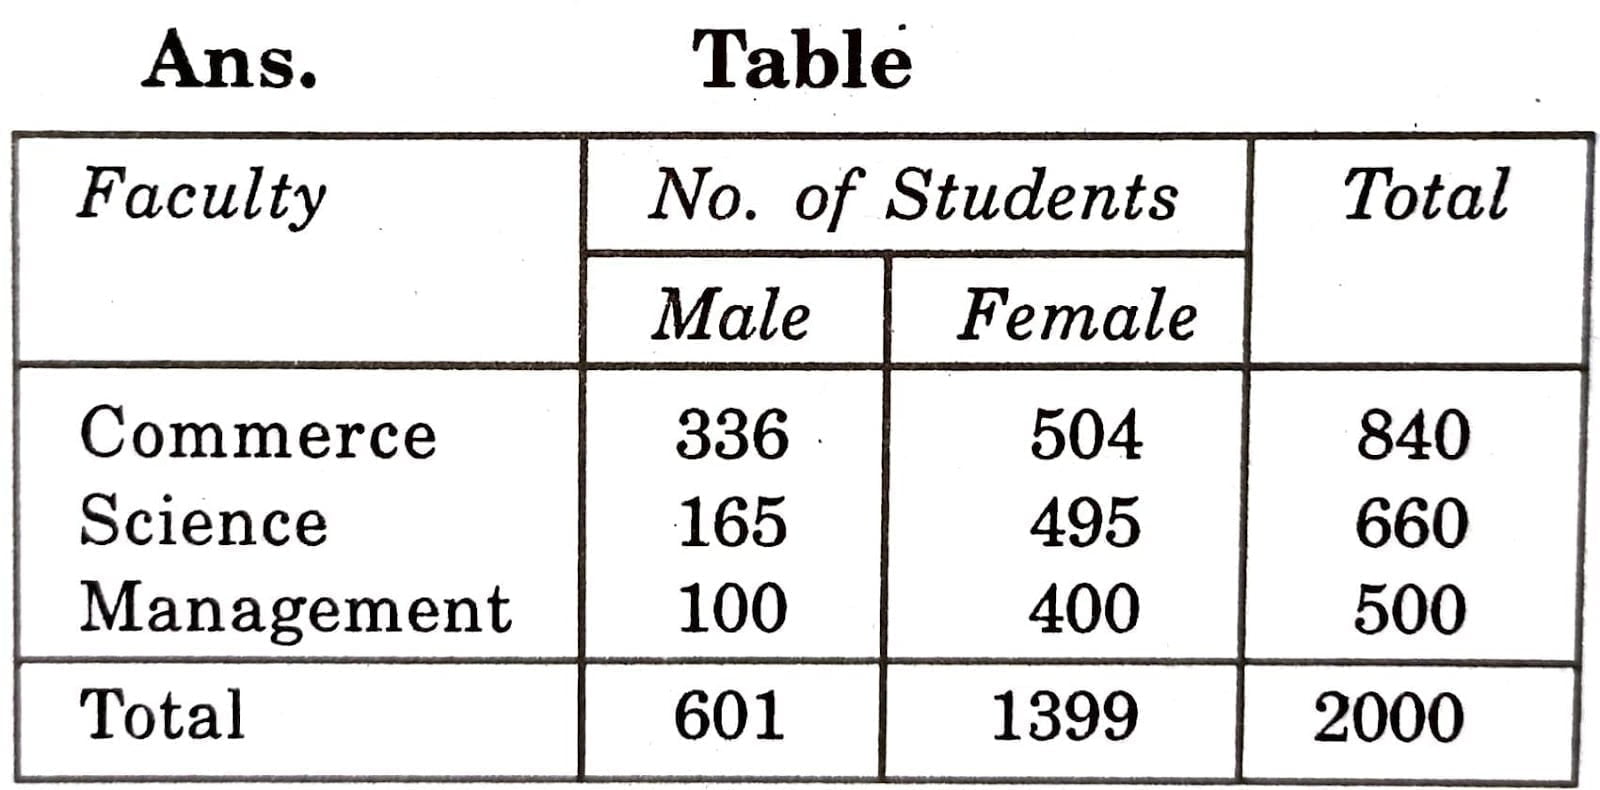
Q.13. During 2010-11, there were three faculties with 840 students in Commerce, 600 in Science, 500 students in Management.
The percentage male is 40%, 25% and 20% respectively in each subject stream. Table this data.
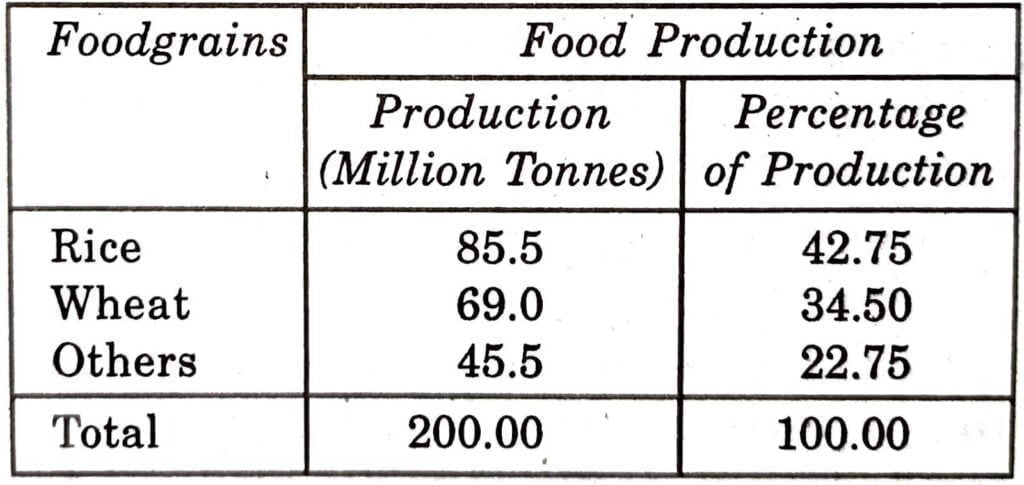
Q.14. According to economic survey 2002, the production of foodgrains in India was 200 million tons in 2010-2011. Out of which production of rice, wheat and other crops was 85.5, 69.0 and 45.5 millions respectively. Their contribution to the total production was 42.75%, 34.50% and 22.75%.
Present this data in a table.
Ans. Production of foodgrains in 2010-2011
Q.15. What are class limits? How is the mid-value of class is calculated?
Ans. Class-limits: The class-limits are the highest and lowest values that can be included in a class. For example, take the class 20-40. The lowest value is 20 and the highest value is 40. The two boundaries are known as lower limit and the upper limit.
Mid-value of the class is calculated by dividing the sum-total of both upper limit and lower limit by 2.

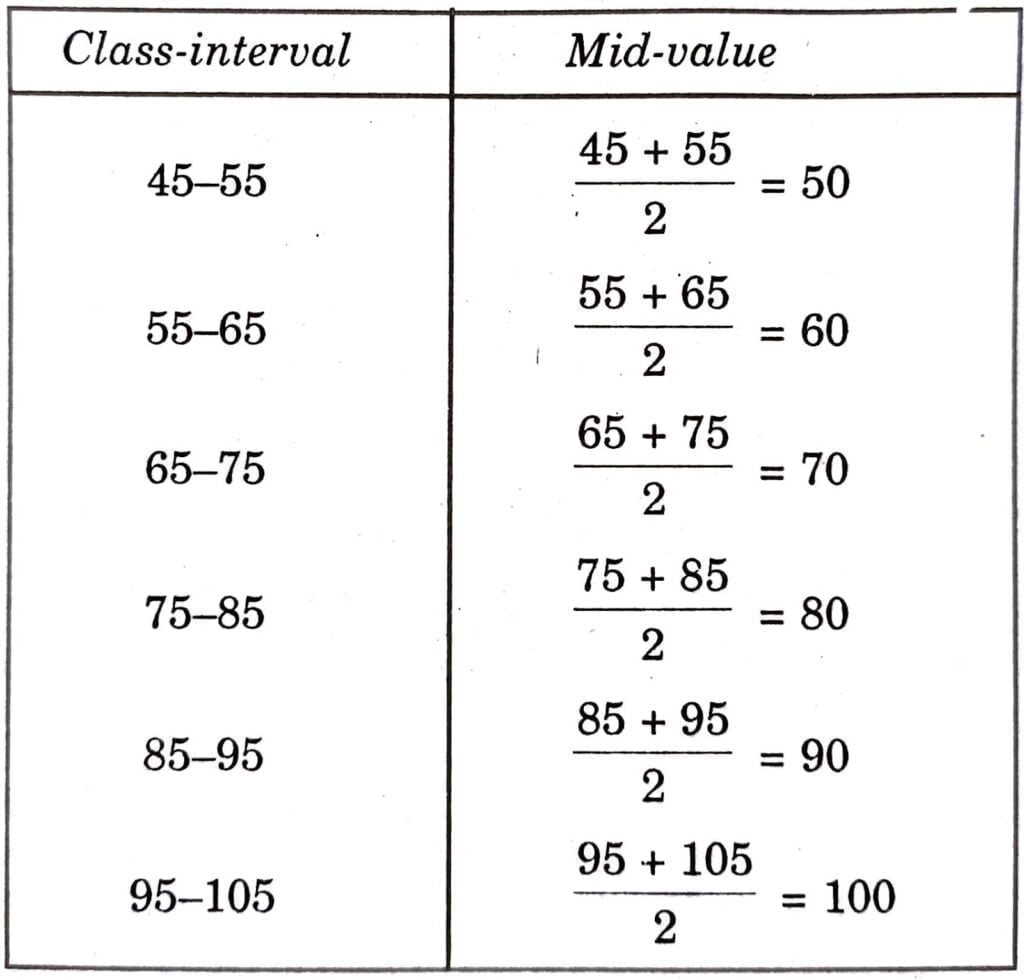
Q.16. Calculate the mid-value of following class-intervals:
45-55, 55-65, 65-75, 75-85, 85-95 and 95-105.
Ans.
Q.17. The Indian Sugar Mills Association reported that, ‘Sugar production during the first fortnight of December, 2001 was about 3,87,000 tonnes, as against 3,78,000 tonnes during the same fortnight last year (2000). The of sugar from factories during the first fortnight of December, 2001 was 2,83,000 tonnes for internal consumption and 41,000 tonnes for exports as against 1,54,000 tonnes for internal consumption and nil for exports during the same fortnight last season.’
Present the data in tabular form.
Ans.

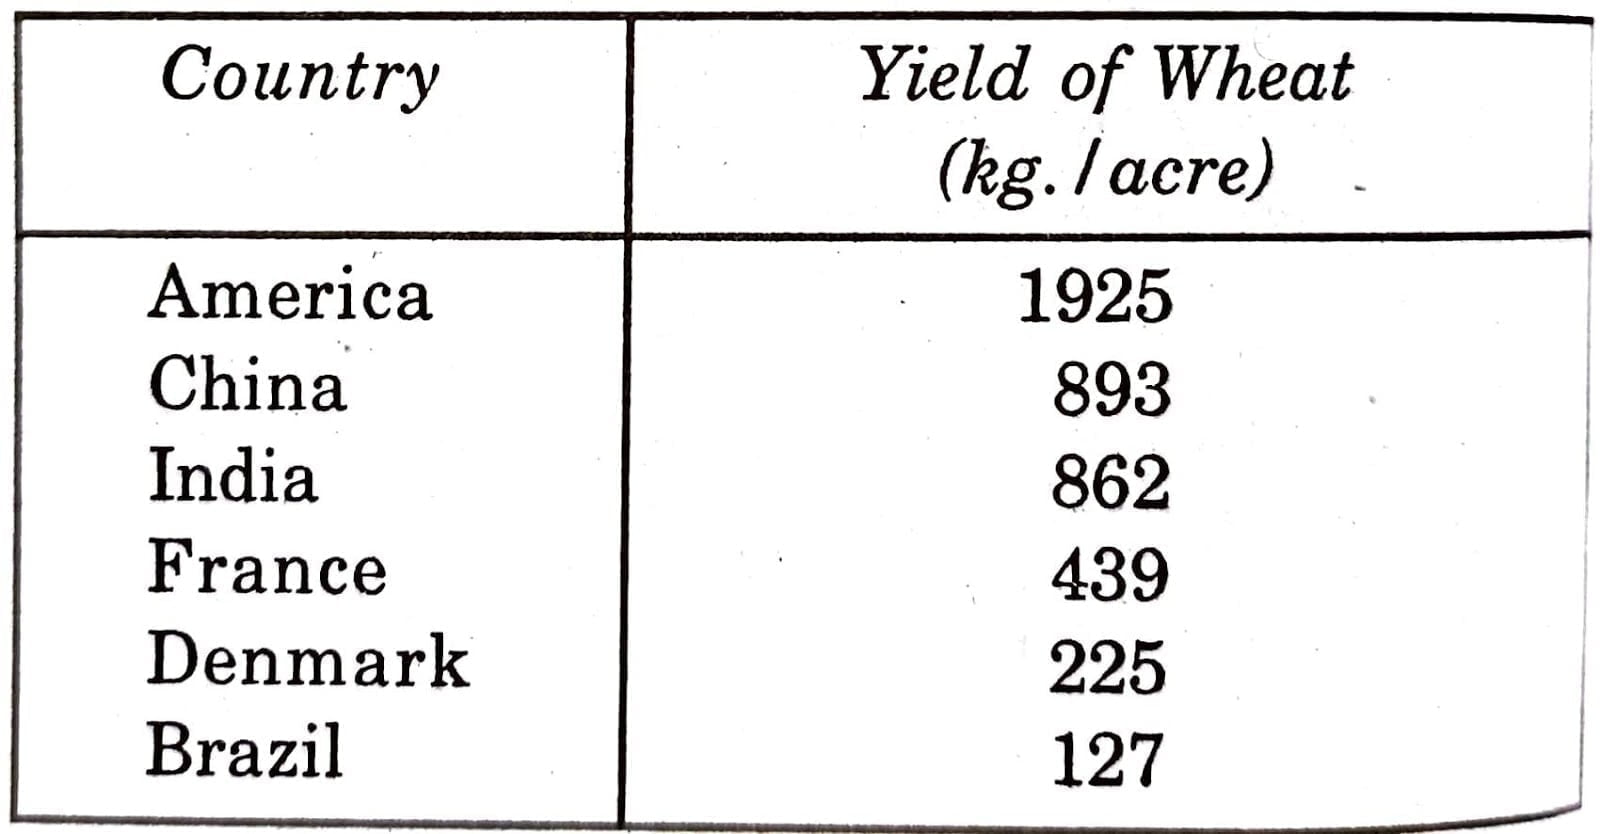
Q.18. Arrange the countries in ascending order and descending order of yield:
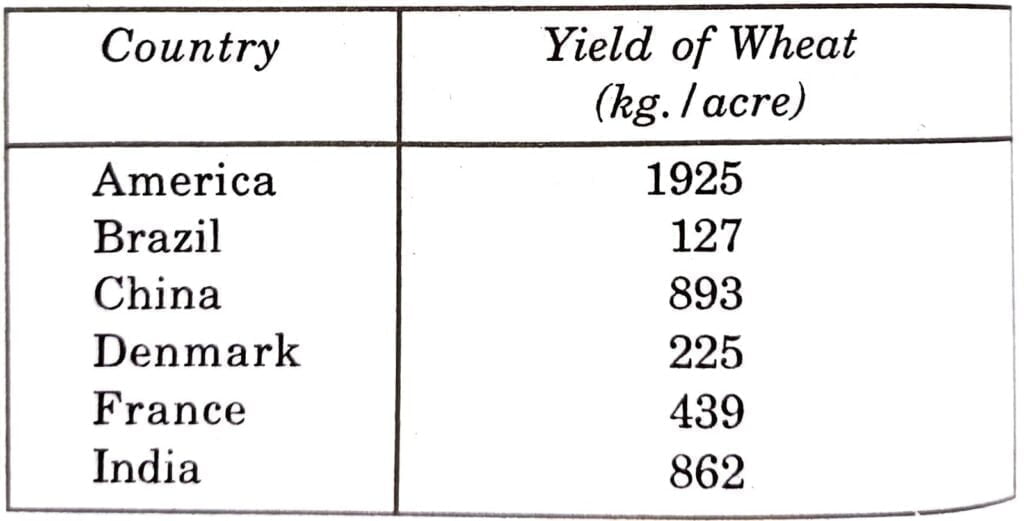
Ans. In Ascending Order
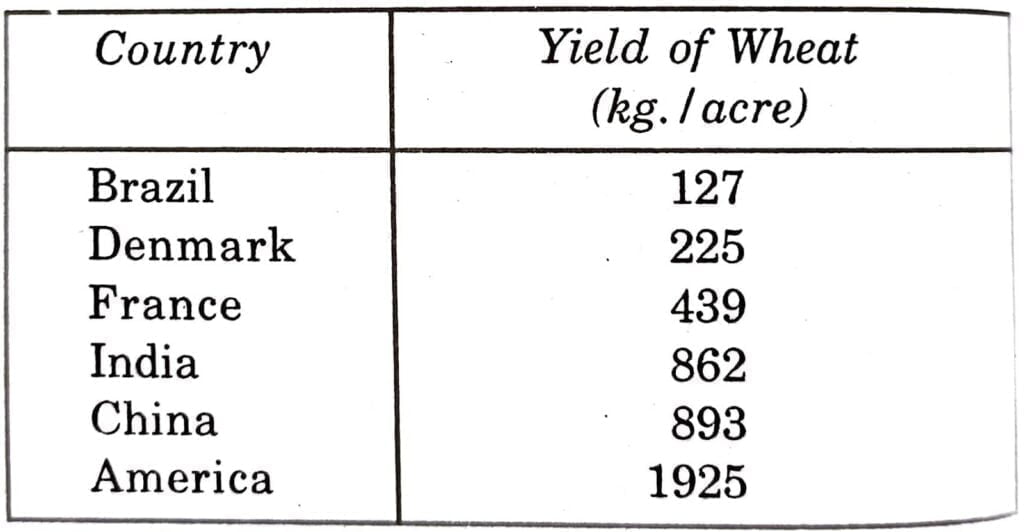
In Descending Order
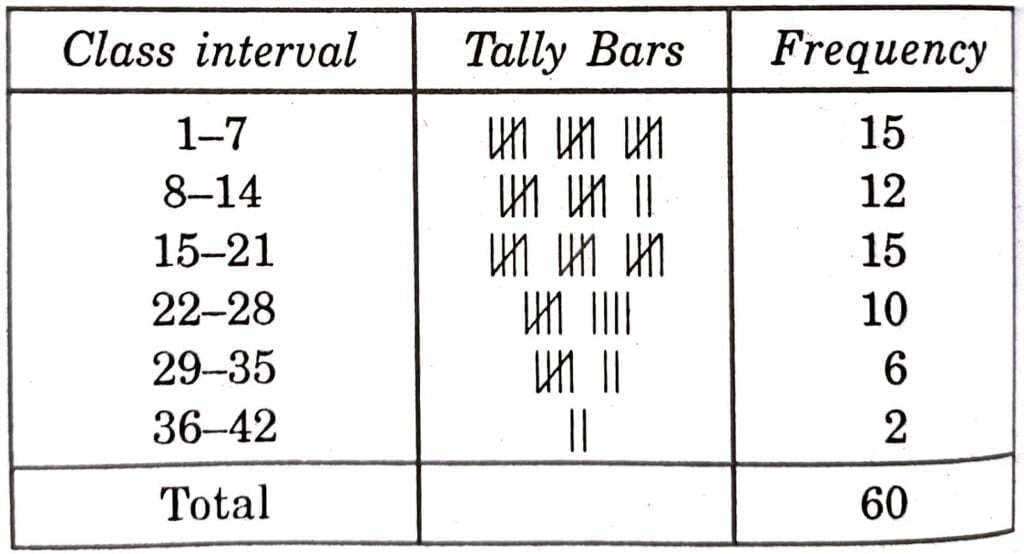
Q.19. Prepare a frequency distribution by inclusion method taking class-interval of 7 from the following data:
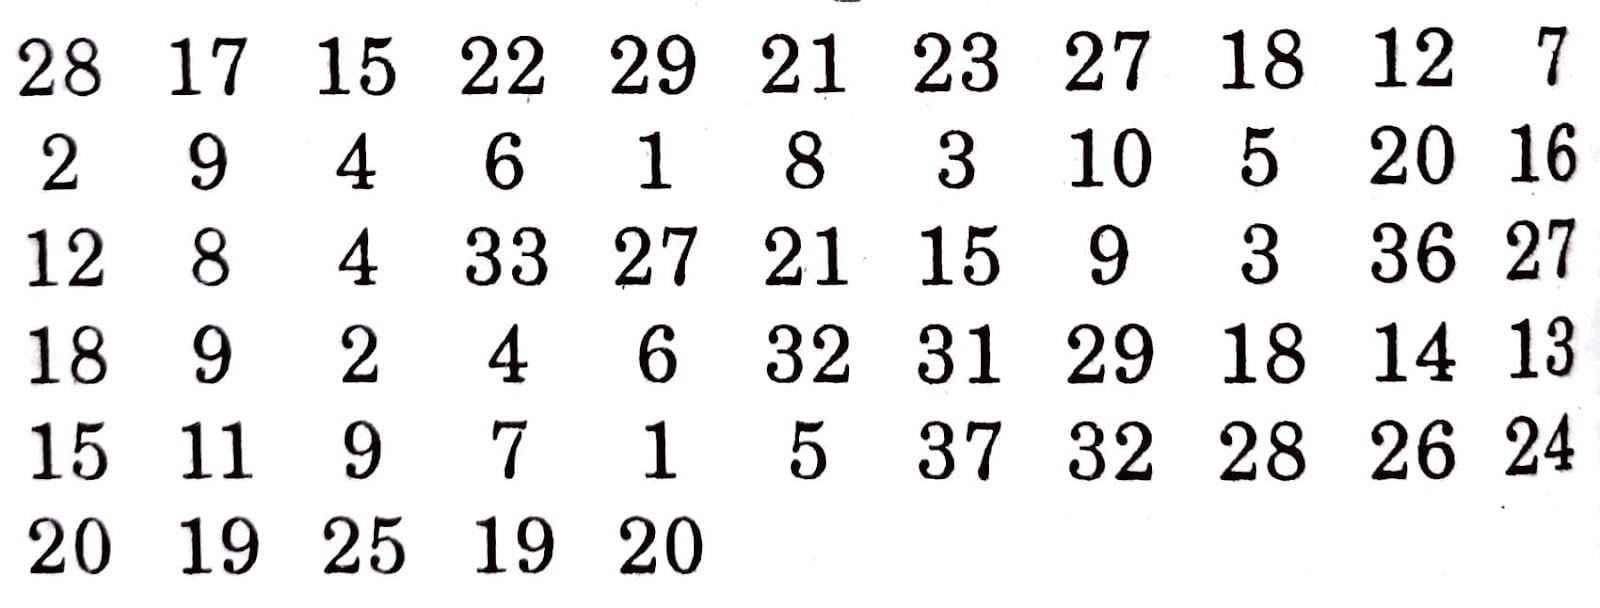
Ans.
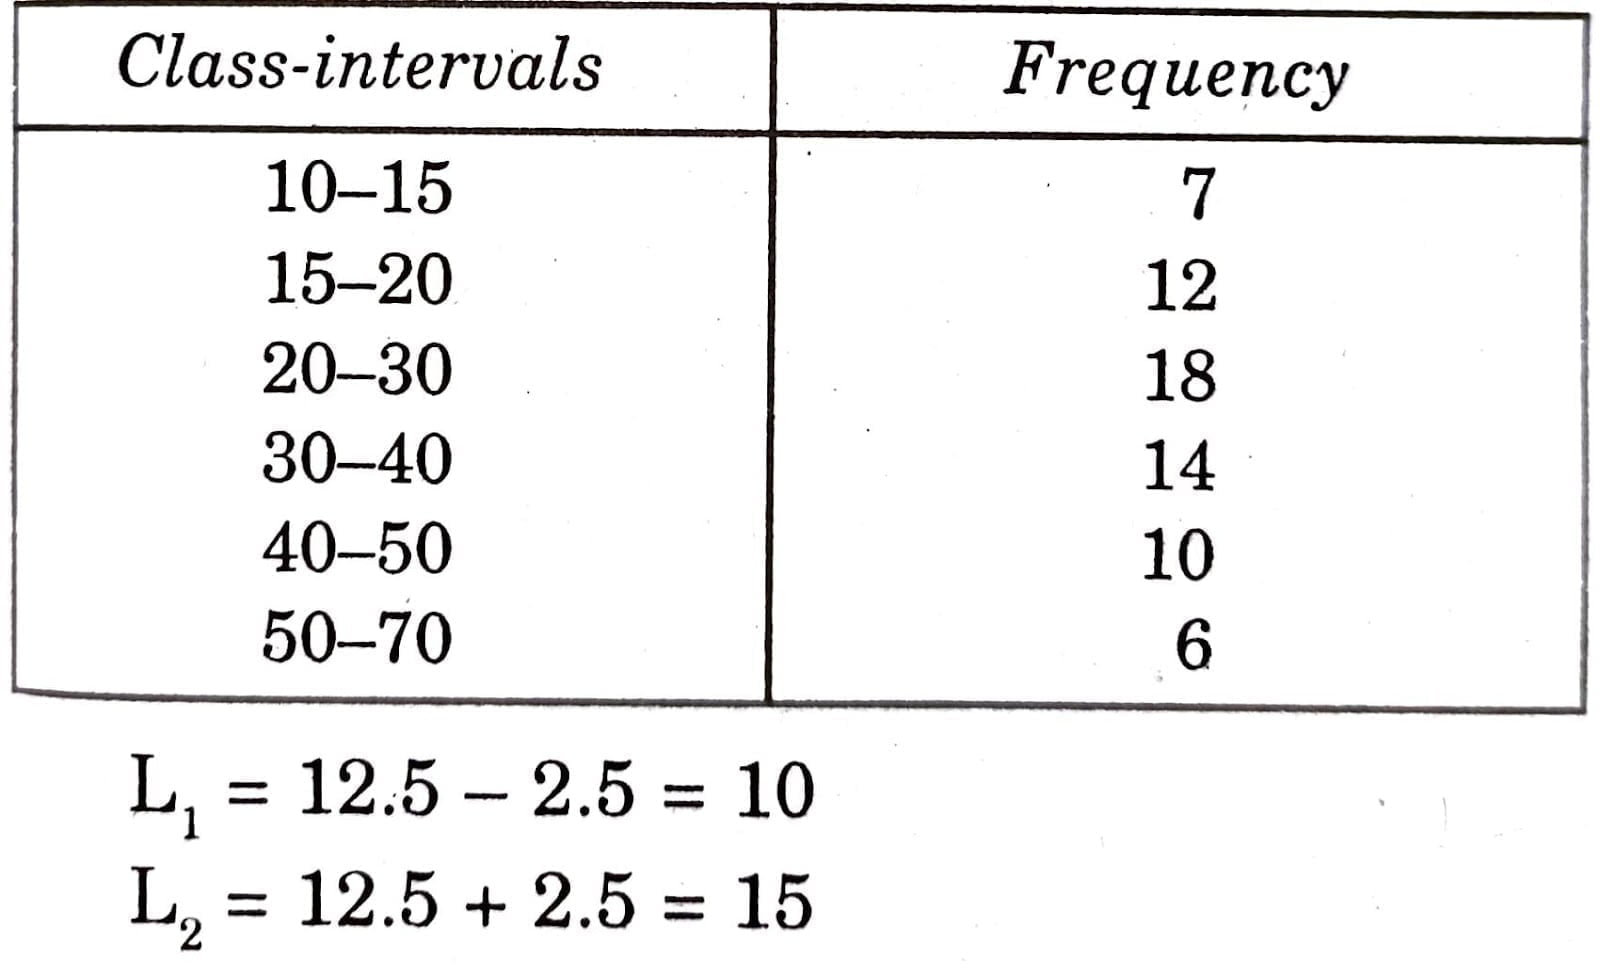
Q.20. Form class-intervals with the help of mid-values given below:
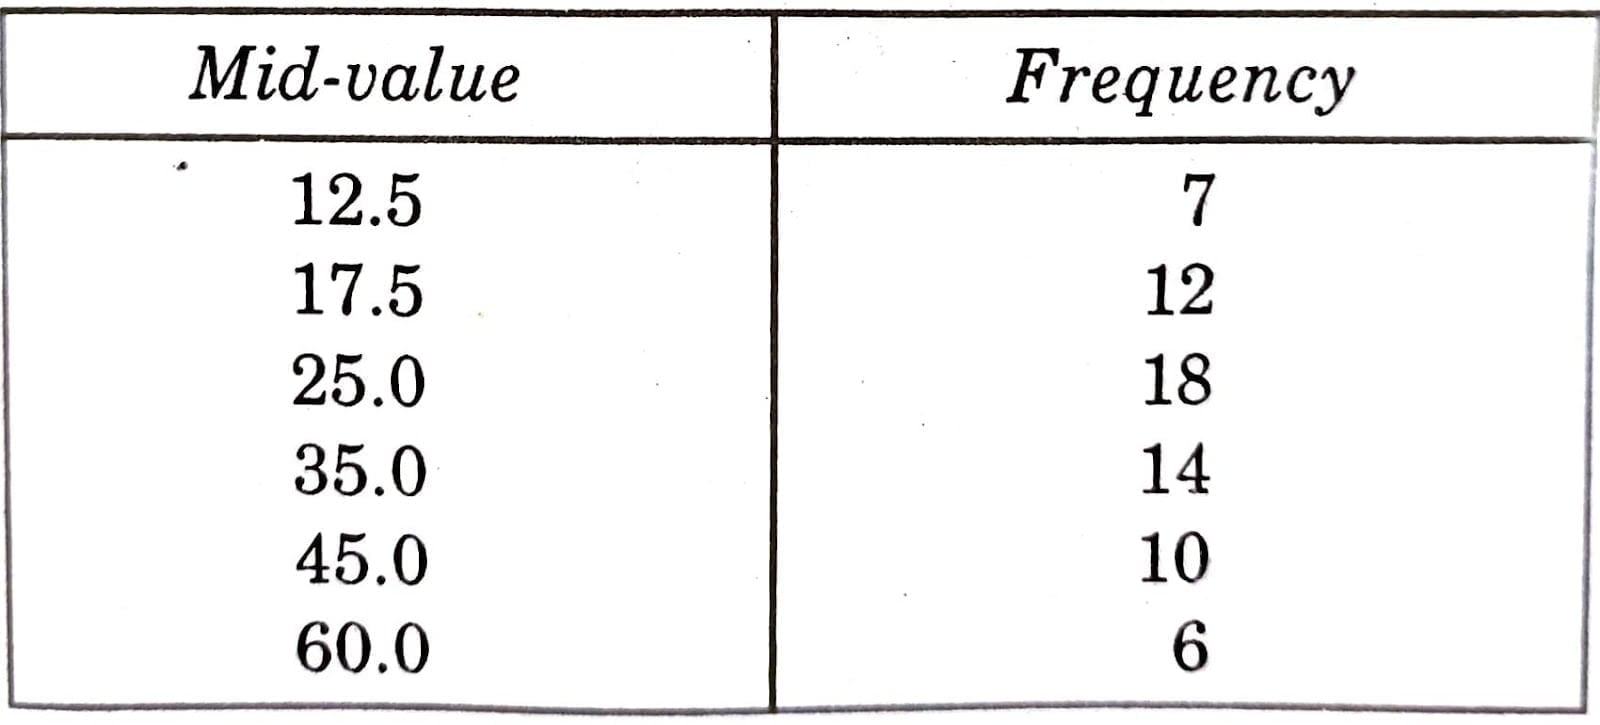
Ans. Formation of Class-intervals
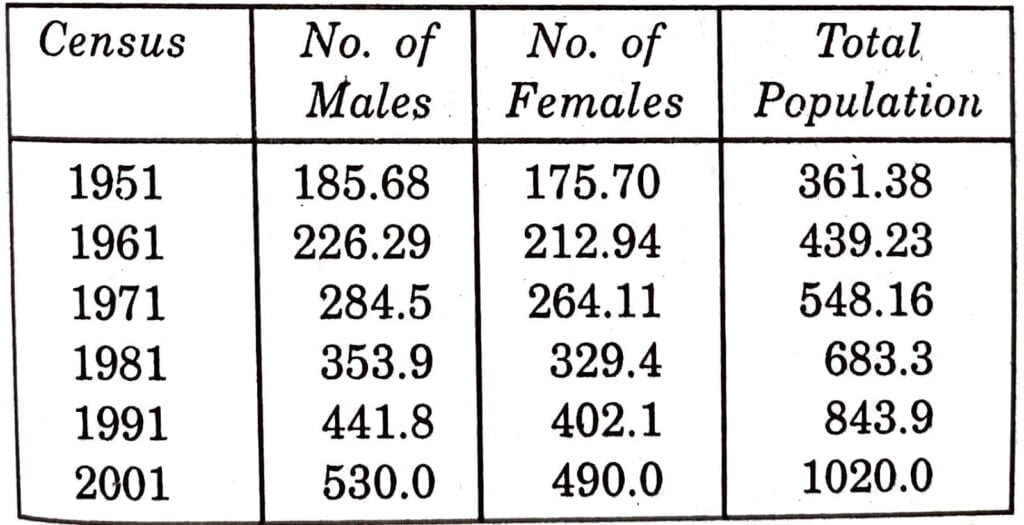
Q.21. Total population of India in 1951, 1961, 1971, 1981, 1991 and 2001 was 361.38, 439.23, 548.16, 683.3, 843.9 and 1020 millions respectively. Out of total population the number of male was 18.568, 226.9, 284.08, 353.9, 441.8 and 530 millions respectively and that of female was 175.70, 212.94, 264.11, 329.4, 402.1 and 490 million respectively. Present the data in a table.
Ans. Population of India in Million
Q.22. Foodgrains production in India during 2004-2005 was 172.25 million tonnes out of which production of rice, wheat and other crops was70.76, 53.99 and 45.0 million tonnes respectively. Their percentage contribution to total production was 42.0, 32.0 and 26.0 respectively.
Ans. Production of Foodgrains
during 2004-2003
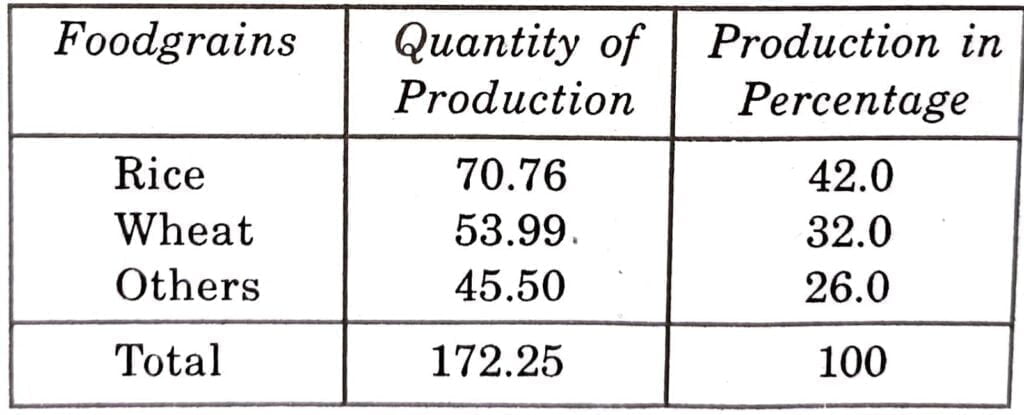
Percentage contribution of rice = 70.76 × 100 = 172.75
Q.23. Following information is relating to the smoking habit of people living in two towns A and B. Make a table with the help of this data.

Ans. Table (in Percentage)
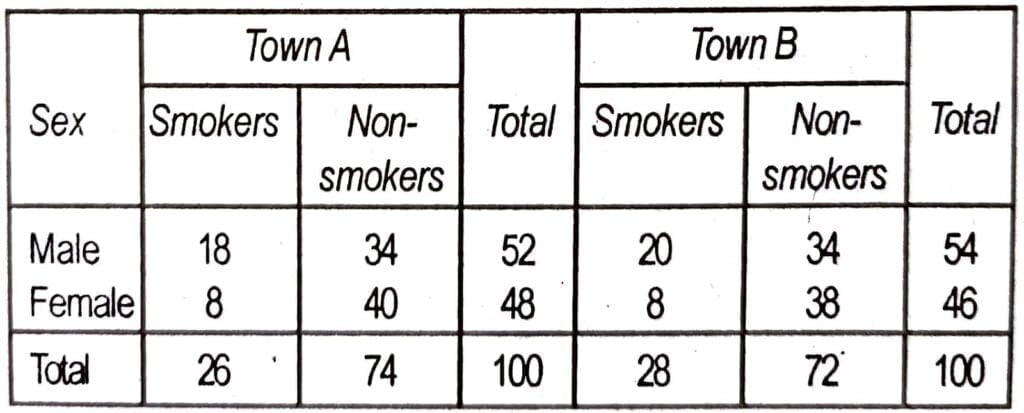
Town A
Total smokers = 26%
Male smokers = 18%
Hence,
Female smokers = 26 – 18 = 8

Hi! my Name is Parimal Roy. I have completed my Bachelor’s degree in Philosophy (B.A.) from Silapathar General College. Currently, I am working as an HR Manager at Dev Library. It is a website that provides study materials for students from Class 3 to 12, including SCERT and NCERT notes. It also offers resources for BA, B.Com, B.Sc, and Computer Science, along with postgraduate notes. Besides study materials, the website has novels, eBooks, health and finance articles, biographies, quotes, and more.


