
Class 11 Economics Chapter 4 The Theory of The Firm under Perfect Competition, (Assam Higher Secondary Education Council) AHSEC Class 11 Economics Question Answer in English Medium each chapter is provided in the list of AHSEC so that you can easily browse through different chapters and select needs one. Assam Board Chapter 4 The Theory of The Firm under Perfect Competition Class 11 Economics Question Answer can be of great value to excel in the examination.
AHSEC Class 11 Economics Chapter 4 The Theory of The Firm under Perfect Competition


Class 11 Economics Chapter 4 The Theory of The Firm under Perfect Competition Notes cover all the exercise questions in SCERT Textbooks. The SCERT Class 11 Economics Chapter 4 The Theory of The Firm under Perfect Competition Solutions provided here ensure a smooth and easy understanding of all the concepts. Understand the concepts behind every chapter and score well in the board exams.
The Theory of The Firm under Perfect Competition
Chapter – 4
PART – A
VERY SHORT ANSWER QUESTIONS
1. Fill in the blanks :
Under a perfectly competitive market each buyer and seller.
Ans: Price
2. Define total revenue of a firm.
Ans : Revenue refers to money receipts of the producer from the sale of his output.
Total revenue is the sum of all sale receipts or income of a firm. i.e.
TR =AR × Q.
Average revenue is the per unit revenue received from the sale of a commodity. It is – AR=TR/Q and marginal revenue is the change in total revenue. which results from the sale of one more or one less unit of output.
3. What us average revenue ?
Ans : Revenue refers to money receipts of the producer from the sale of his output.
Total revenue is the sum of all sale receipts or income of a firm. i.e. TR =AR × Q.
Average revenue is the per unit revenue received from the sale of a commodity. It is – AR=TR/Q and marginal revenue is the change in total revenue. which results from the sale of one more or one less unit of output.
4. Define marginal revenue.
Ans: Revenue refers to money receipts of the producer from the sale of his output.
Total revenue is the sum of all sale receipts or income of a firm. i.e.
TR =AR × Q.
Average revenue is the per unit revenue received from the sale of a commodity. It is – AR=TR/Q and marginal revenue is the change in total revenue. which results from the sale of one more or one less unit of output.
5.Fill in the blanks :
For a price taking firm, average revenue is equal to______.
Ans : Marginal Revenue.
6. What is break-even point ?
Ans : The point on the supply curve at which a firm earns normal profit is called the break even point of a firm.
7. Define price elasticity of supply.
Ans : Price elasticity of supply is the measure of change in supply of a commodity due to change in its price. According to Samuelson, “Elasticity of supply is the degree of responsiveness of supply of a commodity to a change in its price.” And according to Prof. Bilas, “Elasticity of supply is defined as the percentage change in quantity supplied, divided by percentage change in price.” The price elasticity of supply, denoted by eₛ, is defined as follows-
Price elasticity of supply (e)= Percentage change in quantity supplied/ Percentage change in price.
8. What does a vertical supply curve imply ?
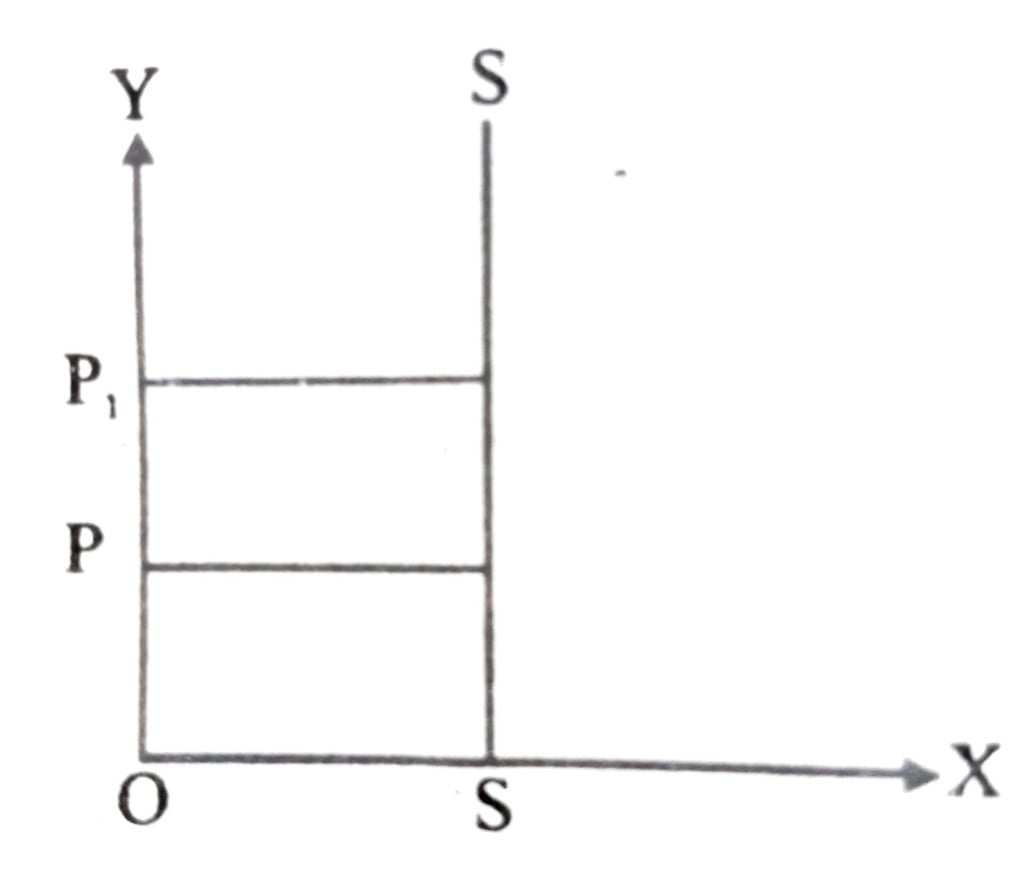
Ans : Perfectly inelastic supply states that there is no change in supply, regardless of change in price. In the fig. SS is perfectly inelastic supply curve and is parallel to Y axis. It signifies that even if price increases to OP. the supply remains unchanged i.e., OS. In this case, elasticity of zero. Supply of perishable goods in short period is inelastic.
9. State two main features of a perfectly competitive market.
Ans : (a) Large number of buyers and sellers : The number of buyers is very large. Accordingly, like an individual firm, an individual buyer is not able to influence price of the commodity. An increase or decrease in individual demand will hardly make any difference to the total market demand. Not only the number of buyers very large, also the number of firms selling a particular commodity is so large that any increase or decrease in the supply of one particular firm hardly influence the total market supply.
(b) Homogeneous product : All sellers sell identical units of a given product at a given price. Selling homogeneous product at the given price ules out the possibility of advertisement or other sale promotion expenses so that there are no selling costs in perfectly competitive market.
10.Choose the correct portion:
All firms under perfect competition produce___(differentiated/ homogenous/high quality good).
Ans : Homogenous.
11.State true or false :
(a) For a price taking firm, marginal revenue equals the market price.
Ans : True.
(b)The difference between total revenue and total cost indicates the amount of profit for the firm.
Ans : True. (b)
(c) The demand curve that a firm faces in a perfectly competitive market is perfectly inelastic.
Ans : False.
(d) Buyers have perfect information about the price prevailing in the market.
Ans: True.
12. Fill in the blanks :
(a) Profit that a firm earns over and above the normal profit is called the____ profit
Ans : Super-Normal Profit.
(b) The point on the supply curve at which a firm earns normal profit is called the______ (shut down point/break even point).
Ans : Break-Even point.
(c) At the point of equilibrium of a firm under perfect competition, P = AC = _____.
Ans : P = AC = MC.
(d) (i) TR = P (price) x __.
(ii) r (profit) = TR – ____.
Ans : (i) TR = P (Price)xQ (quantity)
(ii) r (profit)= TR – TC
13. Under Perfectly Competitive market who is a price taker _____ Buyer / Seller / both buyer and seller.
Ans : Both buyer and seller.
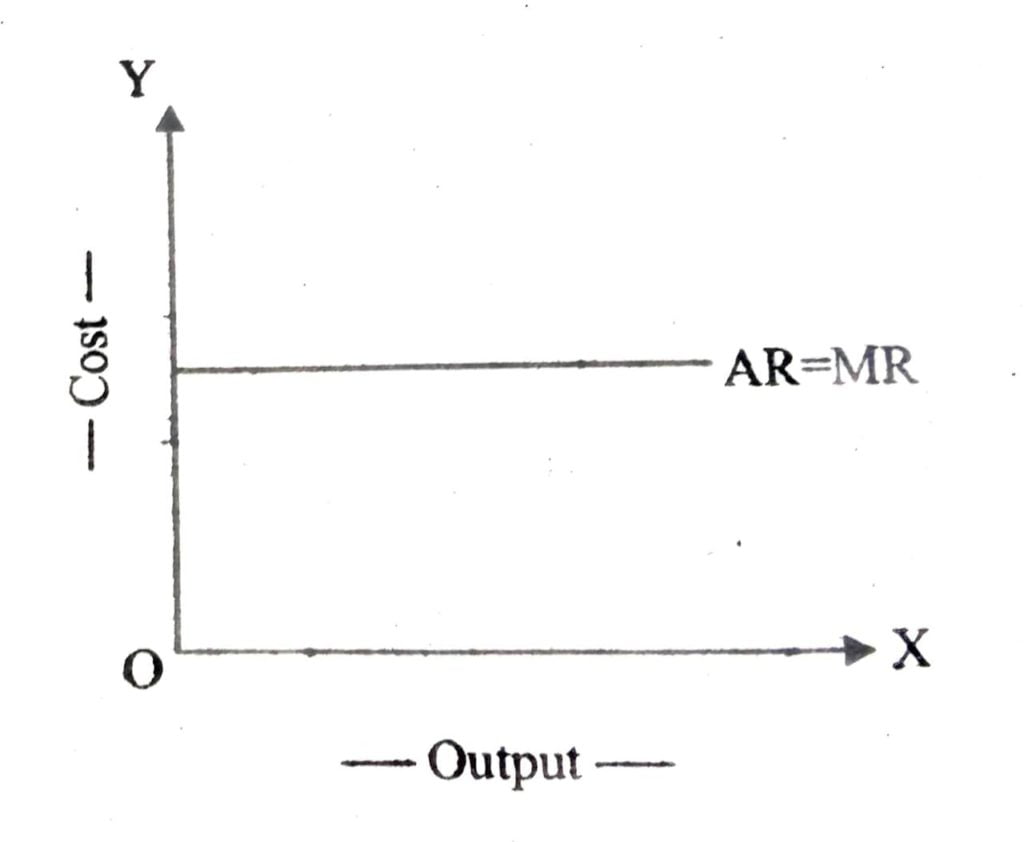
14. Draw the average revenue curve of a perfectly competitive firm.
Ans:
SHORT ANSWER QUESTION TYPE – II : (MARKS : 3)
1. Draw a total revenue curve of a firm under perfectly competitive market and define its slope.
Ans :
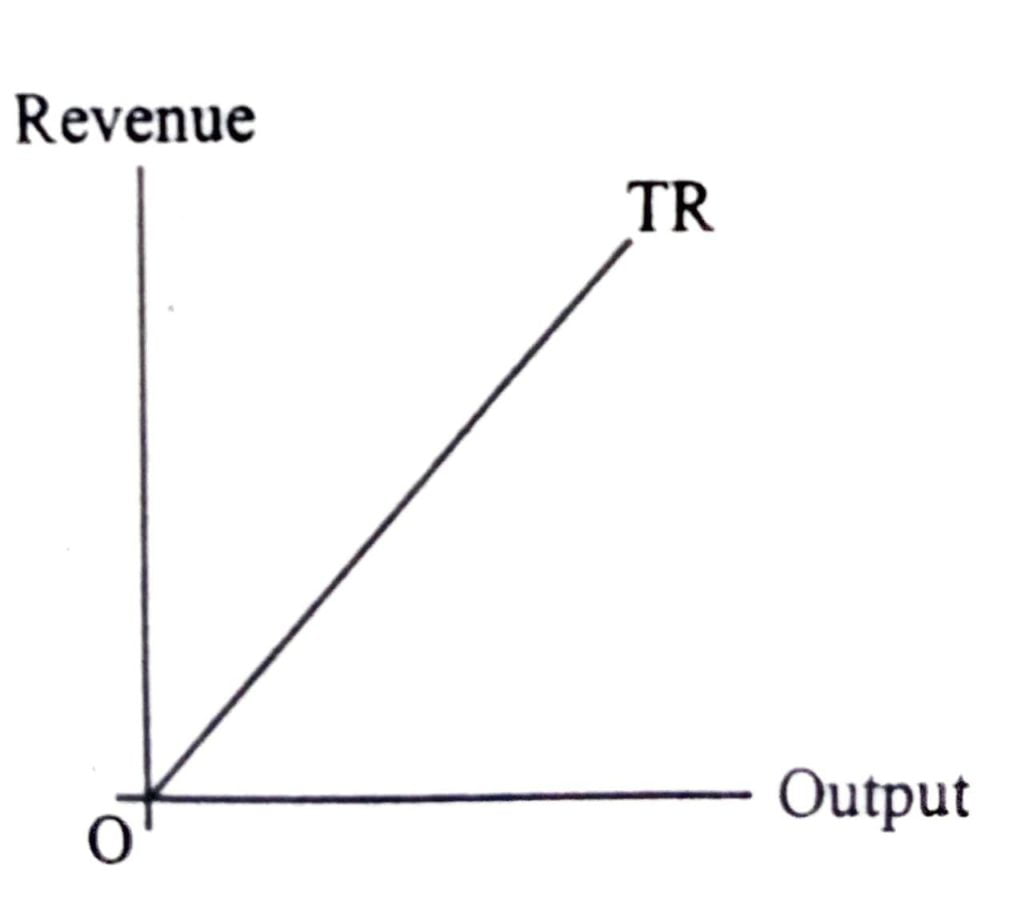
The slope of the TR curve shows that it increases at a constant rate.
2. Suppose the market price of each unit of a good is 5. A tale of 6 units have been sold by a price taking firm. Calculate total revenue, marginal revenue and average revenue for the firm.
Ans : Given,
P=Rs. 5
Q=6units
∴ TR= P. Q = 5×6 = 30
AR= TR/Q= 30/60 = 5
∴ MR = 5 [∵AR-MR, under perfect competition.]
3. Explain why the average revenue for a price taking firm equals the market price.
Ans : The demand curve of the firm under perfect competition is perfectly elastic. It is horizontal straight line parallel, to ox axis. It is so, because the firm is to accept the price as determined by the forces of market supply and markets demand, it can sell whatever amount it wishes to sell at this price.
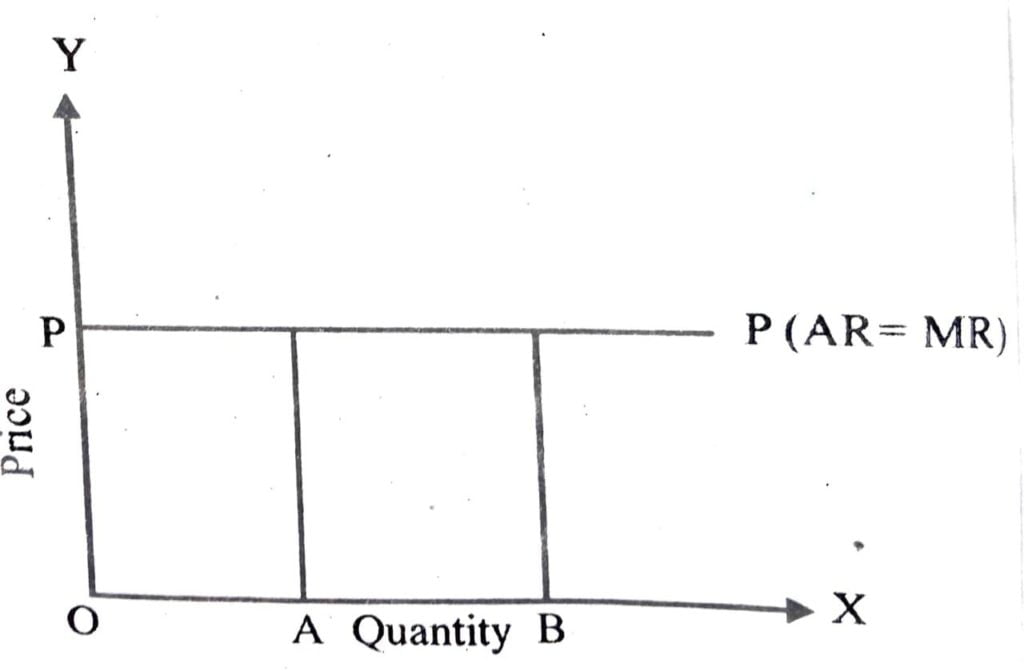
The above figure shows that at the given price OP, the firm can sell any Y quantity commodity it produces. PP is the demand curve of the P and it is a horizontal 8 straight line. Price remains constant whether quantity A Quantity demanded is OA or OB or even zero.
4. State the conditions needed for a firm to maximise profit by producing positive output in a competitive market.
Ans : Ifa profit maximising firm produces positive output in a compe market three conditions must hold. They are
(a) The market price, P, is equal to the marginal cost at q₀:
(b) The marginal cost is nono decreasing at q₀.
(c) In the short run, the market price, P. must be greater than equal; to the average variable cost at q₀. In the long run, the market price, P must be greater than or qual to the average cost at q₀.
5. Explain the role of technological progress as a determinant of a firm’s supply curve.
Ans :
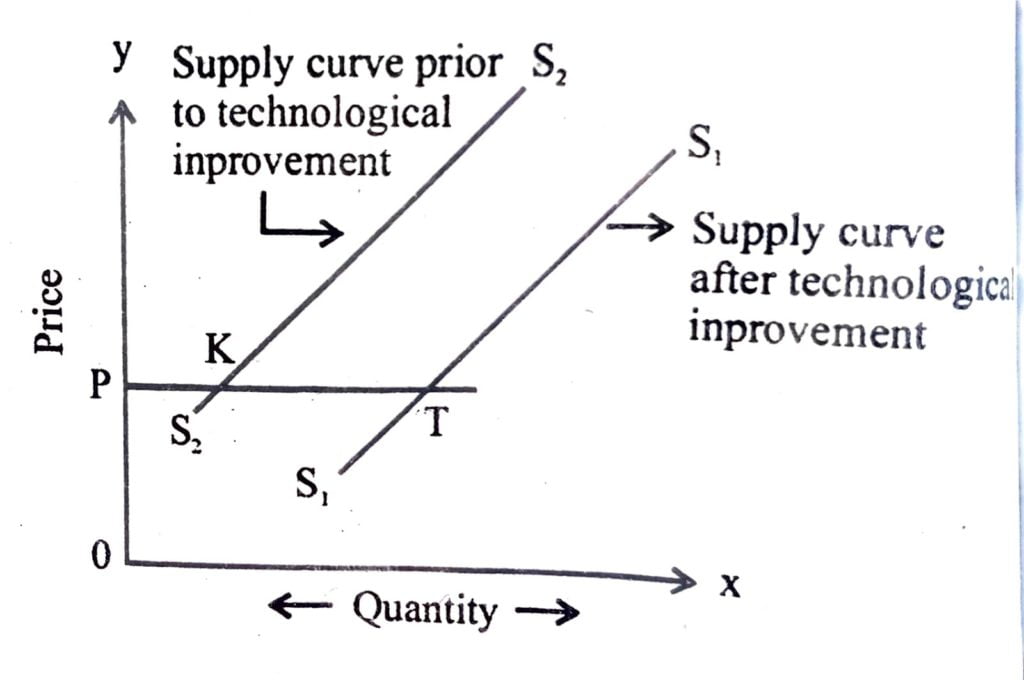
Technological improvement tends to lower the marginal and average cost of production, because more can be produced with less and less additional resources. According, producers should be willing to more at the existing price. This implies a forward shift in supply curve, as shown in the figure, initially, PK quantity was supplied at price OP. After technological improvement in production. PT quantity is supplied at the same price. It is a situation of increase in supply.
6. Mention three determinants of a firm’s supply curve under perfect competition.
Ans : The three determinants are :
(a) Technological Progress.
(b) Input prices.
(c) Tastes and Preferences.
7. Explain the concept of normal profit.
Ans : See Q. No. 4, (Short Type I)
8. What is shut-down point of a firm.
Ans : Sce Q. No. 4, (Long Type)
9. Clarify the meaning of break-even point of a firm.
Ans: The point on the supply curve at which a firm earns normal profit is called the break even point of a firm.
10. Clarify the concept of opportunity cost with a suitable example.
Ans: See Q.No. 2, Unit-1 (Short Type II)
11. Why is perfectly competitive market AR = MR ?
Ans: The firm under perfect competitive market is a price taker and cannot alter its price, it can charge for the product it is selling, the average revenue is the some for all units of output sold. In this case marginal revenue will also be constant and equal to the average revenue.
12. Mention two determinants of the supply curve of a firm.
Ans: (a) Production cost : Since most private companies’ goal is profit maximisation. Higher production cost will lower profit, thus hinder supply. Factors affecting production cost are: input prices, wage rate, government regulation and taxes, etc.
(b) Technology : Technological improvements help reduce production cost and increase profit, thus stimulate higher supply.
SHORT ANSWER QUESTIONS TYPE-I: (MARKS : 4)
1. Prove that a firm under competition market can not maximum profit at a points where price is greater than the marginal cost.
Ans:
A profit maximising firm in a competitive market will never produce a positive level of output in the range, where the marginal cost is falling. The price line can intersect MC curve at two points i.e. at falling MC and at rising MC The profit maximising condition of P – MC holds good only when price line cuts rising marginal cost curve. MC must be higher than MR after equilibrium point. Hence, to achieve equilibrium, a competitive firm chooses its level of output in the rising portion of MC curve. In fact, after reaching equilibrium point it would not be profitable to produce an additional unit of output as MC is higher than MR. Similarly, the firm will not choose any level of output profit when MC is falling. Falling MC would mean that the cost of producing an additional unit of output is lower than the additional revenue. In such a situation, profit maximising firm would certainly like to increase output.
2. “The condition of ‘price less than marginal cost’ is ruled out for profit maximisation for a firm under competitive market.” Explain.
Ans : Same as Q. No. 1
3. Draw and explain the nature of the short-run supply curve of a firm under competitive market.
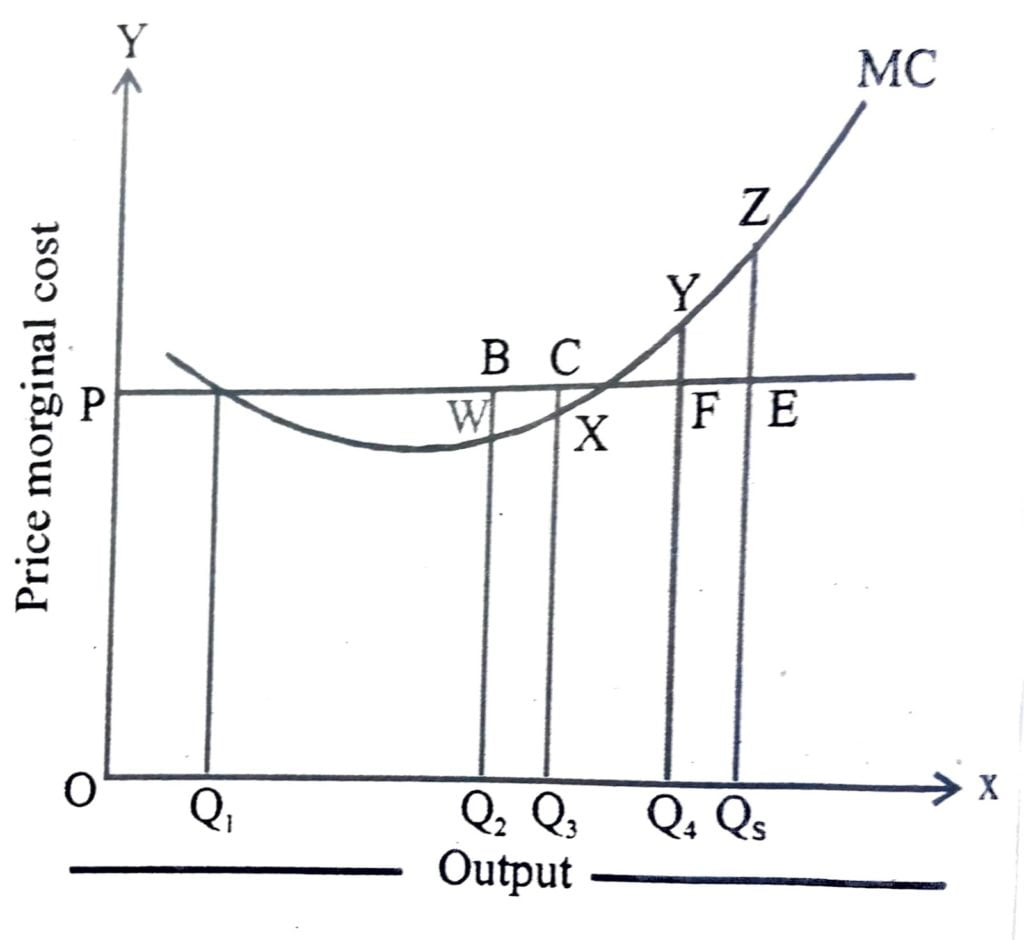
Ans : Derivation of short run supply curve of a firm can be shown in two ways. First, we determine a firm’s profit maximising output level when the market price is greater than or equal to the minimum AVC. Suppose, the market price is P, which exceeds the minimum AVC. We start out by equating P with SMC on the rising part of the SMC curve. As shown in the figure, below this leads to the output level AVC at q, does not exceed the market price P . When the market price is P,, the firm’s output level in the short run is equal to q,
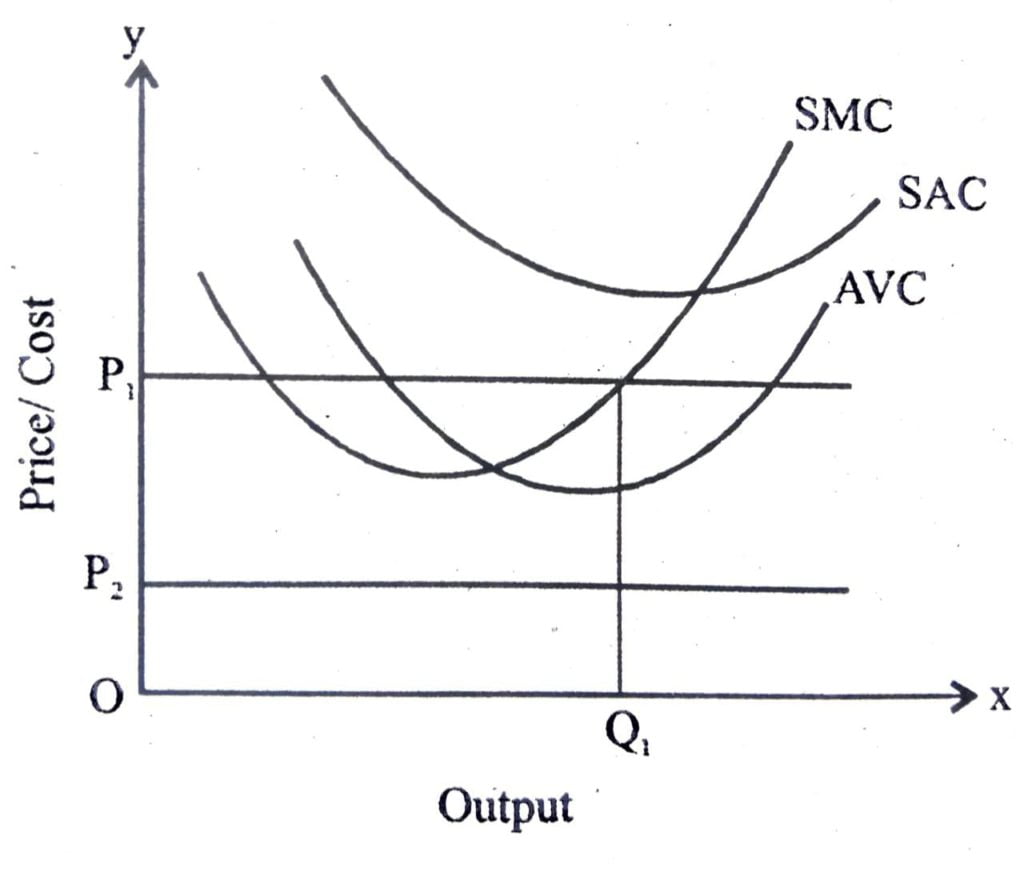
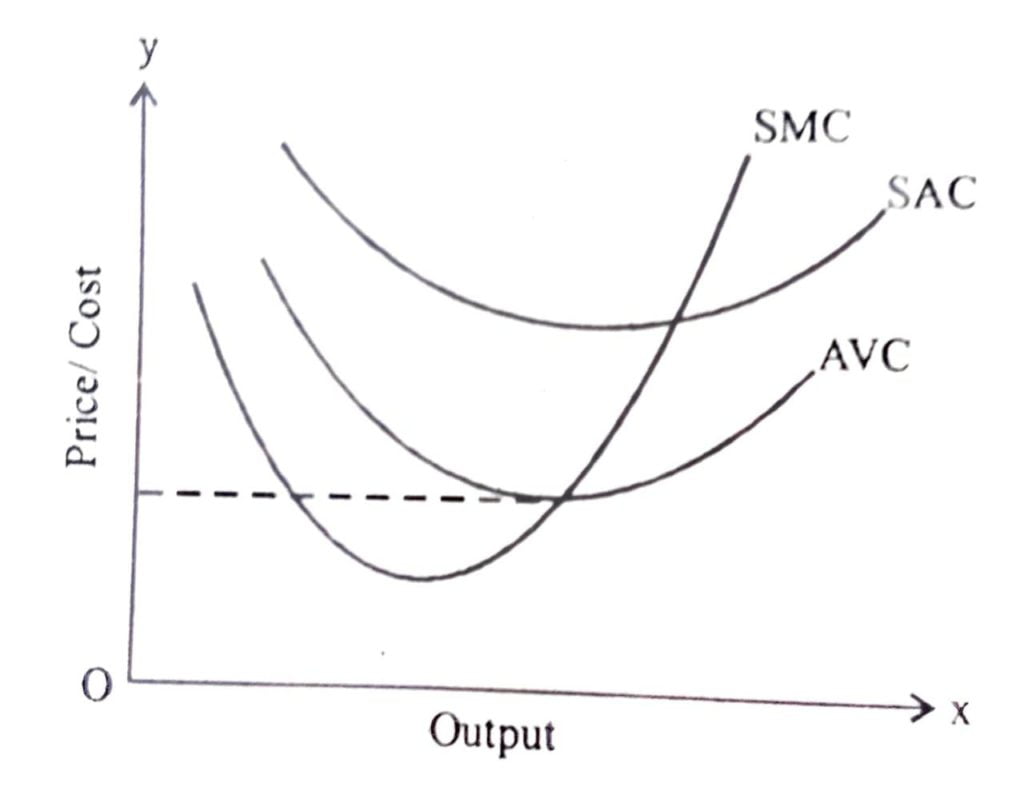
Secondly, the short run supply curve can be derived by the firm’s output profit maximising output level, when the market price is less than the minimum AVC. It is shown in the following diagram. A firm’s short run supply curve is the rising part of the SMC curve from and down the minimum AVC, together with zero output for all prices strictly less than the minimum AVC.
4. Distinguish between the concepts of a normal profit an super normal profit.
Ans : The profit level that is just enough to cover the explicit costs an opportunity costs of the firm is called the normal profit.
The profit that a firm earns over and above the normal profit is called the super normal profit.
5. Show how a firm’s supply curve is affected by a unit tax imposed by the government.
Ans :
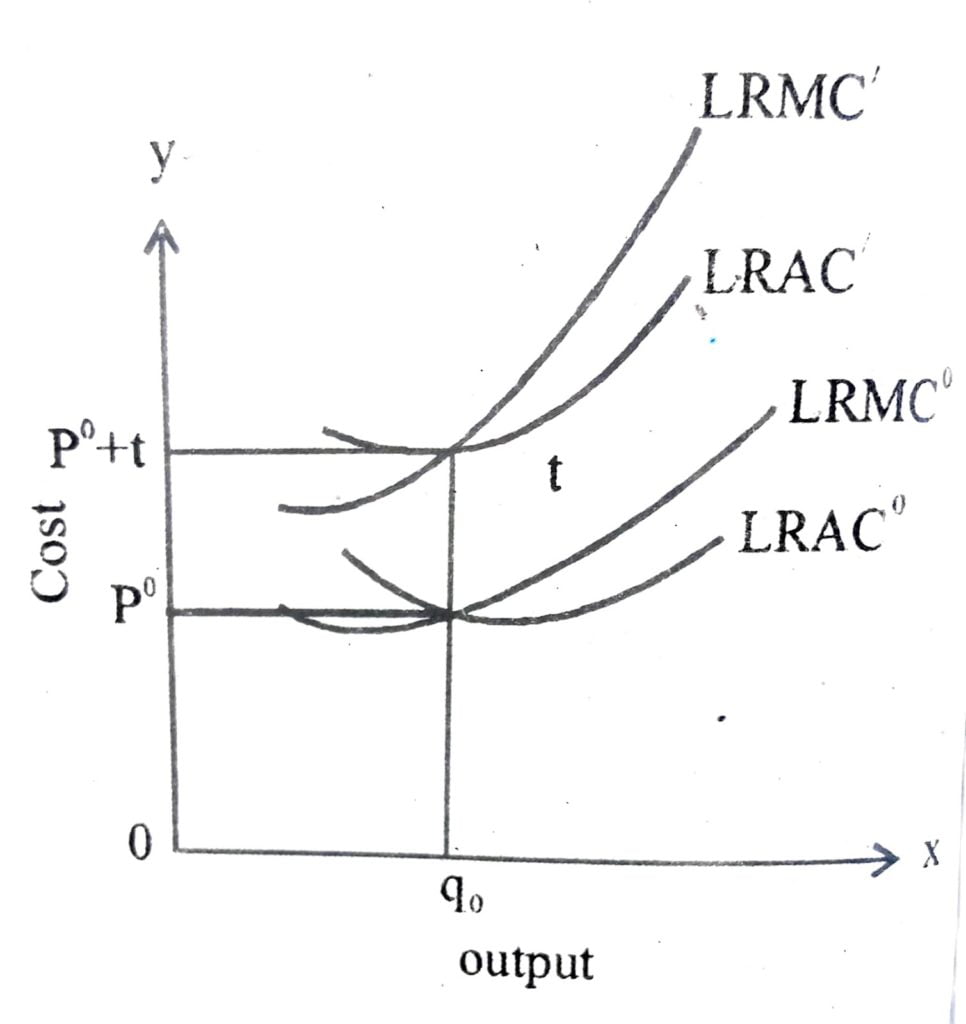
In the figure beside LRMC° and LRAC° are the long run marginal cost and the long run average cost curves of the firm. Now, suppose the government puts in place a unit tax of Rs. Since the firm must pay an extra Rs. t for each unit of the good produced, the firm’s long run average cost and long run marginal cost at any level of output increase by Rs. t. In the figure LRMC and LRAC respectively the long run marginal cost curve and the long run average cost curve of the firm after imposition of the unit tax. (LRMC’ is the supply curve)
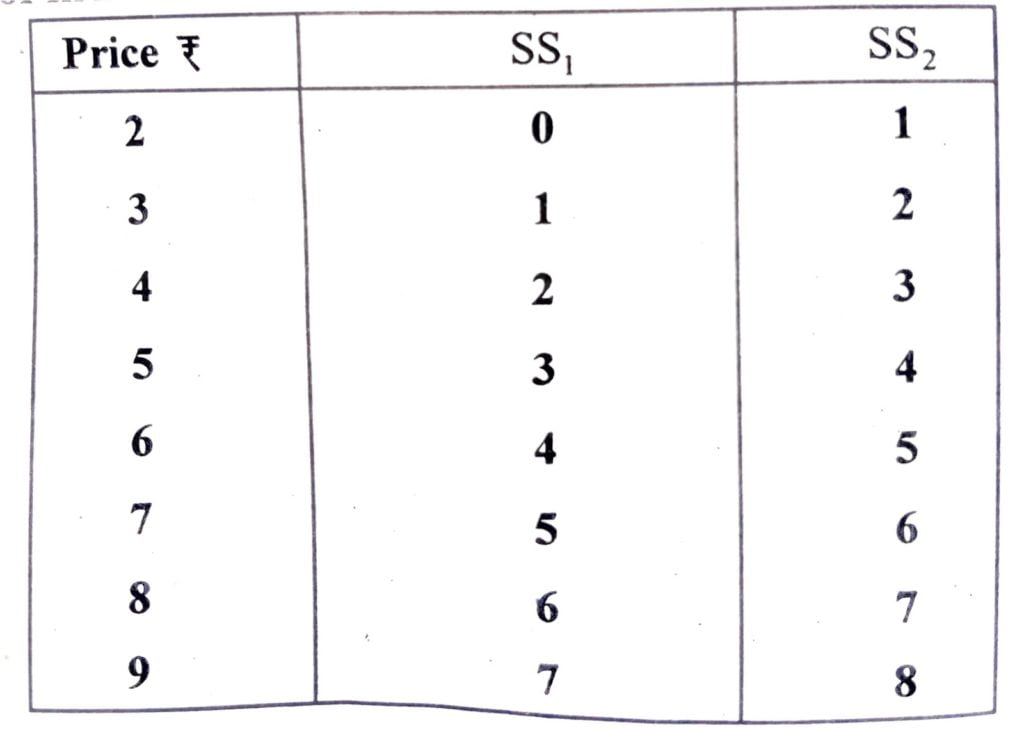
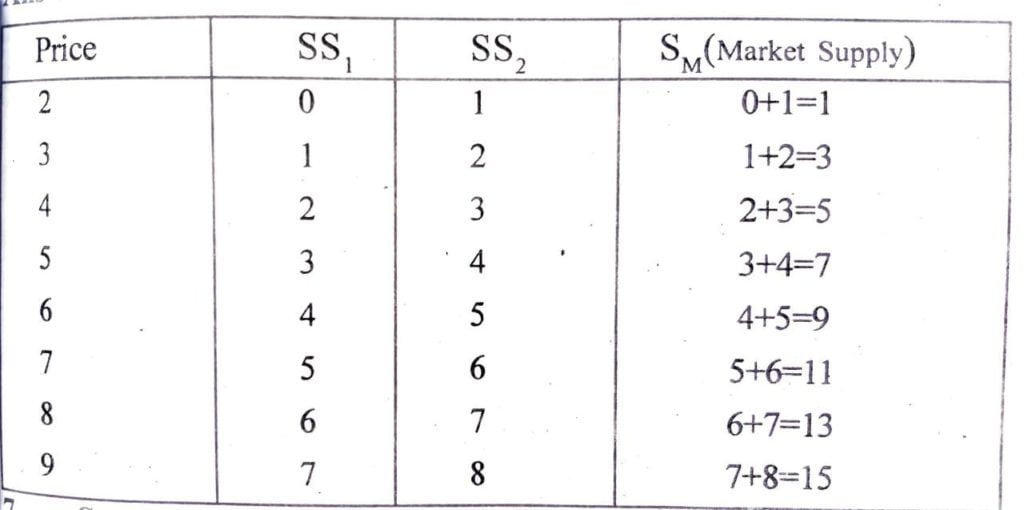
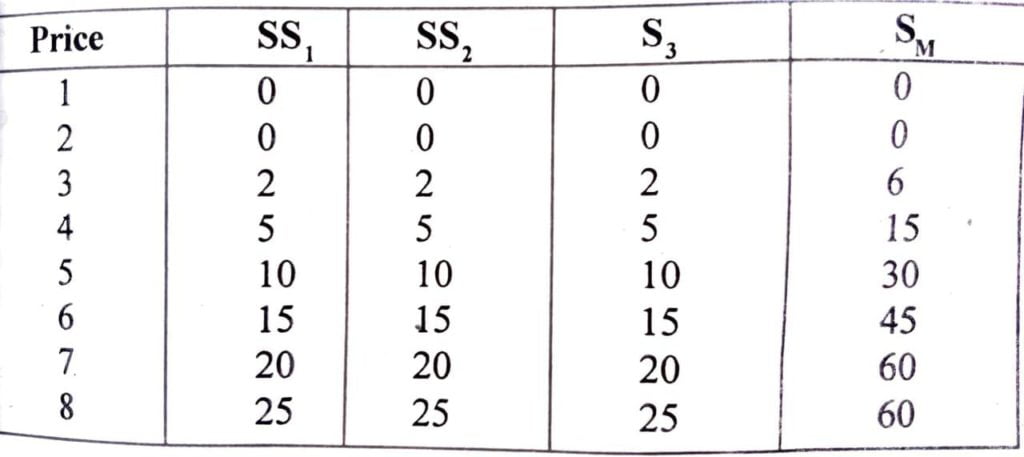
6. Suppose there are two firms in a perfectly competitive market. SS, is the supply curve of firm 1 and SS, is the supply curve of firm 2.
Ans:
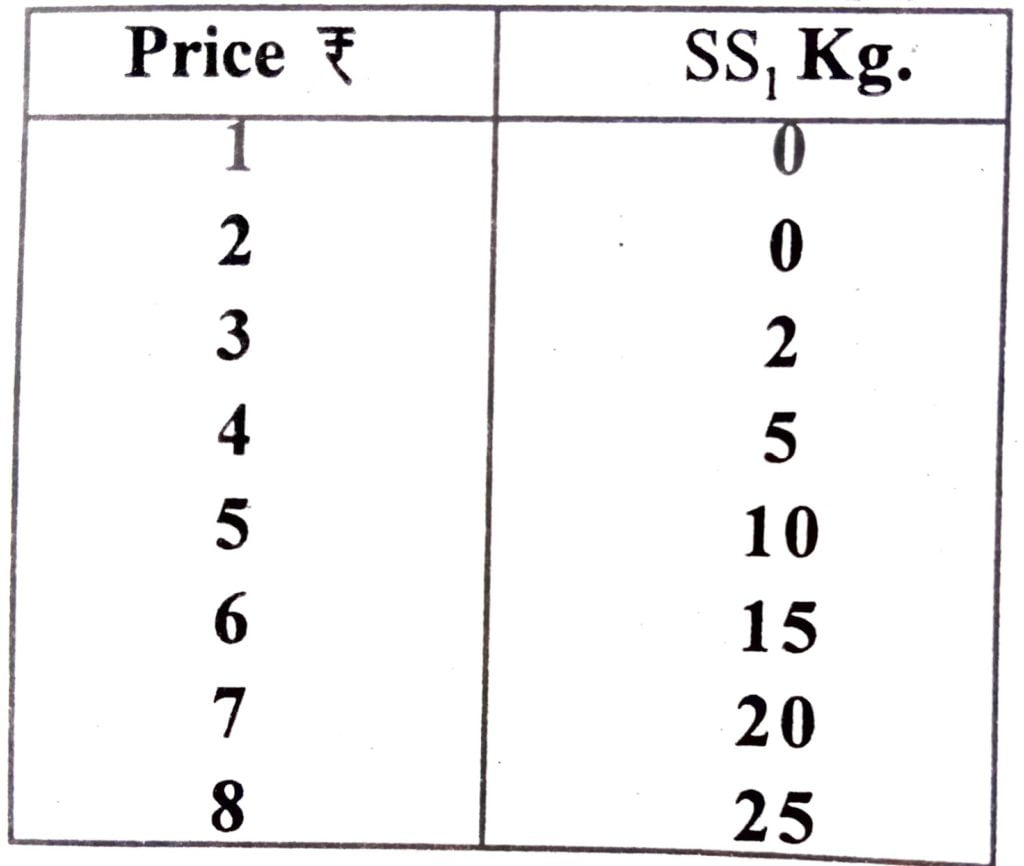
7. Suppose there are three firms in a perfectly competitive market. All these firms have similar supply curve (SS,). Draw the market supply curve as given in the supply schedule.
Ans:
8. Under perfectly competitive market, the total cost (TC) func- tion of a firm is given below. If the price of the commodity is Rs. 20, how much quantity of the commodity the firm would produce ?
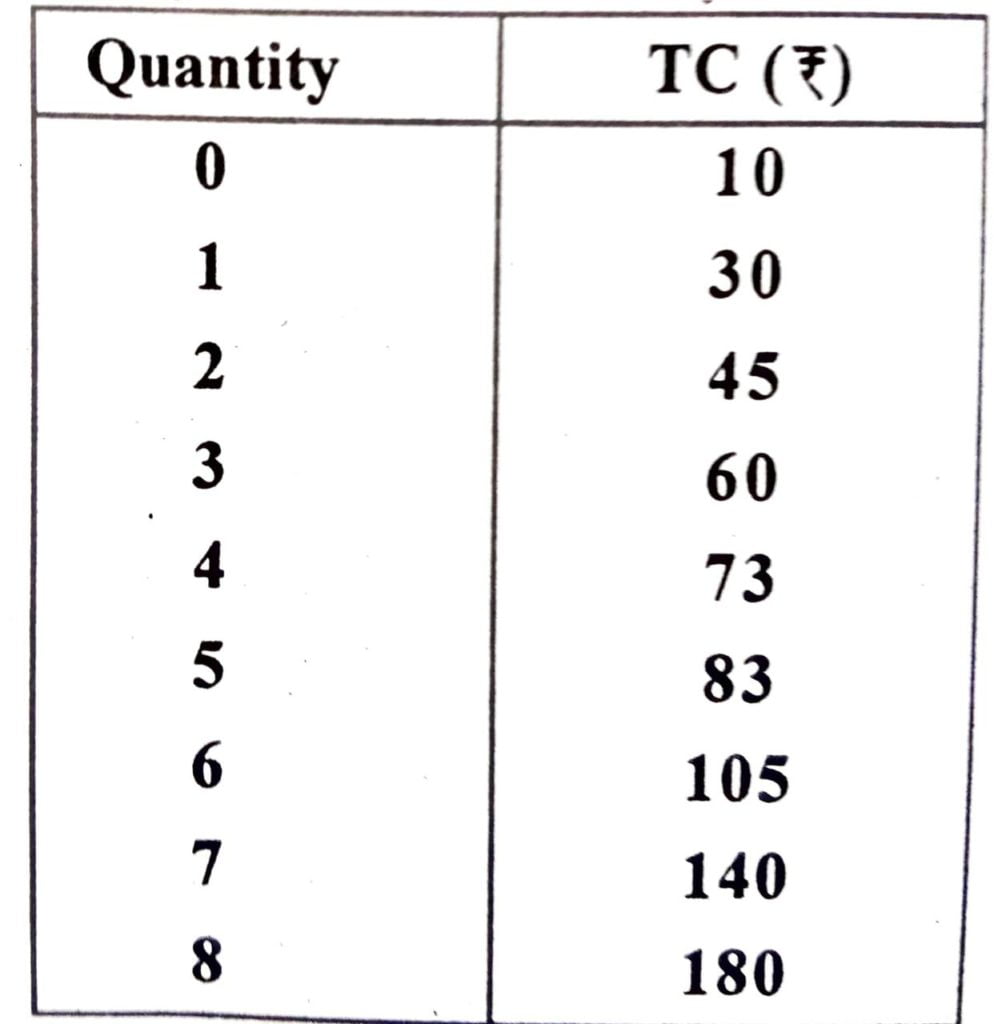
Ans:
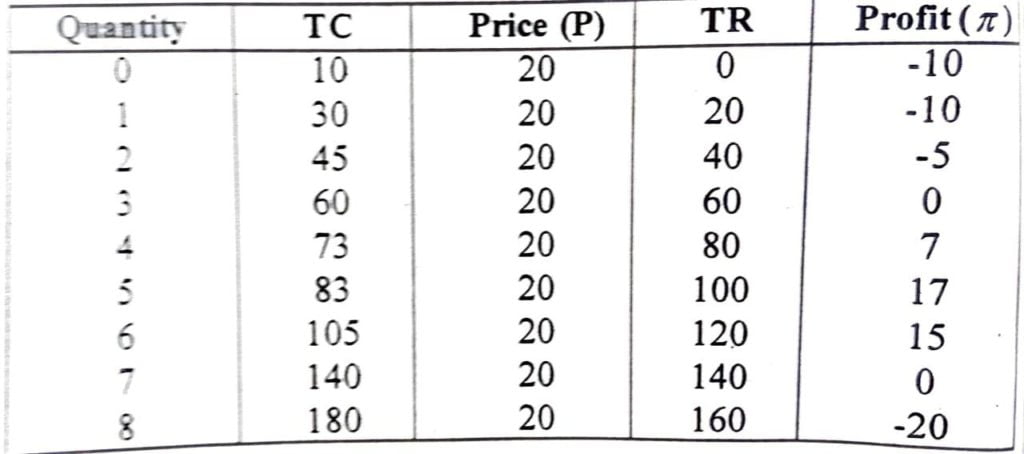
There are, at the 5th unit quantity, the level of profit 13 maximum, i,e., 17. Therefore, the firm earns maximum profit at this 5th unit level.
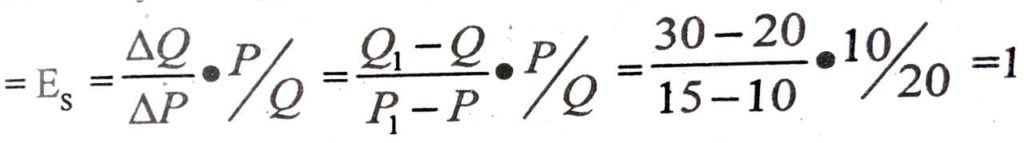
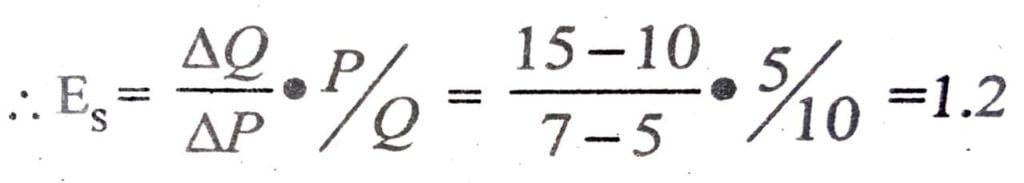
9. When the price of a commodity is Rs. 10, the quantity supplied is 20 units. As price increases to Rs. 15, the quantity supplied increases 30 units. Find out the elasticity of supply.
Ans: Gives P = 10
Q=20
Again, P₁= 15
Q₁ = 30
∴ Elasticity of Supply
10. When the price of a commodity is Rs. 5, the revenue receipt of a firm is Rs. 50, As price increases to Rs. 7 the total revenue receipt increases to Rs. 105, What is the elasticity of supply ?
Ans: Given,
TR = P.Q
∴ 50=5.Q
∴ Q = 10
Again, TR₁ = P₁ Q₁
⇒ 105= 7.Q₁
Q₁ = 15
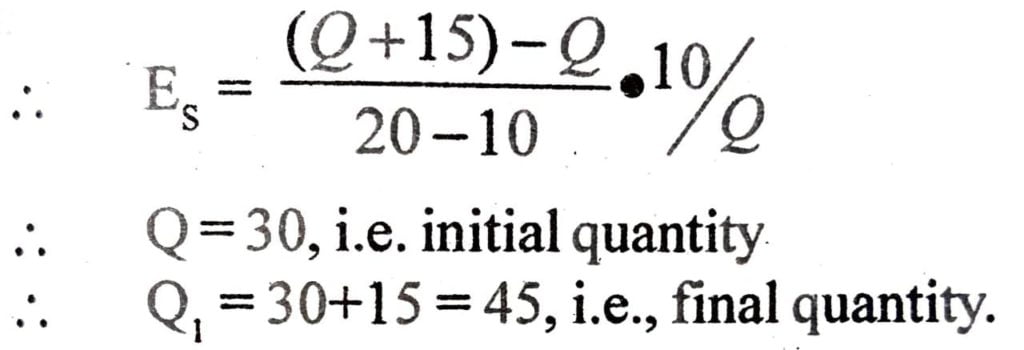
11. Suppose the price of a commodity increases from Rs. 10 to Rs. 20. As a result the total quantity supplied has increased by 15 units. It the elasticity of supply is 0.5, find out the initial and final level of supply of the firm.
Ans: Given, P=10,P₁=20
Let, the initial quantity be Q
∴ Q₁=Q+15
12. When the market price is Rs. 10, the firm supplies 5 units of a commodity. If the price increases to Rs. 20 and the elasticity of demand is 0.5, what will be the final level of output.
Ans : We know that,
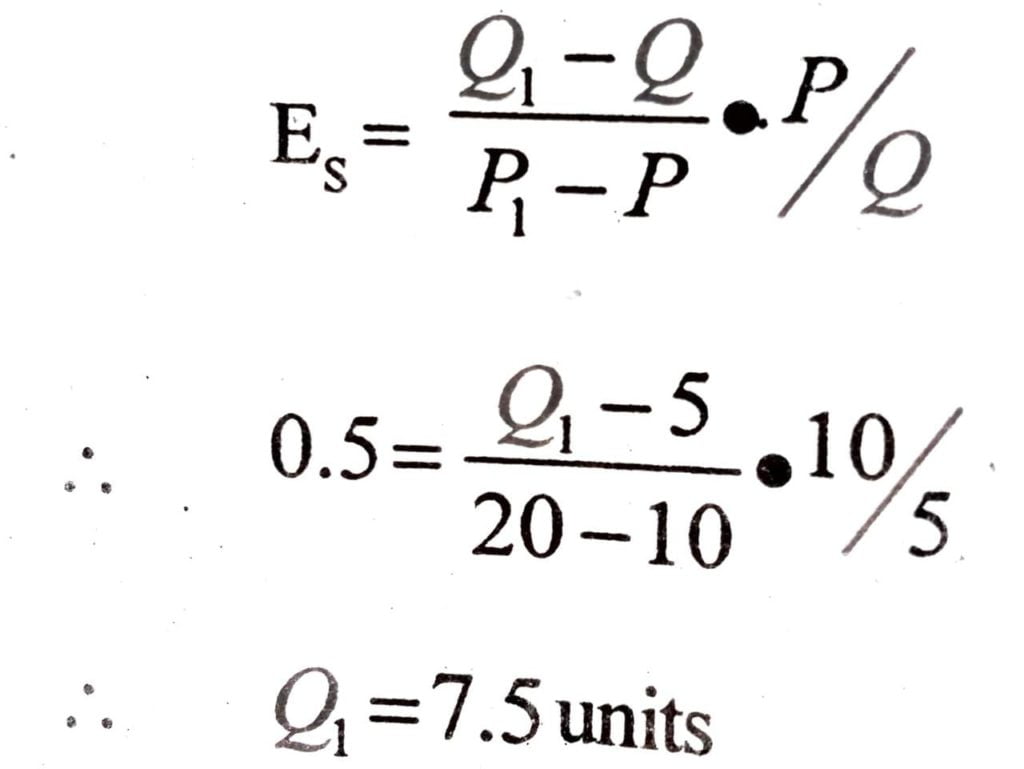
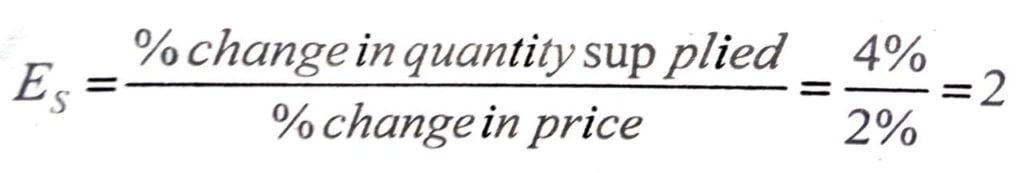
13. Suppose as a result of increases in the price level by 4% the quantity supplied in a market has increased by 2%. Now, calculate the elasticity of supply.
Ans : We know that,
14. Explain the long-run supply curve of a firm.
Ans : See Q. No. 5, (Short Type I)
15. A firm under perfect competition is producing 10 units of output. If the total revenue of the firm is Rs. 110, find out the equilibrium price of the commodity and average cost of equilibrium output level.
Ans : Given, Q = 10, TR= 110
∴ Equilibrium Price is TR = P. Q.
⇒P= TR/Q
=110/10
∴ P =11
16. Draw and explain the Price Line of a under perfectly competitive market with a suitable diagram.
Ans:
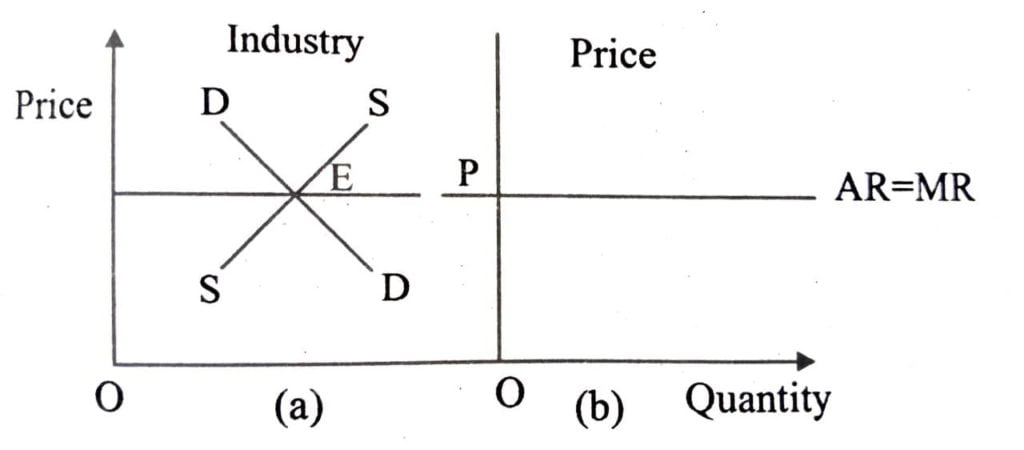
In Perfectly competitive market, the average revenue is the price line since the firm under perfect is a price taken and can not alter the price it can charge for the product it is selling, the average revenue is the same for all units of output sold. In this case, marginal revenue will also be constant and equal to the average revenue.
From the figure (a) shows the interaction of demand and supply curves of a commodity at point E determining the price at OP. In the figure part (b) shows that adoption of price by the price taking firms who are free to sell any quantity at this price. This makes AR curve perfectly elastic and thus parallel to the X-axis.
17. What are the characteristics of a Perfectly competitive market.
Ans : The characteristics of perfectly competitive market are :
(i) There are very large numbers of buyers and sellers.
(ii) Buyers have perfect knowledge of the market.
(iii) There is freedom of entry and exit for the new firms.
(iv) There is perfect mobility in the market both for goods and factors of production.
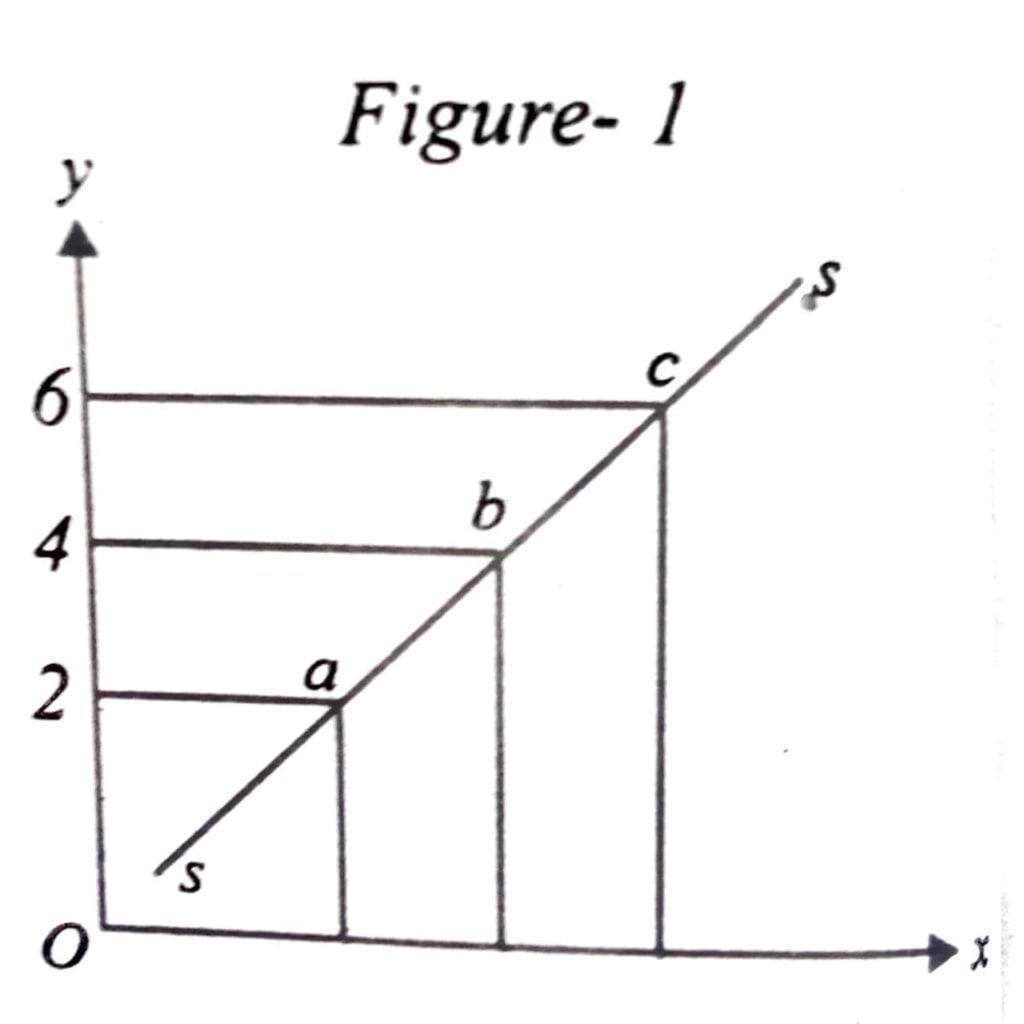
18. What is supply curve of a firm ? Draw various short-run supply curve of a firm under competitive market.
Ans: A supply curve is the graphical representation of the relationship between price of a commodity and the quantity supplied assuming all other factors influencing supply are held constant. It is obtained by joining all price quantity supplied combinations. Various short run supply curve of a firm are drawn below.
In figure (1) SS is the individual supply curve shows various quantities of a given commodity which an individual producer is willing to supply at different price during a given period of time. In the figure (1) OX axis quantity is measured and on OY axis prices are given. The curve slopes upward from left to right.
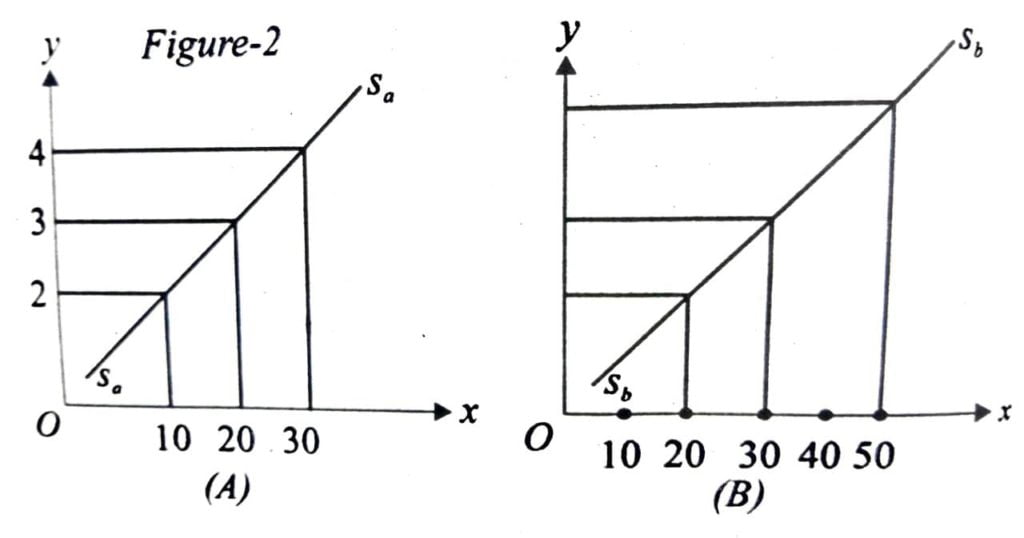
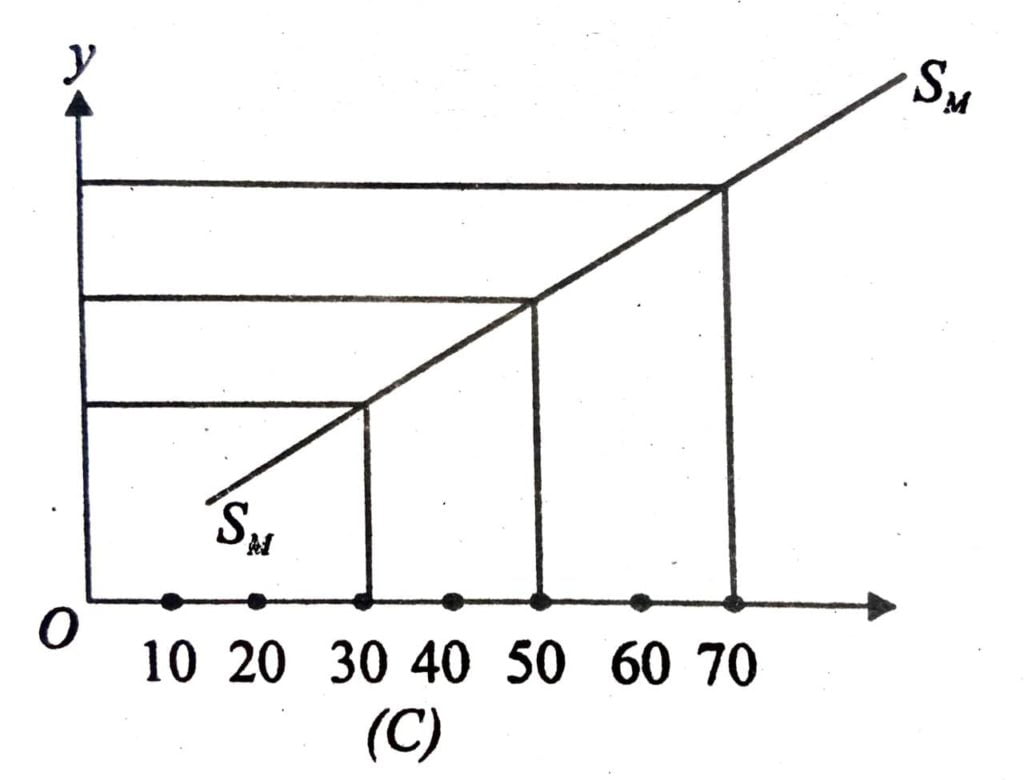
In figure (2)Sm Sm is the market supply curve. This is the curve which shows various quantities of a commodity which all the producers willing to produce sell at different prices during a given period of time. In figure a SₐSₐ the supply curve of firm (a) is drawn and in panel (b) SS, is the supply curve of firm (b) is drawn. In panel (c) the market supply Sm Sm curve is drawn by aggregating the two firms individual curves.
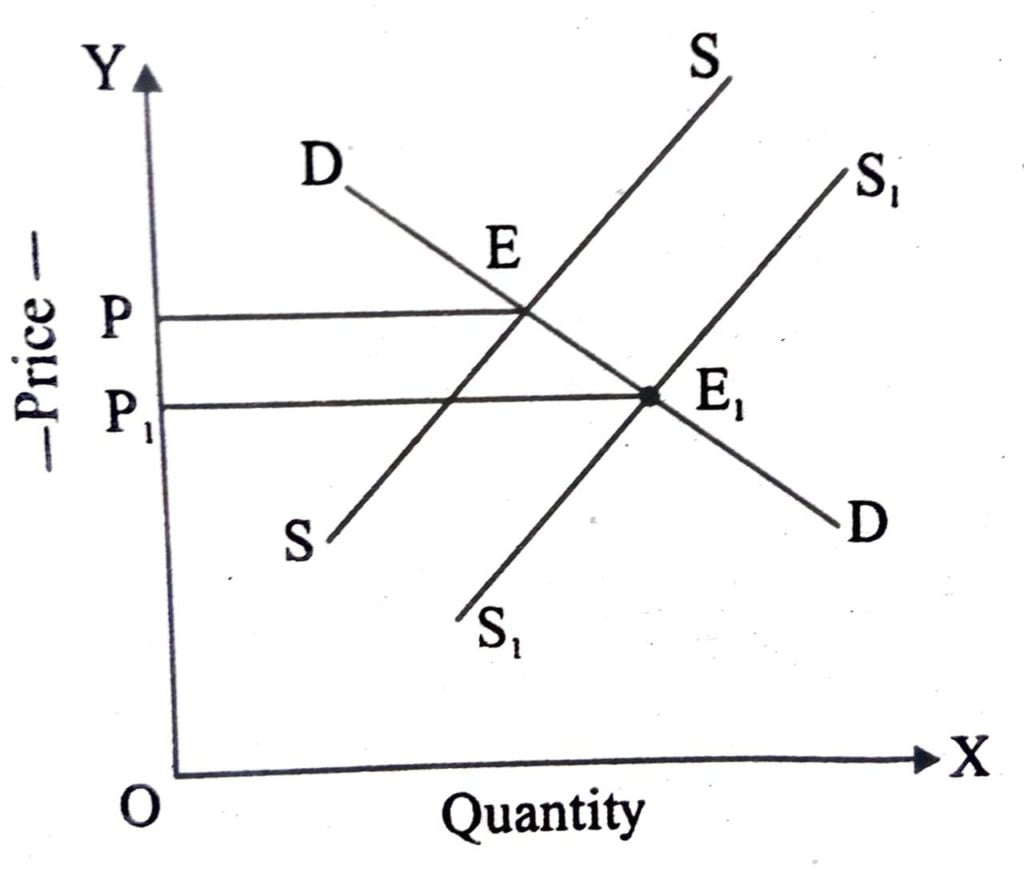
19. “Technological progress is expected to shift the supply curve of a firm to the right” Explain.
Ans: “Technological prayers is expected to shift the supply curve of a firm to the right.” Demand remains unchanged any increase in supply due to technological progress will lower the equilibrium price and increase the equilibrium quantity. In figure below OP and PE are the equilibrium price and quantity respectively. When supply S₁S₁ increases as represented by the rightward shifted supply curve S,S, equilibrium price falls to OP₁ and quantity increase to PE₁.
20. What is price elasticity of supply ? Draw two positively elastic and zero elastic supply curve.
Ans: Price elasticity of supply is a measure of the degree of responsiveness of quantity supplied to changes in the products own price.
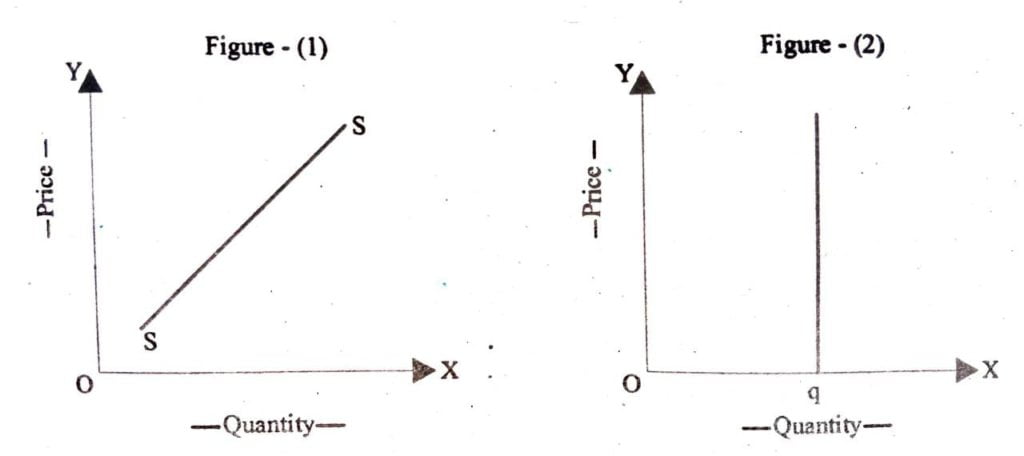
In figure (1) SS is the positively elastic supply curve and in figure (2) sq is the zero elastic supply curve.
21. Explain various factors that determine firm’s supply curve.
Ans: Factors that determines firm supply curve are as follow :
(1) Commodity’s own price : Price of a commodity is the most important determinant of its supply. The higher the price the larger will be the supply.
(ii) Price of other Goods : The supply of a commodity also depends upon the prices of other goods. An increase in the prices of other goods makes their production more profitable for the firms. Therefore, they will increase their supply.
(iii) Price of inputs : A firm uses different inputs like raw materials, machine, etc. in its production process. If prices of these inputs increase, then the profitability of the firm will fall. In such a case, the firm will supply less than before at the prevailing price level.
(iv) State of the Technology : If there is an improvement in production technology then it may be possible for the firm to produce more with the given resources.
(v) Number of firms : If the number of firms selling the same type of products in the market increases then, the supply of that product would increase in the market.
(vi) Future Expectations of rise in price : If the producers expect an increase in the price in the near future, then they will curtail the current supply, so as to offer more goods in future at higher prices.
22. “The market supply curve is obtained by the horizontal summation of the supply curves of individual firms.”Explain.
Ans: The market supply curve is the curve which shows various quantities of a commodity which all the producers are willing to produce and sell at different prices during a given period of time. The market supply curve is obtained by the horizontal summation of the supply curve of individual firms. It is explained with the help of a table where market supply schedule of individual firms are given by polling these schedule graphically we obtain the market supply curve which is shown in the diagram below.
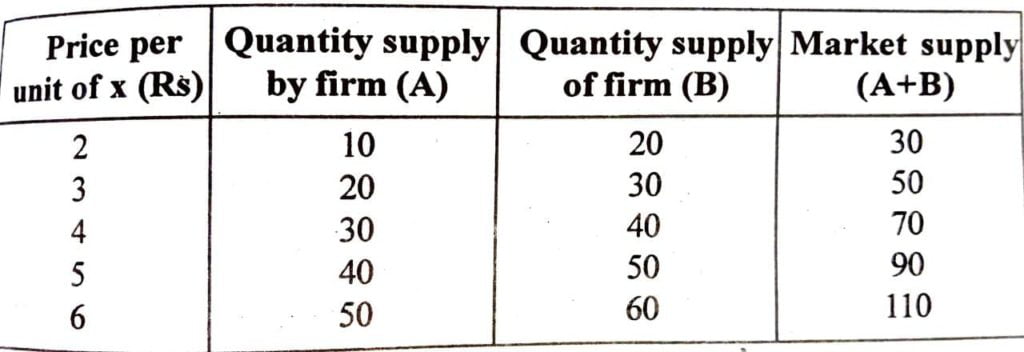
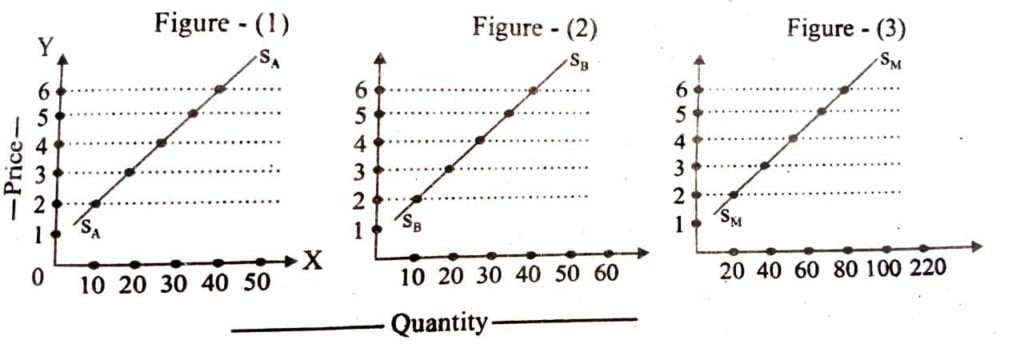
Figure (1) of the diagram, the supply curve SₐSₐ of firm A is drawn and figure (2) the supply curve of firm B is drawn. In figure 3 we have drawn the market supply curve Sm Sm by aggregating the individual supply curve SₐSₐ and S,S, of the two firms.

Hi, I’m Dev Kirtonia, Founder & CEO of Dev Library. A website that provides all SCERT, NCERT 3 to 12, and BA, B.com, B.Sc, and Computer Science with Post Graduate Notes & Suggestions, Novel, eBooks, Biography, Quotes, Study Materials, and more.
