
Class 11 Economics Chapter 2 Theory of Consumer Behaviour, (Assam Higher Secondary Education Council) AHSEC Class 11 Economics Question Answer in English Medium each chapter is provided in the list of AHSEC so that you can easily browse through different chapters and select needs one. Assam Board Chapter 2 Theory of Consumer Behaviour Class 11 Economics Question Answer can be of great value to excel in the examination.
AHSEC Class 11 Economics Chapter 2 Theory of Consumer Behaviour


Class 11 Economics Chapter 2 Theory of Consumer Behaviour Notes cover all the exercise questions in AHSEC Textbooks. AHSEC Class 11 Economics Chapter 2 Theory of Consumer Behaviour Solutions provided here ensure a smooth and easy understanding of all the concepts. Understand the concepts behind every chapter and score well in the board exams.
Theory of Consumer Behaviour
Chapter – 2
PART – A
VERY SHORT ANSWER QUESTIONS
1. Define utility.
Ans: Utility is the wants satisfying capacity of good.
2. What does the utility of a consumer represent ?
Ans: Utility of a consumer represents the satisfaction actual or expected, derived from the consumption of a commodity by a consumer.
3. What is budget set for a consumer ?
Ans: The set of the bundles of goods available to the consumer with his given income is called the budget set of a consumer.
4. What is budget line ?
Ans: The budget line represents all bundles of goods which cost the consumer entire income.
5. What is the slope of the budget line ?
Ans: The slope of the budget line is -Pₓ /Py.This implies that budget line has a negative or downward slope. The downward sloping budget line indicates that the consumer can buy extra units of commodity x only by sacrificing some units of commodity.
6. What does the slope of the consumer’s budget line determine ?
Ans: Number of one commodity sacrificed for an extra unit of another commodity.
7. What do the points below the consumer’s budget line indicate ?
Ans: The bundles of goods that cost less than his money income.
8. What does the rate of substitution between two goods measure ?
Ans: The marginal rate of substitution between two commodity x and y is written as MRSyx= ∆x/∆y. Marginal rate of substitution of x for y is defined as the amount of y the consumer is willing to give up to get one more unit of x and maintain the same level of satisfaction.
9. Why does an indifference curve slop downward ?
Ans: Because of the law of diminishing marginal rate of substitution .
10. Fill in the blanks:
In economics, it is generally assumed that the consumer is a ___ individual.
Ans: rational.
11. What does the rationality of a consumer indicate?
Ans: Maximum satisfaction attained by the consumer in consumption of a commodity.
12. Choose the correct portion :
The Optimum points of preference for a consumer would be located above the budget line/ below the budget line/on the budget lines.
Ans: Above the budget line.
13. Suppose X and Y are two variables and the value of Y depends on the value of X. Write whether the Y variable be called independent or dependent.
Ans: Dependent Variable.
14. Consider any two variable X and Y. the value of Y depends on the value of X. Write down the functional relation between the two variables.
Ans: Y = f(x).
15. In economics, dependent variable is measured along the vertical axis for graphical representation of a function. ― Write true or false.
Ans: True.
16. Fill in the blanks :
(a) The scope of the demand curve measures the ___ at which demand changes with respect to its price.
Ans: quantity.
(b) The set of bundles available to the consumer for preference is called the ___ set. (Alternative, budget)
Ans: budget.
17. What is a demand function ?
Ans: It is the technical relationship between the amount of quality demanded and the factors influencing demand, i.e. price, time, income etc. Symbolically
Qd=f (P, t, y……..)
18. What is normal goods ?
Ans: The quantity of a good that the consumer demands can increase or decrease with the rise in income depending on the nature of the good. For most goods, the quantity that a consumer chooses, increases as the consumer’s income increases and decreases as the consumer’s income decrease, Such goods are known as normal goods.
19. What is inferior goods ?
Ans: The consumer’s demand for a good can can increase or decrease with the rise in income depending on the nature of the good. There are some goods the demand for which move in the opposite direction of the income of the consumer. Such goods are called inferior goods.
20. Define complementary goods.
Ans: There is a relation between the quantity of a good that a consumer chooses and the price of a related good. The quantity of a good that the consumer chooses can increase or decreases with the rise in the price of a related good. But there are some goods which are consumed together. These type of goods are complementary to each other Examples of goods which are complementary to each other are tea and sugar, shoes and socks, pen and ink etc.
21. Give one example of complementary good.
Ans: There is a relation between the quantity of a good that a consumer chooses and the price of a related good. The quantity of a good that the consumer chooses can increase or decreases with the rise in the price of a related good. But there are some goods which are consumed together. These type of goods are complementary to each other Examples of goods which are complementary to each other are tea and sugar, shoes and socks, pen and ink etc.
22. Choose the correct one :
The demand for good usually moves in the opposite direction of the price of its substitutes/complementary good.
Ans: Complementary good.
23. Write true or false :
The elasticity of demand is pure number.
Ans: True.
24. A consumer’s total utility has been found to be 60 after consumption of 5 units of a commodity. His total utility was 56 after the consumption of 4 units. Calculate his marginal utility.
Ans:
Given,
Total Utility at 5 unit = 60
and total utility a 4 Unit = 56
∴ Marginal utility

25. It the price of a commodity increased by 10% and the total expenditure of the consumer on that commodity remain constant.
― What is the elasticity of demand?
Ans: It is equal to one.
26. State the meaning of consumer’s budget constraint.
Ans: When prices of the commodities and quantity demanded of the commodities are limited by the money income of the consumer, it is known as consumer’s budget constraint.
27. Give the meaning of the rate of substitution between two goods.
Ans: The marginal rate of substitution between two commodity x and y is written as MRSyx= ∆x/∆y. Marginal rate of substitution of x for y is defined as the amount of y the consumer is willing to give up to get one more unit of x and maintain the same level of satisfaction.
28. What is convex preference ?
Ans: If between any two bundles the consumer prefers the bundle which has more of at least one good and no less the another goods, as compared to the other bundles.
29. What is an indifference curve ?
Ans: An indifference curve refers to the graphical representation of all possible combination of two goods which gives the consumer equal level of satisfaction.
30. What is a giffen goods ?
Ans: When the demand for goods decreases with the fall in its price and increase with the rise in its price is known as giffen good.
31. The total utility of a consumer is found to be 80 after consumption of 10 units of a commodity. The marginal utility he derives from the consumption of 11 th unit is 9. Find out the total utility after consumption of 11 units.
Ans: Total utility is 89.
32. The total utility of a consumer has been found to be 70 after consumption of 10 units of a commodity. His total utility decreases to 60 if he reduces his consumption by one unit. Calculate the marginal utility of the consumer.
Ans: Marginal utility is 10.
33. If elasticity of demand is zero and price of a commodity is decreased by 10% what will be the change in quantity demanded ?
Ans: Quantity demanded will not change, it is equal to zero.
34. If the percentage in quantity demanded is equal to the percentage change in price, what is the price elasticity of demanded ?
Ans: Unitary Elastic Demand or Ed = 1.
35. Why is production possibility frontier called the opportunity cost curve ?
Ans: Because Production Possibility frontier is based on the concept of opportunity cost.
36. Define final goods.
Ans: Final goods are those goods which are ready to be consumed by the consumer.
37. What is consumption bundle.
Ans: Consumption bundle are combination of two or more goods that he can by which costs him less or equal to his income.
38. Draw a consumer’s budget line
Ans:

39. Explain how price elasticity of demand for a good depends on its nature.
Ans: Price elasticity of demand depends on the nature of the goods whether the goods are normal, luxuries, necessities etc. For example if the goods are luxuries, the price elasticity of demand is greater than 1.
40. What is shut down point of a firm ?
Ans: A firm can continue its production for the long run even if it incurs loss within a certain limit. During the short run, if it exceeds the time of loss, it has to shut down. The point at which the firm fails to cover it’s average variable cost is known as shut down point.
41. The monthly income of a consumer is Rs. 400 and he spends this income entirely on two commodities, X and Y. The price of the commodity X is Rs 20 and that of Y is Rs.25. On the basis of these information.
(i) draw the budget line of the consumer.
Ans: (i) Here the two goods are X and Y
Price of good X is Rs. 20
Price of good Y is Rs. 25
Income of the consumer = Rs. 400
The equation for budget line is 400=20x+25y

SHORT ANSWER QUESTION TYPE – II: (MARKS: 3)
1. State the assumptions under which the demand curve of consumer is drawn.
Ans: Assumption of the law of demands: Law of demand holds good when “other things remain the same”. It means, factors influencing demand other than price are assumed to be constant. These constitute the assumptions of the law. It applies to normal goods and not to Giffen goods.
The main assumption of the law are as follows:
(a) Tastes and preferences of the consumers remain constant,
(b) There is no change in the income of the consumer,
(c) Prices of the related goods do not change,
(d) Consumer do not expect any change in the price of the commodity in the near future.
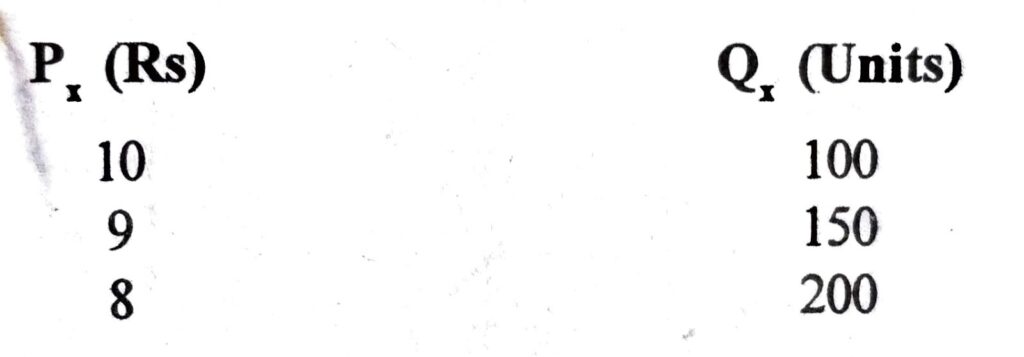
Law of demand may be explained with the help of demand schedule:
Demand schedule:

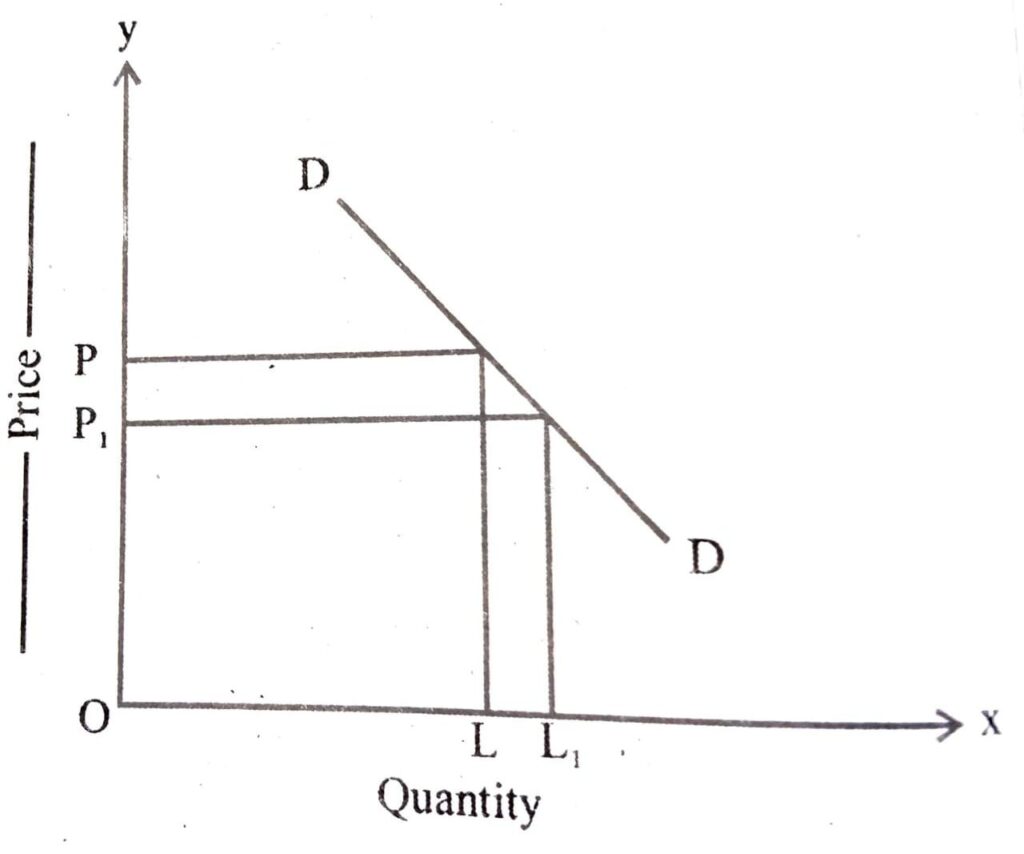
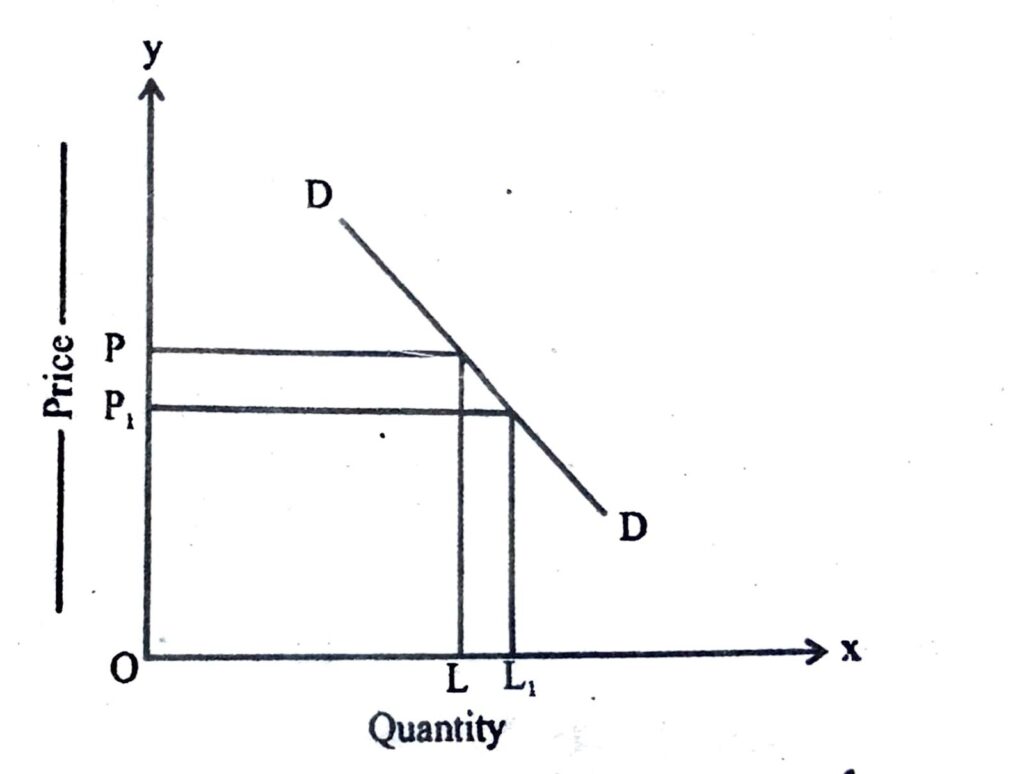
The schedules shows extension of demand in response to decrease in price of the commodity. Thus, demand stretches from 100 to 150 units when price reduces from Rs. 10 to Rs.9 per unit. It may be further illustrated with the help of demand curve. In the figure below DD is the demand curve which shows the demand for commodity. On the ox axis quantity is measured and oy axis, price of the commodity is measured. When the price of commodity x is OP, the demand is OL but when the price of x fall from OP to OP1, the demand extend from OL to OL1. The downward slope of demand curve is an expression of the law of demand.
2. Define price elasticity of demand.
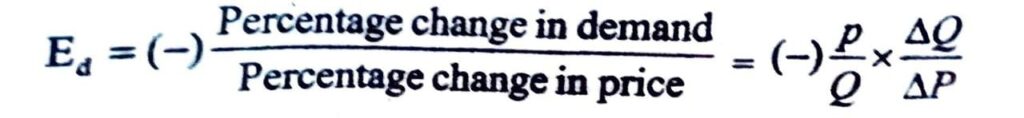
Ans: Price elasticity of demand is percentage change in demand divided by percentage change in price. The price elasticity of demand tells us that percentage fall in demand due to percentage rise in price and percentage rise in demand due to percentage fall in price. In other words, price elasticity of demand is the degree of responsiveness of demand for the commodity to a charge in its price. i.e.- Percentage
Ed = (―) Percentage change in demand/ Percentage change in price = (―) P/Q× ∆Q/∆P.
3. What is budget line? Why does it slope downward ?
Ans: Budget line represents all bundles of two goods which a consumer can by with his entire income and given prices of the goods.
The slope of the budget line is – Px/Py. This implies that budget line has a negative or downward slope. The downward sloping budget line indicates that the consumer can buy extra units of commodity x only by sacrificing some units of commodity y.
4. What is monotonic preference of a consumer ?
Ans: A monotonic preference in which between any two bundle of goods, the consumer prefers the bundles which has more of at least one of the goods and no less of the other goods compared to the other bundles.
5. What is diminishing rate of substitution ?
Ans: The law of diminishing marginal rate of substitution states that the consumer will be willing to forgo smaller and smaller units of one good ( say, y) to have successive additional units of another good (say, x). We can explain the law with the help of the indifference schedule.
Table : Marginal Rate of substitution.

In table above, all the combinations give the same satisfaction to the consumer. If he chooses combination A, he gets one good A and fifty good ‘B’. In combination ‘B’ , he get one more ‘A’ and is prepared to give twelve ‘B’ for it. The MRS here is 1:12. In combination C, he is willing to sacrifice only ten good B for another ‘A’. The MRS falles to become 1:10. In the successive combination D, E and F, the MRS continues to fall. This illustrates the diminishing rate of substitution.
6. What does an indifference map indicate ?
Ans:
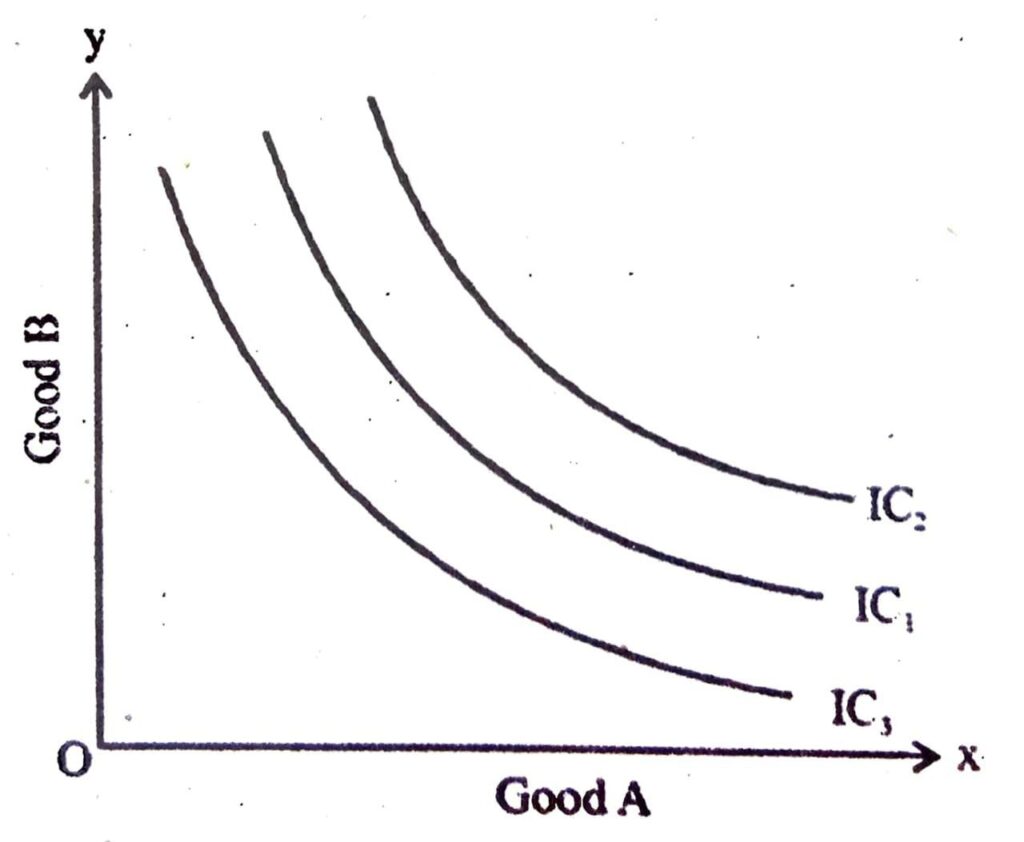
The consumer’s preferences over all the bundles can be represented by a family of indifference curves. The set of indifference curve representing the different levels of satisfaction obtainable from different schedules of indifference is called an indifference map. This is shown in the figure.
All points on an indifference curve represents bundles, which considered indifferent by the consumer.
Monotonicity of preference imply that between any two indifference curves, the bundles on the one which lies above are preferred to the bundles on the one which lies below.
7. What is a demand curve? What does it indicate ?
Ans: Demand curve is a graphical presentation of demand schedule, showing different possible quantities of a commodity to be purchased against different possible prices.
Demand curve slopes downward and its slope shows that there is inverse relationship between price of a commodity and it’s quantity demanded.
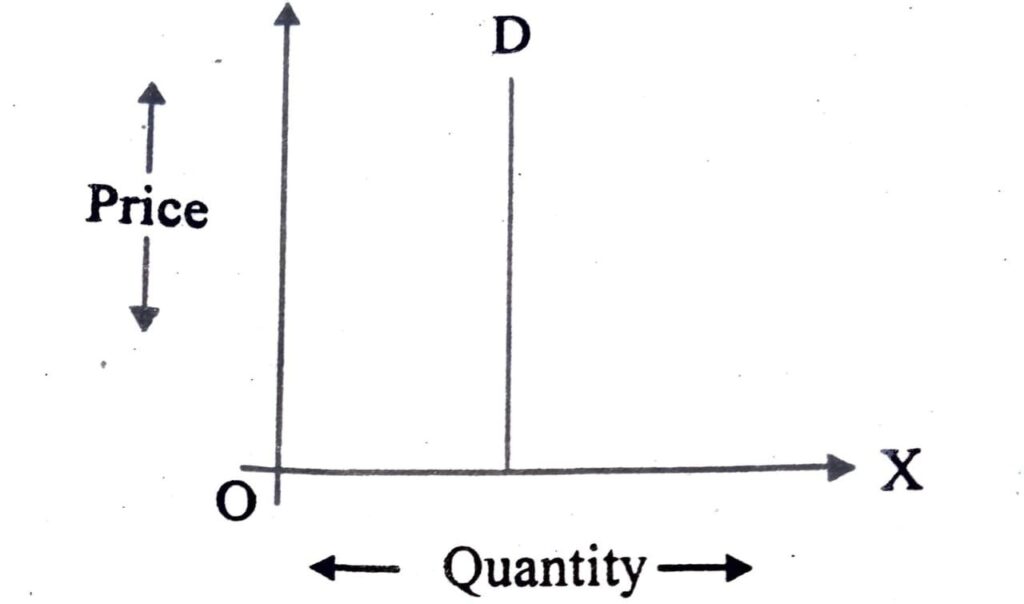
8. Draw a vertical demand curve and state the nature of price elasticity on it.
Ans: The nature of price elasticity is perfectly inelastic i.e., ed=0.
9. Describe how price elasticity of demand for a good depends on its nature.
Ans: In case of necessary goods the nature is elastic.
Again, in case of luxury goods the nature is highly elastic.
In case of giffen goods the nature is perfectly inelastic.
10. The total money income of a consumer is M and he spends his entire money income on the consumption of two commodities, viz. X and Y the prices of X and Y are PC and Py and Py respectively. State the budget equation.
Ans: The budget equation is pxqx+pyqy=M
11. Two combination of X and Y available to a consumer be indifferent between these two combination ?―Explain.
Ans: No, the consumer will be not indifferent in between these two combinations, because both the combinations will give the same level of satisfaction.
12. A student of H.S 2nd year is indifferent between two combinations (10, 6) and (8, 6) of two goods X and Y. Explain whether his preference is consistent or not.
Ans: The consumer preference is not consistent. Because, he would have preferred (10, 6) over (8, 6) as it contains more of one commodity and no less of the other commodity.
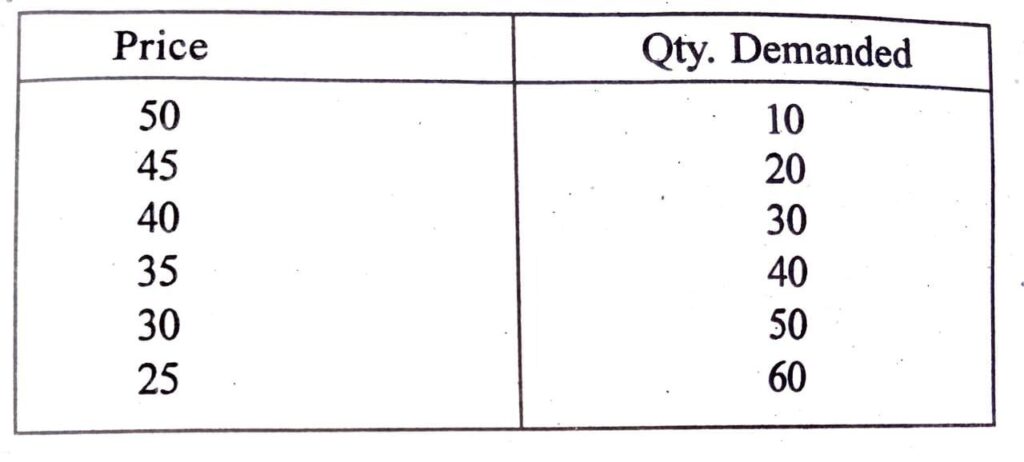
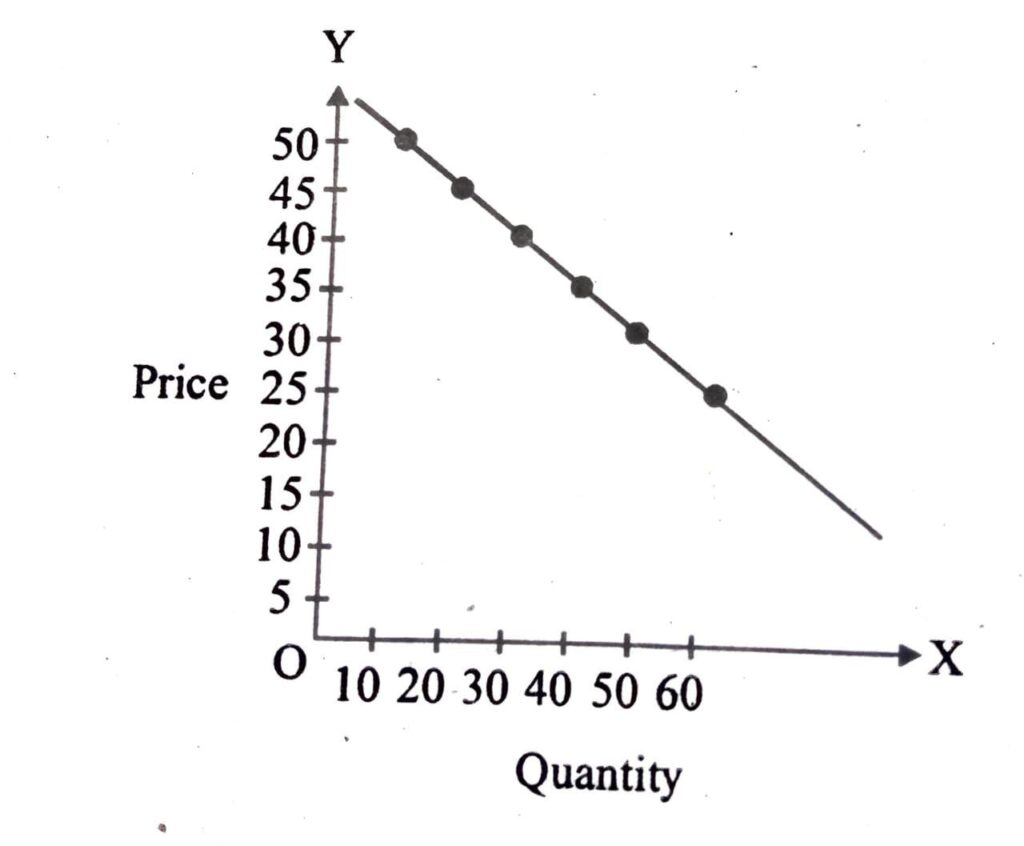
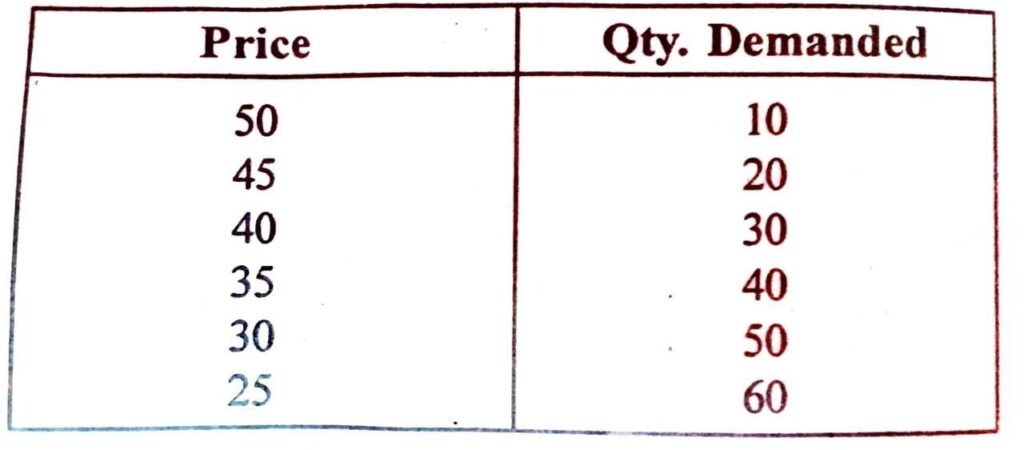
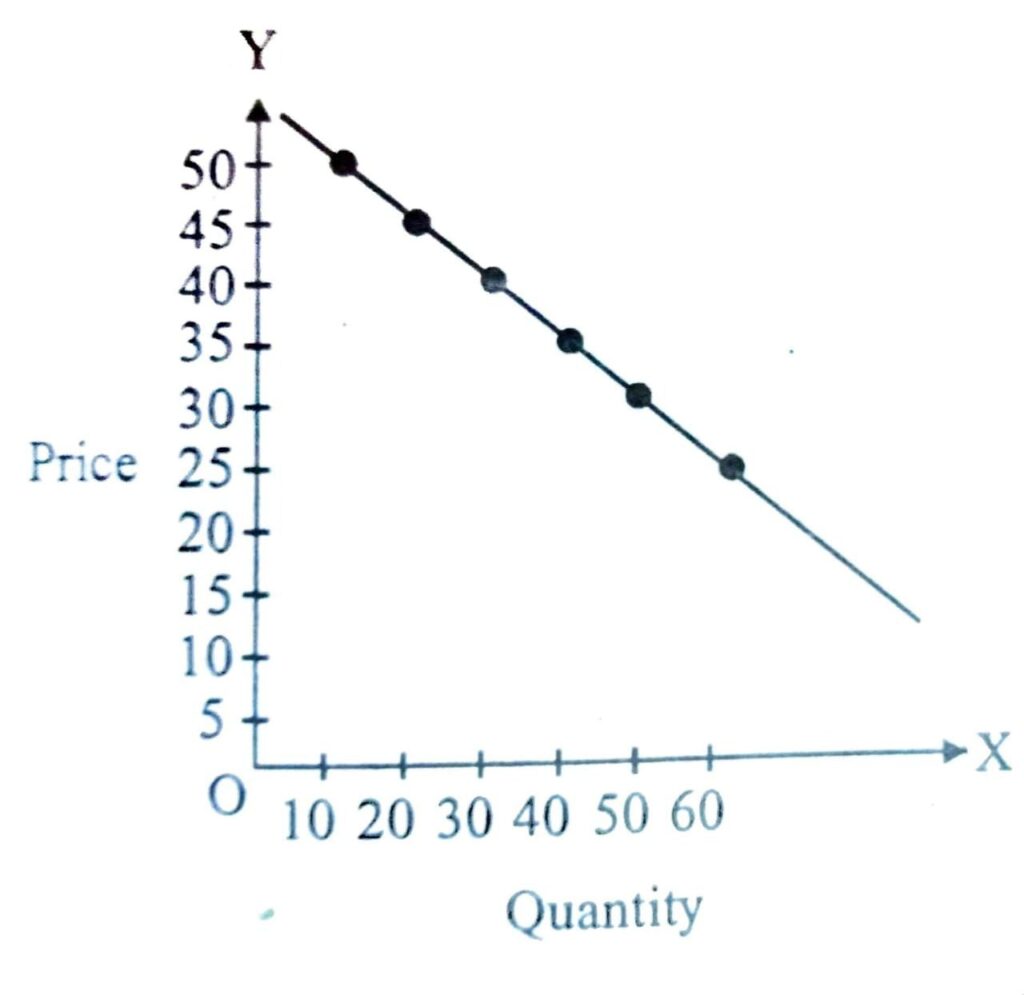
13. The following table contains different combination of price and quantity demand for a commodity. Draw a demand curve.
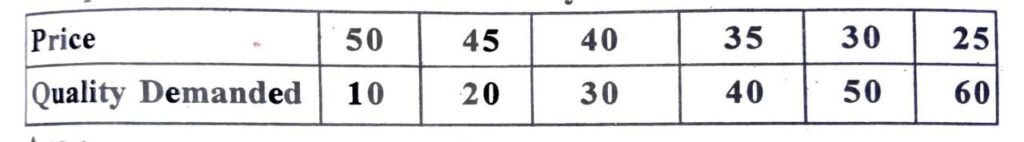
Ans:
14. When the price of a commodity is Rs. 10, the quantity demanded is 20 units. Suppose price decreases to Rs. 8 and quantity demand becomes 15 units. Calculate the elasticity of demand.
Ans:
15. Suppose with the increase in the price of a commodity by 4% the total expenditure on that commodity increased by 3% . Explain the nature of the commodity.
Ans: The nature of the commodity is inelastic, because when price of the commodity increase the total expenditure also increases.
16. Draw an indifference curve and state the reason behind its downward slope.
Ans:
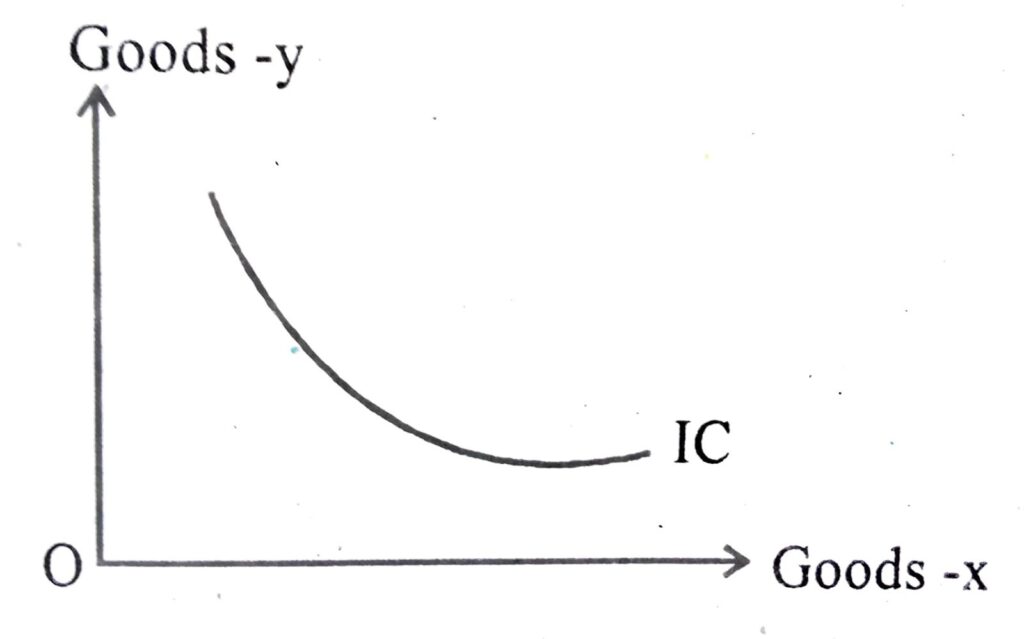
The reasons behind for its downward slope is the operation of the law of diminishing marginal rate of substitution.
17. Distinguish between substitutes and complementary goods.
Ans: See Q. No. 6 (Short types I)
18. Bring Out the differences between substitutes and complementary goods.
Ans: See Q. No. 6 (Short types I)
19. ‘The demand for luxury good is more price-elastic’―Explain.
Ans: The demand for luxury good is more price-elastic, because in case of luxury goods the percentage change in demand is more than the percentage change in price. This means that the quantity demanded responds to a greater extent than the given change in price.
20. State the concept of utility function.
Ans: Utility is the sum total of the satisfaction that a consumer derives when a certain number of units of a particular commodity is consumed. In other words, utility is a function of various quantities of a commodity. It can be expressed as―
Uₓ=F(Nₓ)
where Uₓ=utility from the consumption of x goods
F= Functional relationship
Nₓ= Number of units consumed.
21. Suppose the student of class v prefers a combination (10, 2) to another combination (9, 1). Can his preference be called as consistent ?
Ans: No, the consumer preference is not consistent. Because, he would have preferred (10, 2) over (9, 1) as it contains more of one commodity and no less of the other commodity.
22. Suppose the price of a commodity is Rs. 10 and the quantity demanded is 20 units. Calculate the price elasticity of demand , if the price increase to Rs. 15 and quantity demanded increase to 15 units.
Ans: Same as Q. No. 14( Short types-II)
23. A person is indifferent between two combinations (10, 10) and (5, 5) of two goods. Explain whether his preference is consistent or not.
Ans: The consumer preference is not consistent. Because, he would have preferred (10, 10) over (5, 5) as it contains more of one commodity and no less of the other commodity.
24. Let the income of one individual is Rs. 200 and he spends his entire money income on two commodities, bread and banana. If the per unit price of bread is Rs. 20 and the price of banana is Rs. 10 per units, state the budget equation of the consumer and draw the budget line.
Ans:
Let, the bread be =x
the banana be = y
∴ The budget equation is ―20x+10y=200
The budget line is ―
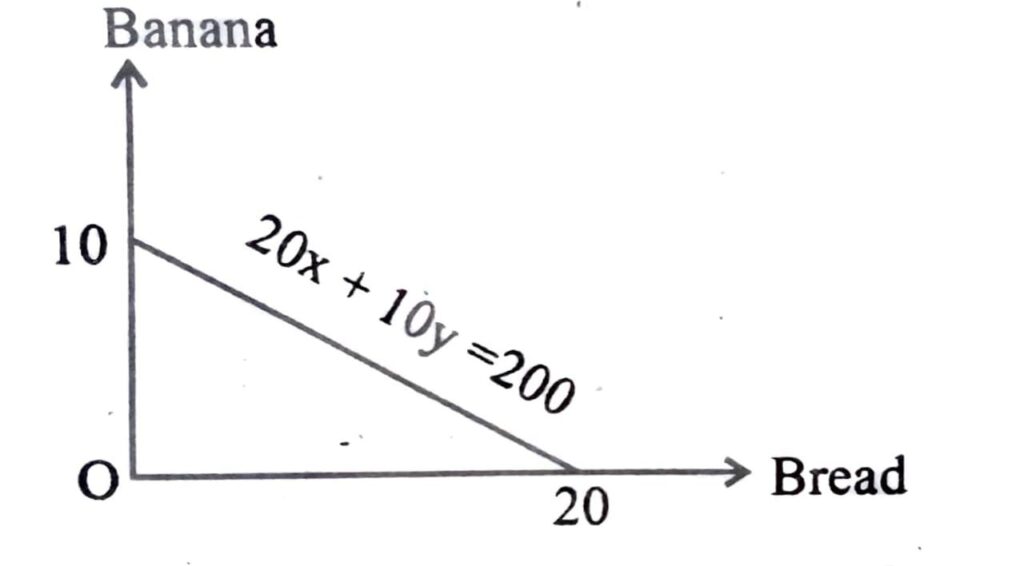
25. Let the income of the consumer is M and he spends his entire money income on two commodities x and y. If the price of commodity x is Px and the price y is Py―
(i) Draw the consumer’s budget line.
(ii) How the budget line will shift if the income of the consumer increases from M to M1.
Ans: Same as Q. No. 10 (Short Types-II)
26. The following table contains information regarding the price (Px) of and quantity demanded for a commodity. Draw the demand curve :
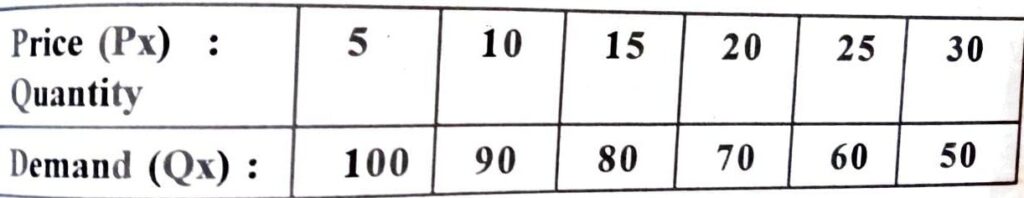
Ans: Same as Q. No. 13 (short types-II)
27. Explain the market demand for a good.
Ans: Market demand for a good is the aggregate demand of all individuals for that commodity at various possible price and in a given time period. Since market demand is the total demand off all individuals, it is influenced by all those factors that affect individuals demand, market demand is influenced by factors like population, distribution of income, season and weather.
28. Mention the factors determining price elasticity of demand for goods.
Ans: The factors determining price elasticity of demand for goods are:
(i) Availability of close substitutes: If close substitute of a good are really available, its price elasticity of demand is likely to be high, because even a very small increase in price will make consumers to switch over to other goods in big way and vice versa.
(ii) Habits: Habits also play a role in the determination of elasticities if a person has developed the habit of smoking, he may not be able to reduce his consumption of cigarettes even when the price of cigarettes goes up. His demand for cigarettes will be inelastic.
(iii) Period of time: If the price of a product rises, consumers will search for cheaper substitutes. The longer period they have, the more likely they are to find the one.Demand will, therefore, more price elastic in the long run.
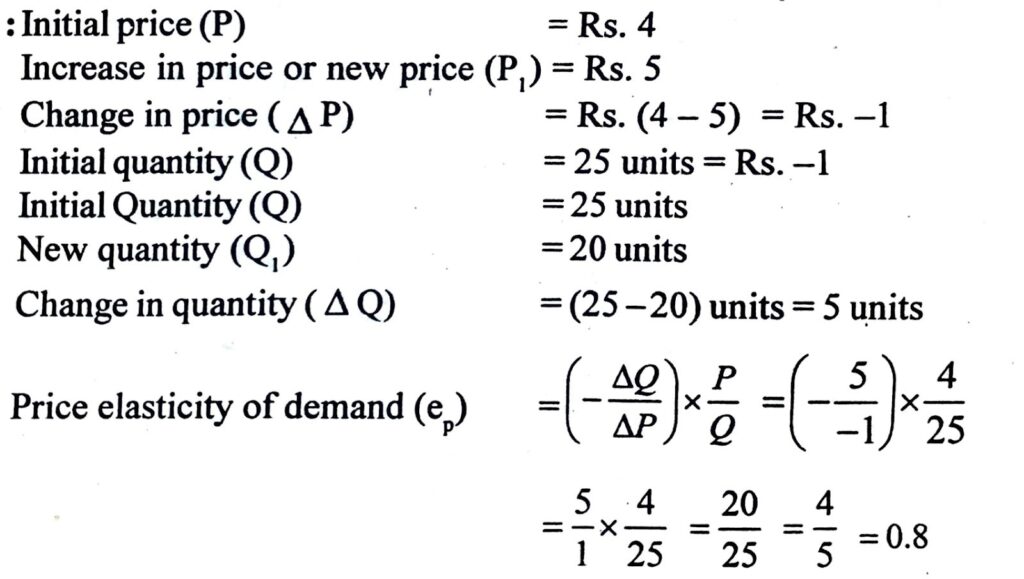
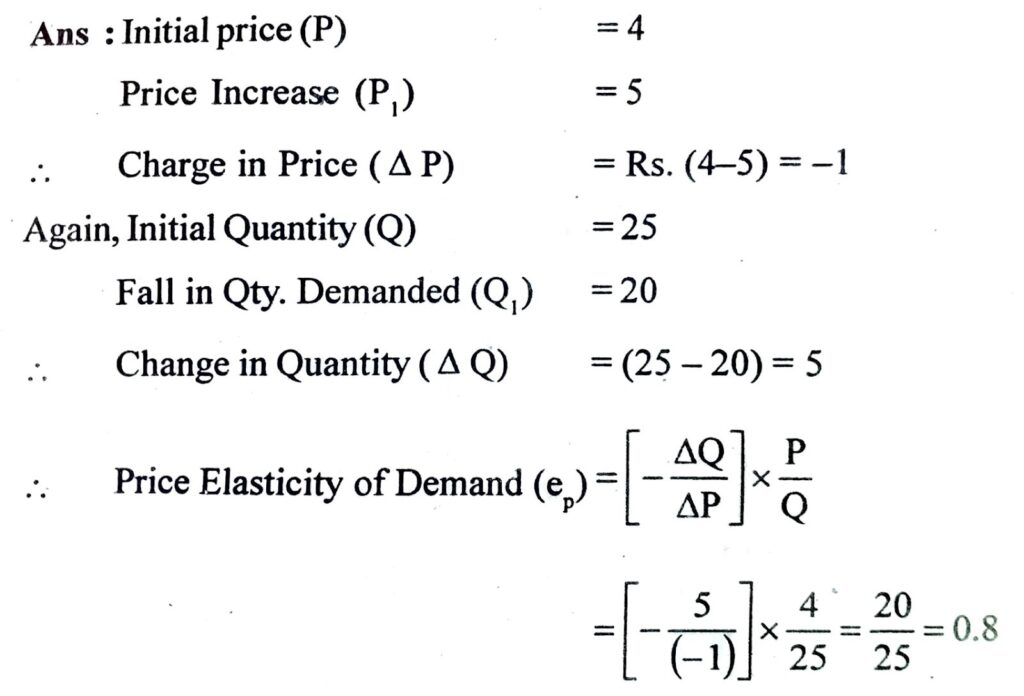
29. Suppose, when the price of a good is Rs. 4, the quantity demanded is 25 units. As price increase to Rs. 5, the quantity demanded falls to 20 units. Calculate the price elasticity of demand.
SHORT ANSWER QUESTIONS TYPE -1: (MARKS : 4)
1. The monthly income of consumer is Rs. 300 and he spend his entire income on two commodities x and y. Price of x and y Rs. 15 and Rs. 25 respectively. Let the income of the consumer increase to Rs. 450. Show the impact of the changes in income the budget line.
Ans: In the first stage when consumer income is Rs. 300
Purchase of X = 300/15=20
and purchase of Y = 300/25 = 12
Now, Given, the consumer’s income changes to Rs. 450
Then, Purchases of X= 450/15 = 30
Purchase of Y = 450/25 = 18
Thus, the impact is that the budget line will shifts to the right parallel.
2. A consumer with his given money income can buy 20 units of the commodity x and 12 units of the commodity y. Given the prices of x and y as Rs. 15 and Rs. 25 respectively. Find out the income level of the consumer.
Ans: Given Pₓ =15, Qx= 20
Py=25, Qy= 12
Now, we know that
M=Pₓ Qₓ+ Py
⇒ M=15.20+25.12
∴ M (income) = 600
3. Suppose there are two consumers in a market. The demand function of the first consumer is ___
d₁ (P)= 30 P ( When P ≤ 30)
and d₁ (P)= 0 (When P > 30)
demand function of the second consumer is _
d₂ (P)=20 – 2P (WhenP ≤ 10)
and d₂ (P)=0 (WhenP>10)
Find out the market demand function.
Ans: D₁m(P) = (20-P).2…. for P≤20
D₁m(P)=0….for P ≤ 20
D₂m(P)=(30-2P)2 for P≤15
D₁(P) = 0…..for P>15
4. Suppose there are 10 consumers in a market and they have the similar demand functions as given below :
d(P)=20-2P; if P≤10
and d(P)=0; if P>10
Find out the market demand function.
Ans: The market demand function is__
Dm(P) = (10-3P)(20)……….. for P≤ 10/3
and Dm(P) = 0 for P> 10/3
5. Let there be 10 consumers in a market and they have the similar demand function as given below:
d (P)=20-2P, if P≤ 20/7
and d (P)=0, When P> 20/7
Find out the market demand function.
Ans: The market demand function is:
Dm(P) = (10-3P)(20)……..for P≤ 10/3
and Dm(P)=0 for P> 10/3
6. Distinguish between substitutes and complementary good,s with examples.
Ans: There is a relation between the quantity of a good that a consumer chooses and the price of a related good. The quantity of a good that the consumer chooses can, increase or decrease with the rise in the price of a related good. But there are some goods which are consumed together. These type of goods are complementary to each other. Examples of goods which are complementary to each other are tea and sugar, shoes and socks, pen and ink etc.
There is a relation between the quantity of a good that a consumer chooses and the price of a related good. The quantity of a good that the consumer chooses can increase or decrease with the size in the price of a related good. All goods are not consumed together. The goods which are not consumed together are called substitutes for each other. For example, tea and coffee are substitutes of each other. If the price of coffee increases, the consumers will shift to tea.
7. With his given money income, a consumer can buy 10 units commodity X or 15 units of commodity Y. If the income of the consumer 150, find out the prices of commodity X and commodity Y.
Ans: Price of x= 150/10=15
Price of y= 150/15=10
8. Suppose there are two consumers in a market and they have the similar demand function as given below―
d(p)=50-5p ; if p ≤10
d(p)=0; when<10
Find out the market demand function.
Ans: Same as Q. No. 3 (Short Type – 1)
9. A consumer with his given money income can buy either 20 units of commodity x or 40 units of commodity y. If the price of commodity x is Rs. 20 per unit and the price of commodity y is Rs. 10 per unit, find out the income of the consumer.
Ans: Income of the consumer is
M=20×20 +40 x 10=400+400-800
10. The monthly income of a consumer is Rs. 400 and he spends his entire money income on two commodities x and y. The price of commodity x is Rs. 20 and that of y is Rs. 5. In the basis of this―
(ii) Draw the budget line of the consumer.
(iii) What will happen to the budget line, if the price of commodity y decreases to Rs. 20, while the income of the consumer and the price of commodity x remain constant.
Ans: Same as Q. No. 1, (Short Type – 1)
11. Explain Monotonic Preferences with an example.
Ans:According to monotonic preferences a consumer gets more satisfaction from more quantity of a commodity compared to its less quantity. For example consider a combination of two goods (x and y)
2x+2y. This combination has more of both goods as compared to 1x+ly.
So the consumer prefers the combination 2x+2y to combination 1x+1y. Also when compared with combination 2x+1y he prefers combination 2x+2y as it has more of y and equal amount of good x. Similarly compared to 1x+2y, he prefers combination 2x+2y, as it has more of x good and equal amounts as y good. Preferences of this kind are called monotonic preferences.
12. Suppose there are 10 consumers in a market and they have similar demand formation as given below.
d(p)=20-2p ; if p≤10
d(p)=0; if p<10
Ans: Market demand function
dm(p)=10(20-2P) when p≤10 =200-2 when p≤10 and dm (P)=0 when P>10
13. Suppose there are two consumers in a market of a commodities. The demand function of two consumers as given below:
d₁(p)=20-p when p≤ 20 and 0 when p> 20
d₂(p)=30-2p when p≤15 and 0 when p>15
Ans: Given,
d₁ (P)=20-P, P≤20, P> 20, d₁=0 d₂(P)=30-2P, P≤15, P>15, d₂ = 0
We know, Market demand (Md)=d₁+d₂
When, P> 20, d₂ = 0 and d₂=0
∴ Md = 0
When, P <15
d₁ = 20-P , d₂=30-2p
∴ Md=20-P+30-2P = 50-3P
When P>15, d₂ = 20-P
d₂ = 0
∴ Md=20-P
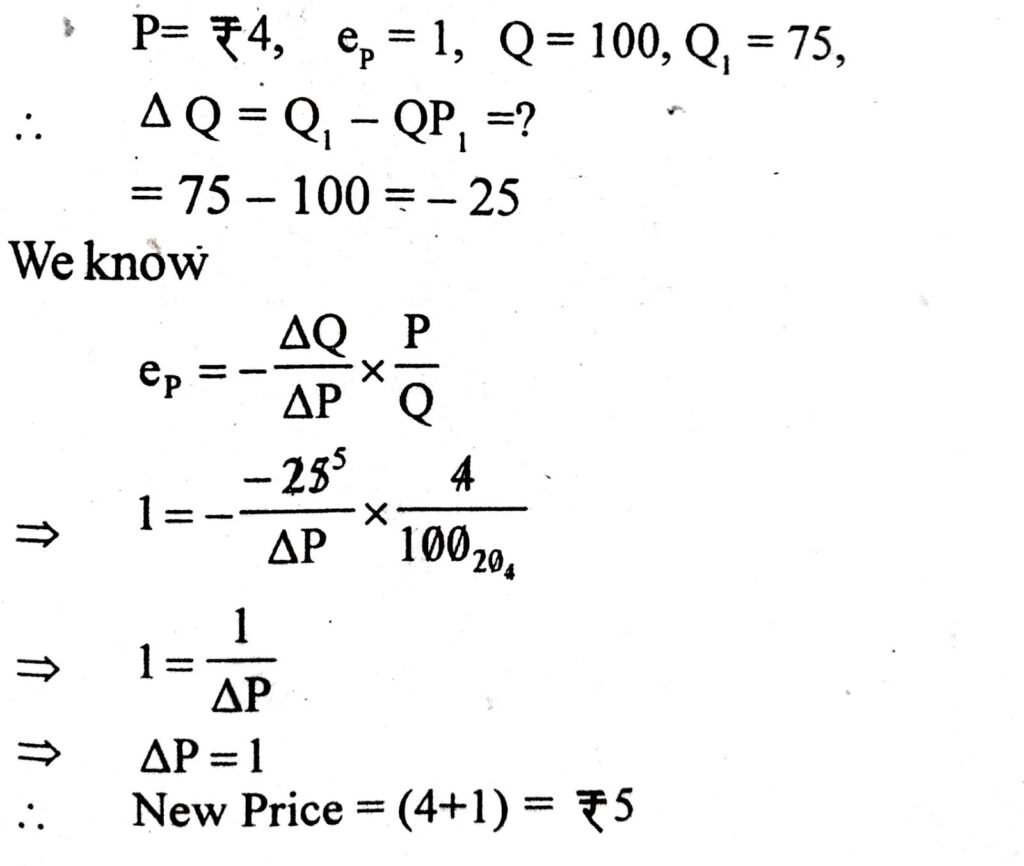
14. The market demand for a good at Rs. 4 is 100 units. The price rises and as a result its demand falls to 75 units. Find out the new price if the price elasticity of demand for the good I.
Ans: Given values:
15. Distinguish between change in quantity supplied and change in supply.
Ans: A change in quantity supplied is a movement along the upward sloping supply curve in response to a change market price (holding all other things constant- the ceteris paribus assumption). Contrast this to a change in supply (a shift in the supply curve), which is caused by a change in the producers costs.
16. Distinguish between supply and stock.
Ans: Difference between Supply and Stock:
(a) While supply refers to the quantity which the seller is prepared to sell in the market at given price at any point of time while stock refers to total available quantity with the seller at any given point of time.
(b) An example of stock will suppose as a human we have 24 hours which is fixed and it can be considered as stock and out of those 24 hours an individual is willing to supply 4 hours at $20 for a particular task and at $25 an individual is willing to supply 6 hours for a particular task. Hence supply keeps fluctuating depending on the price while stock is fixed.
(c) Supply can be increased and decreased depending on the price prevailing in the market while stock at a particular point of time is fixed and it cannot be increased or decreased, in simple words supply is dependent on the price while the stock is not dependent on the price.
(d) Supply can be equal to or less than stock but it cannot be greater than stock as in the above example no matter what price is the market willing to pay you cannot increase the working hours beyond the 24 hours stock.
17. Explain the law of supply with the help of a supply schedule.
Ans: The Law of Supply states that other things being equal, quantity supplied increases with the increase in price and decreases with the decrease in price of a commodity.
It can be explained with the help of following schedule and diagram:

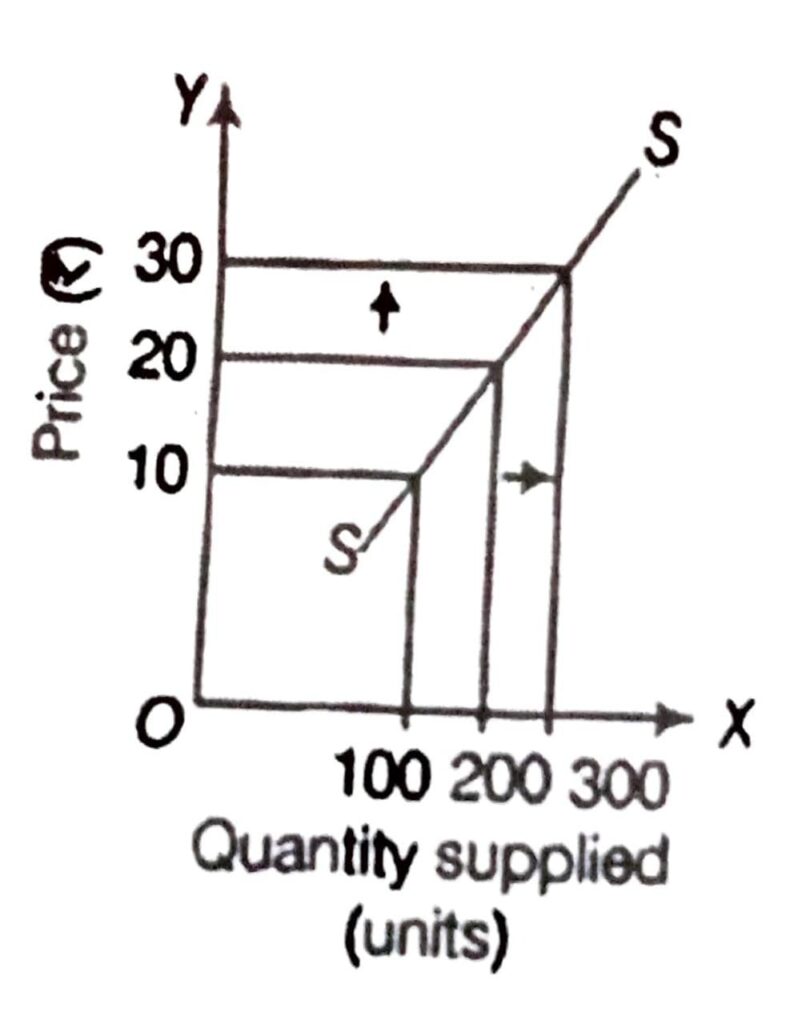
The supply schedule shows the positive relationship between price and quantity supplied. This is in accordance with the Law of Supply.
SS is the supply curve sloping upward. It shows a positive relationship between price and quantity supplied of a commodity.
When price increases from Rs 10 to Rs 20, quantity supplied increases from 100 to 200 units.
LONG ANSWER QUESTIONS TYPE (MARKS : 5)
1. Suppose a consumer wants to consume two goods viz, x and y. The consumer has an income of Rs. 40. The prices of the two goods are Rs. 8 and Rs. 10 respectively. Write down the equation for his/her budget line and explain it.
Ans :Let us assume the two goods are x and y.
Price of good 1 is 4x
Price of good 2 is 5y
Income of the consumer is Rs. 20,
The equation of the budget line is 4x + 5y=20
2. In the diagram, the budget line shows three points A, B and C. State the features of these points and explain why will a consumer be not consuming at
point C.
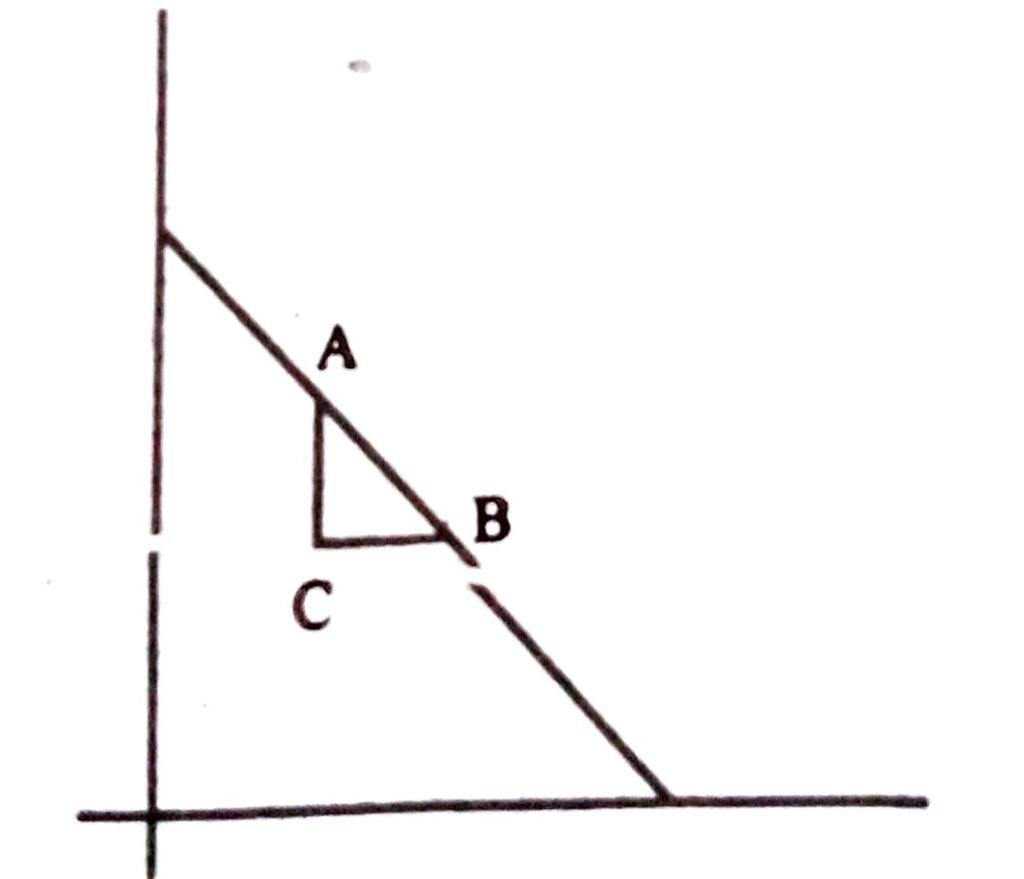
Ans: In the diagram, the budget line shows three points A, B and C.. State the features of these three points and explain why will a consumer be not consuming at point C.

3. Show the changes in the budget line resulting from changes in consumer’s income when the price of the two goods remain constant.
Ans: When the consumer’s income changes, the set of available bundles is also likely to change. Suppose, the consumers’s income changes from M to M, but the price of the two goods remain unchanged. With the new income, the consumer can afford to buy all bundles (x₁,x₂) such that
P₁x₁ + P₂x₂ ≤M’. Now the equation of the budget line is P₁x₁ + P₂x₂ = M;
The slope of the new budget line is the same as the slope of budget line prior to the change in the consumer’s income. However, the vertical intercept has changed after the change in income.
4. Show and explain the changes in the budget line resulting from changes in the price of good 1 when the price of good 2 and consumer’s income remain unchanged.
Ans: If the price of good x rises then the budget line will sift leftward. Again, if the price of good X falls the budget line will sift rightward.
5. Explain how does preference influence consumer’s behaviour.
Ans: If both the prices as well as the income remain unchanged, then, there will be no change in the budget set, i.e. the collection of all bundles of goods that a consumer can buy with her/his income at the prevailing market prices will remain same.
6. Prove that at consumer’s optimum point on an indifference curve the marginal rate of substitution is equal to the ratio of the prices.
Ans:
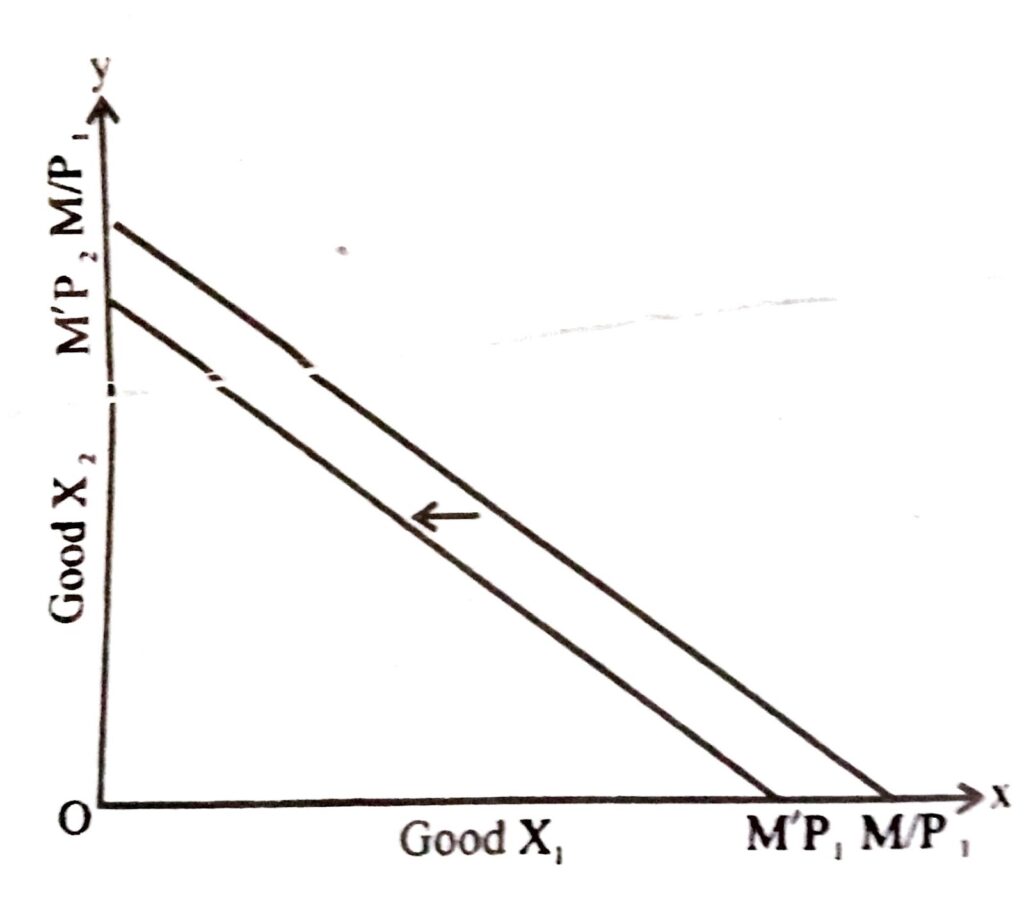
In the fig, M/P₂ M/P₁ is the budget before the decrease in income. When income decreases to M’, the budget line shifts inward and the new
budget line is M’/P₂ M’/P₁.
Now, supposing the price of good x₁ change from P₁ to P but the price of good x₂ and the consumer’s income
remain unchanged. At the new price of good x₁, the consumer can afford to buy all bundles (x₁,x₂) such that P’₁x₁ +P₁x₂≤M. The equation of the budget line is P’₁x₁ + P₂x₂ ≤M.
7. Explain with the help of a diagram why at consumer’s optimum point the budget line should be tangent to an indifference curve.
Ans: A consumer is said to be in equilibrium, when he obtains the maximum satisfaction from his expenditure on the commodities he wants to purchase. Consumer’s equilibrium shows a situation in which the consumer purchases such a combination of the commodities that he gets the maximum satisfaction from his given income and with given prices of the commodities. The point of equilibrium is such that he does not want a change from it.
Consumer’s equilibrium with the help of indifference curve is analysed as follows:
Assumptions: The indifference curve analysis of consumer’s equilibrium is based on the following assumptions―
(a) Prices of the commodities are given to the consumer.
(b) Consumers income is also given.
(c) The consumer knows the prices of the commodities and the possible combinations of the two commodities which he can choose.
(d) The consumer can spend his income in small amounts also.
(e) The consumer is rational and wants to obtain the maximum satisfaction.
(f) The consumer knows the combinations among which he is indifferent.
(g) There is perfect competition in the market.
The consumer is in equilibrium at that point, which lies on his price line as well as on the highest attainable indifference curve. In the diagram below, the situation is illustrated.
The aim of the consumer is to obtain the highest combination he can on his indifference map. In other words, he tries to go to the highest indifference curve attainable with his given price line. There are many points on the price line which are lying on the same indifference curve in the diagram. In the ox axis, commodity ‘A’ is measured and on the oy axis, commodity ‘B’ is measured. LM is the price line or budget line, which represents the various combinations of commodity ‘A’ and ‘B’ at the given price. The consumer is in equilibrium at the point ‘P’, where the price line LM is touching the highest indifference curve IC₃ from below. This point shows a combinations of the two commodities, which consumer can buy with his income at given prices and which is also on the highest possible indifference curve the consumer can reach. At this point, the slope of the price line must be equal to the slope of the indifference curve.
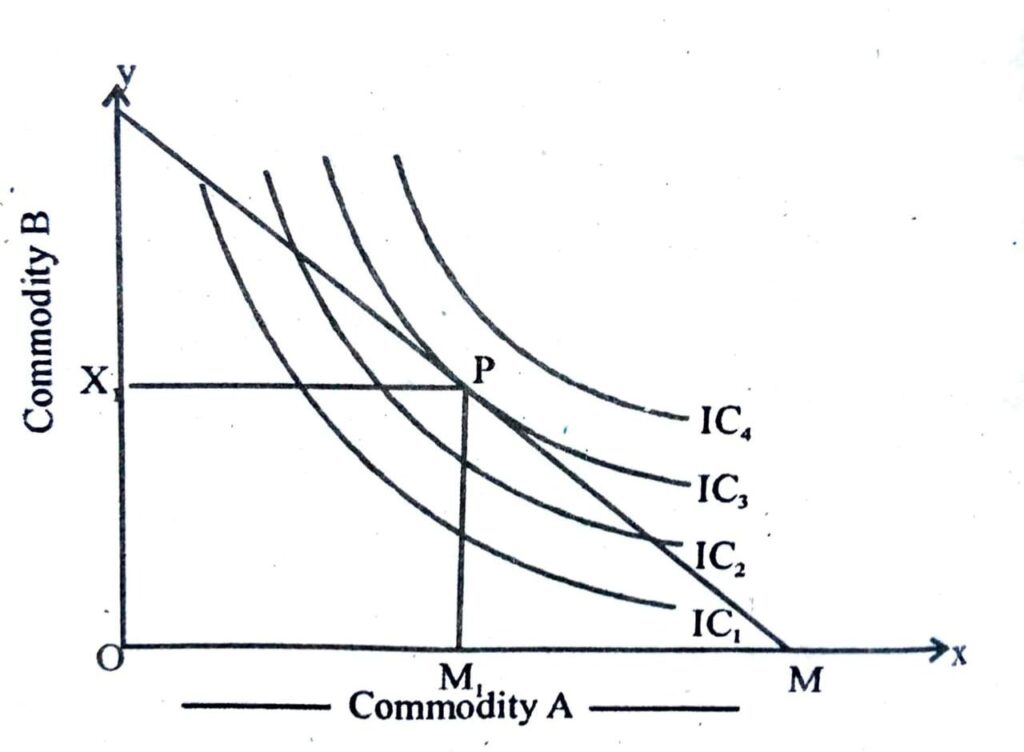
For consumer’s equilibrium, two sets of conditions are required. The one condition is that the marginal rate of substitution between the two commodities must be equal and the other condition is that the marginal rate of substitution should be diminishing at the point of equilibrium. This means indifference curve should be convex to the origin. That is why the point ‘Q’ on the indifference curve IC₁, and the point ‘R’ on IC₂ is not the equilibrium point of the consumer.
8. What is demand function ? Explain it graphically.
Ans: It is the technical relationship between the amount of quantity demanded and the factors influencing demand, i.e. price, time, income etc. symbolically.
Qd=f(P, t, y……….)
9. Explain the substitution effect in the context of consumer’s demand.
Ans: Substitution effect refers to substitution of one commodity for the other, when it becomes relatively cheaper. As a result of substitution effect, a consumer in order to get maximum satisfaction, will buy more units of that commodity, whose price has fallen in relation to the substitute commodity.
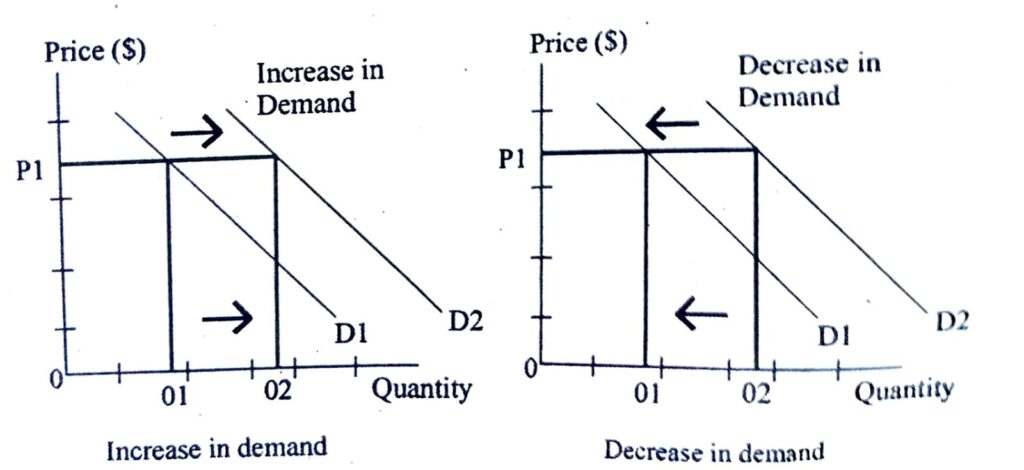
10. Show the shifts in demand curve and explain the situation under which it changes.
Ans: When quantity demanded changes because of change in other determinants of demand than the price of the commodity, it is called increase or decrease in demand. It is represented by shift in the demand curve. Increase in demand is represented by a rightward shift in the demand curve.
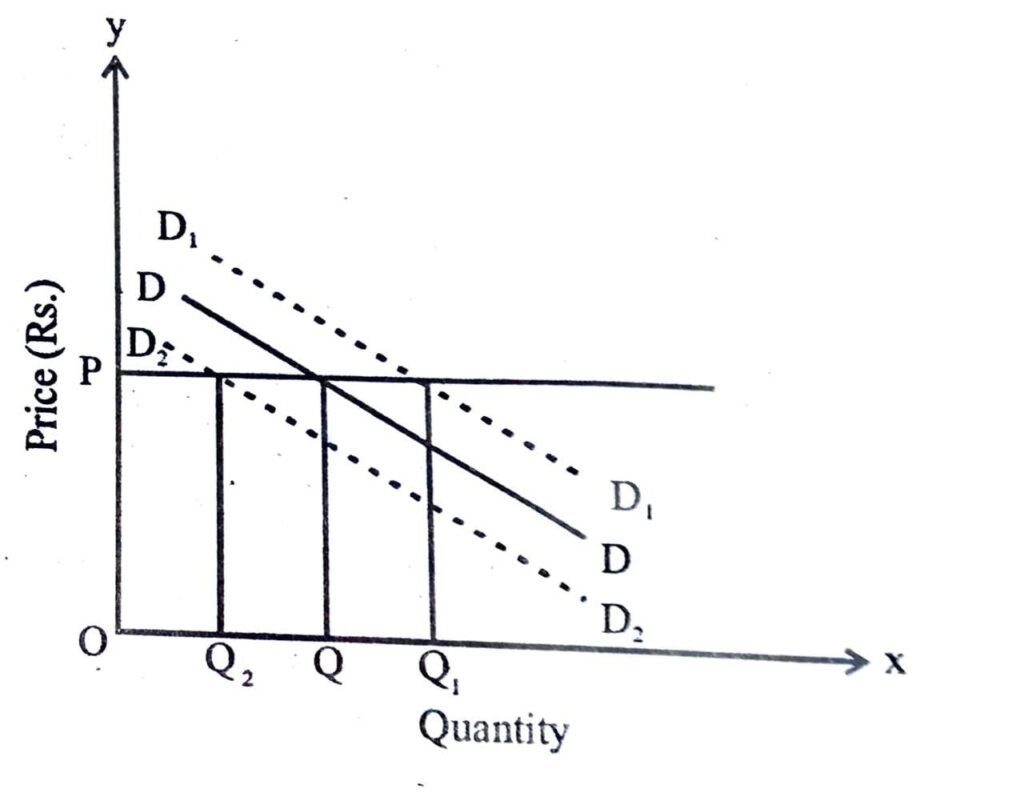
Decrease in the demand on the other hand is represented by a leftward shift. It is shown in the diagram below-
In the fig, DD is the initial demand curve, D₁D₁ is a new demand curve which is to the right of DD and shows increases in demand. That is, more of a commodity is demanded at the same price, or same amount is demanded at the higher prices. D₂D₂ is to the left of DD. This show decrease in demand i.e. less of the commodity is demanded at the same price, or the same amount is demanded at the lower price.
11. State and explain the law of demand.
Ans: The law of demand states that, other things being equal, the demand for a good extends with a decrease in price and contracts with an increase in price. In other words, there is an inverse relationship between quantity demanded of a thing and its price, provided other factors influencing demand, remain unchanged. The term other things being equal implies that income of the consumer, his tastes and preferences and prices or other related goods remain constant. According to Marshall, “The law, of demand states that other things being equal, the amount demanded of increases with a fall in price and diminishes when price increases.”
Assumption of the law of demands :
Law of demand holds good when “other things remain the same”: It means, factors influencing demand other than price are assumed to be constant. These constitute the assumptions of the law. It applies to normal goods and not to Giffen goods.
The main assumption of the law are as follows:
(a) Tastes and preferences of the consumers remain constant,
(b) There is no change in the income of the consumer,
(c) Prices of the related goods do not change,
(d) Consumer do not expect any change in the price of the commodity in the near future.
Law of demand may be explained with the help of demand schedule:
Demand schedule :
The schedule shows extension of demand in response to decrease in price of the commodity. Thus, demand d stretches from 100 to 150 units when price reduces from Rs. 10 to Rs. 9 per unit. It may be further illustrated with the help of demand curve. In the figure below DD is the demand curve which shows es the demand for commodity. On the ox raxis quantity is measured and oy axis, price of the commodity is measured. When the price of commodity x is OP, the demand is OL but when the price of x fall from OP to OP₁, the demand extend from OL to OL₁. The downward slope of demand curve is an expression of the law of demand.
12. Show graphically how market demand curve can be derived from individual demand curves.
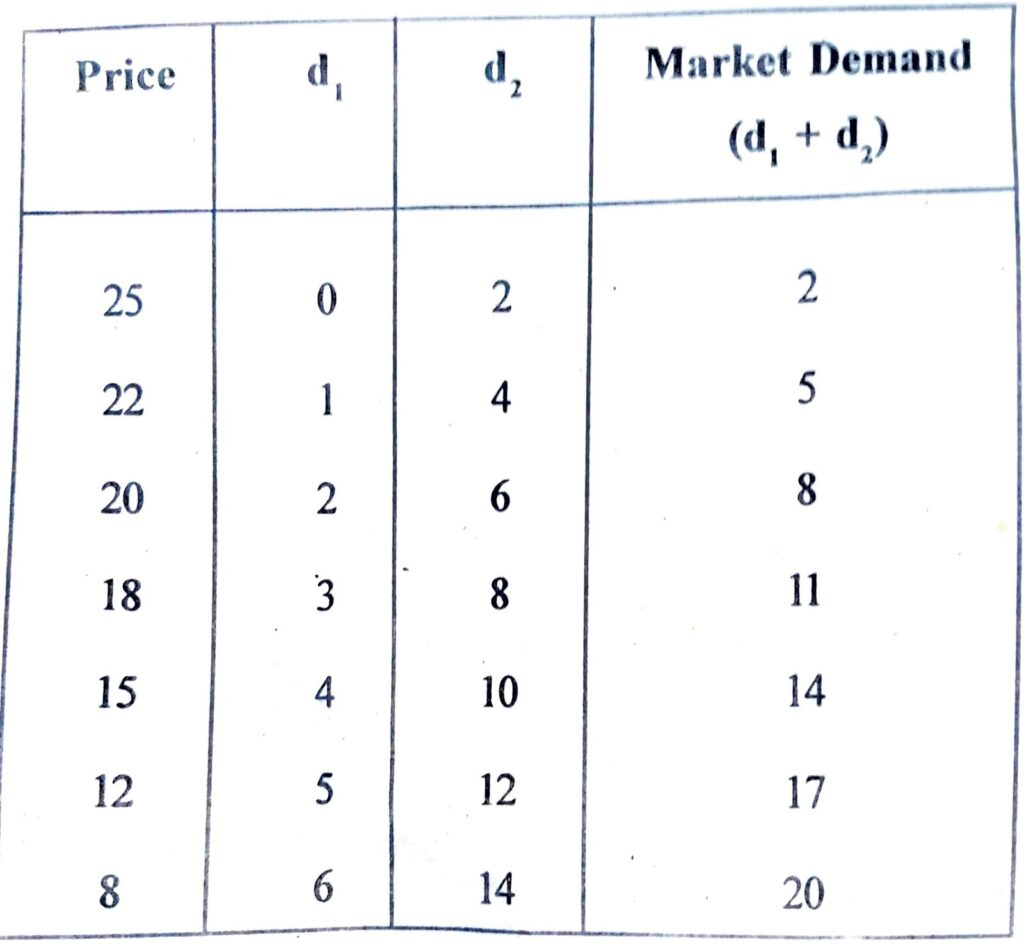
Ans: Market demand curve represents graphically the various total quantities of a commodity demanded by all the consumers in the market at different prices. It is the horizontal summation of the individual demand curves.
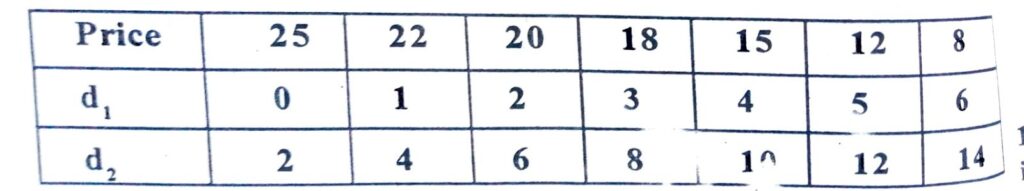
To derive the market demand curve from the individual demand curve, we take the help of market demand schedule. In the following table, the market demand schedule is given-
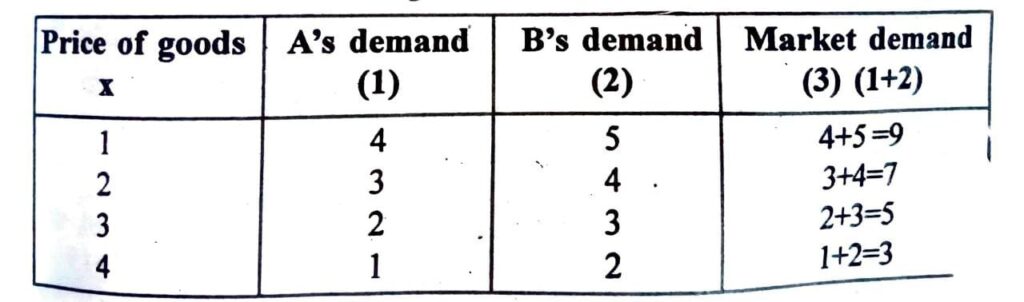
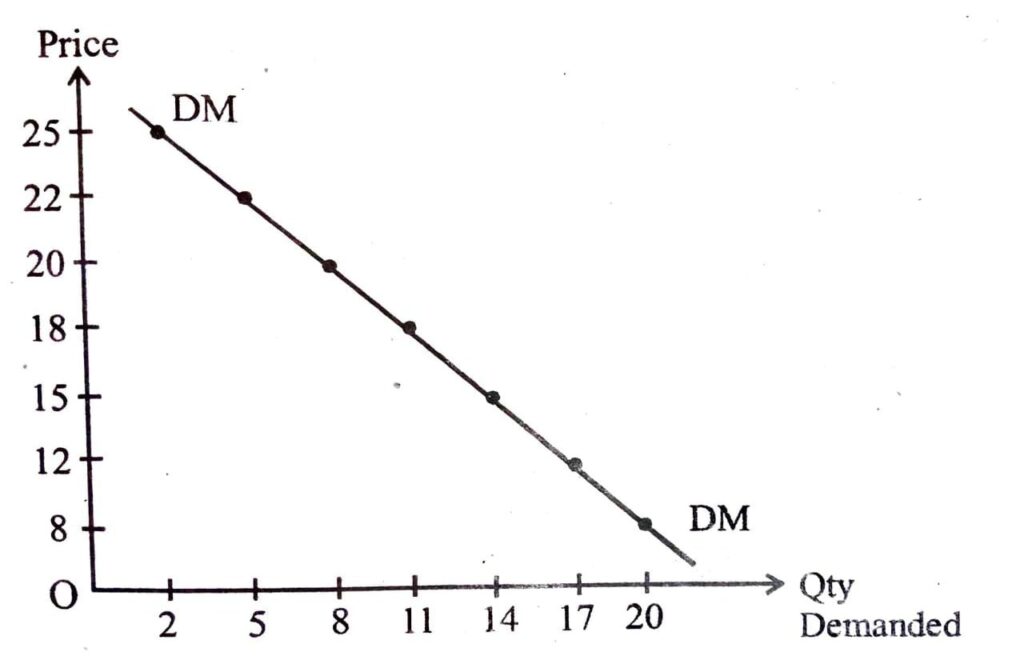
On the basis of the individual demand schedule, the market demand curve is drawn on the following diagram:
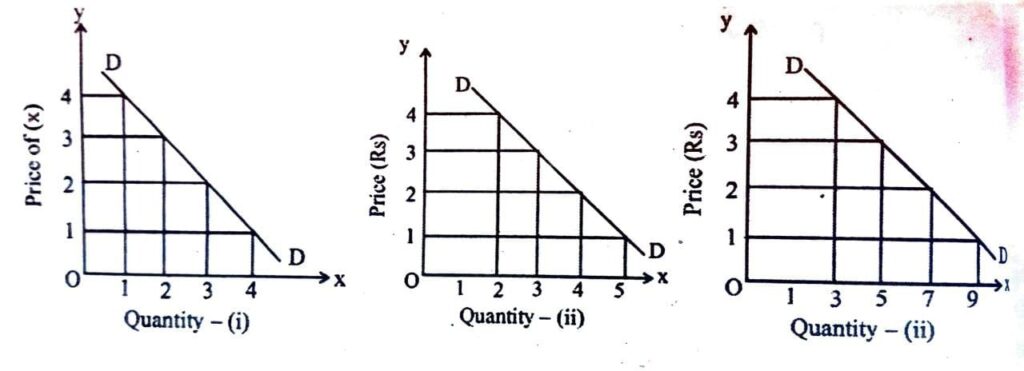
In the figures, on the OX axis measures the quantity demanded and on OY axis price of good x is measured. In fig (i) demand curve of ‘A’, in figure (ii) demand curve of B and in the figure (iii) market demand curve have been shown. When price of good x is Rs. 1, ‘A’s demand is 4 and B’s demand is 5. Lateral summation of individual demand of both the consumers constitutes market demand, that is 9 units. Thus, by adding the different points on individual demand curves, one gets the market demand curve DD as shown in figure (iii). Slope of this demand curve is also negative, indicating inverse relationship between price of the commodity and its quantity demanded.
13. Explain the concept of price elasticity of demand.
Ans: Price elasticity of demand is percentage change in demand divided by percentage change in price. The price elasticity of demand tells us tha percentage fall in demand due to percentage rise in price and percentage rise in demand due to percentage fall in price. In other words, price elasticity of demand is the degree of responsiveness of demand for the commodity to a charge in its price. i.e.- Percentage
14. Show and explain different price elasticity of demand at present points of a linear demand curve.
Ans: The different degree of elasticity of demand are explained as follows:
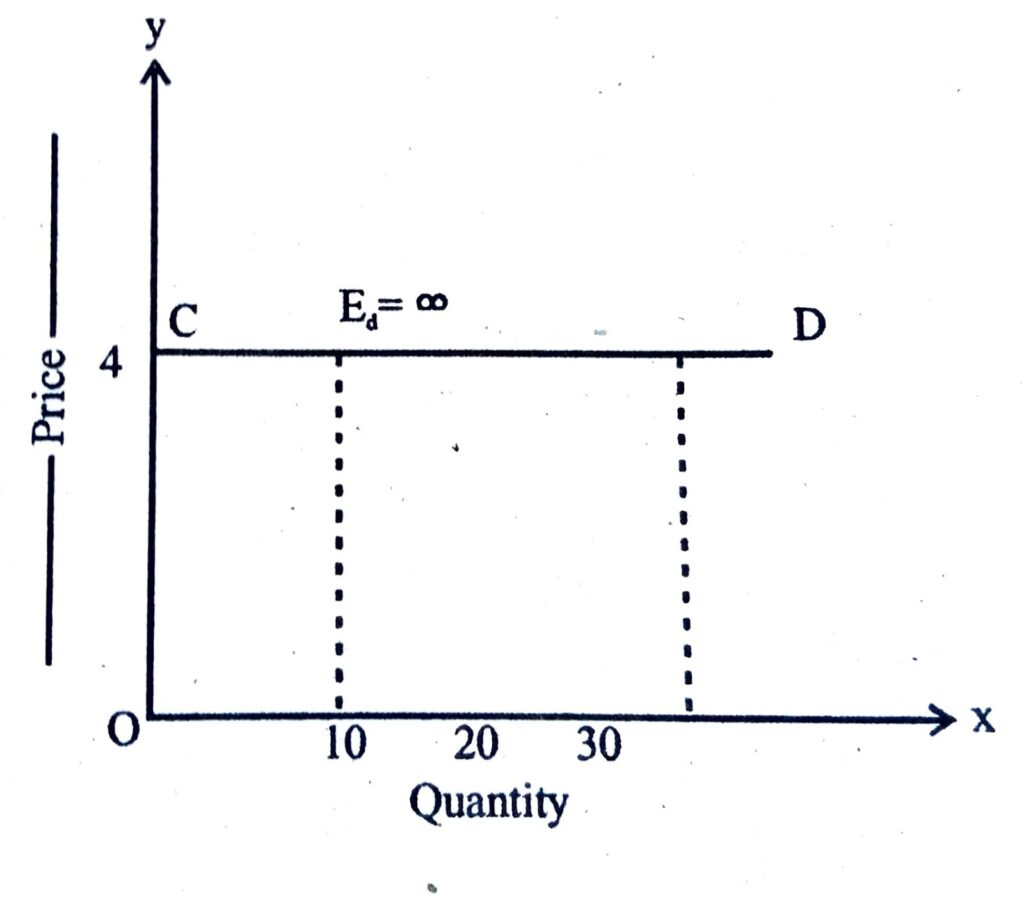
(a) Perfectly elastic demand : A perfectly elastic demand refers to the situation, when demand is infinite at the prevailing price. It is a situation when the slightest rise in price causes the quantity demanded of the commodity to fall to zero. The figure in a diagrammatic representation of perfect elastic demand. CD is perfectly elastic demand curve, which is parallel to ox axis. It shows that if price is slightly increased from Rs. 4, the demand will fall to zero. At the prevailing price of Rs. 4 the consumer may buy 10 or 20 units or any quantity that he desires. In this condition, elasticity of demand (Ed) is infinite (∞).
(b) Perfectly inelastic demand : A perfectly inelastic demand is one in which, a change in price causes no change in the quantity demanded. It is a situation where even substantial changes in price leave the demand unaffected. Figure represents perfectly inelastic demand.
DD demand curve is parallel to y axis. When price is Rs. 2 demand is 4 units. When price rise to Rs. 4 or to Rs. 6, the demand remains the same i.e. 4 units. Thus, change in price evokes no response in demand. In this case, elasticity of demand (Ed) is zero.

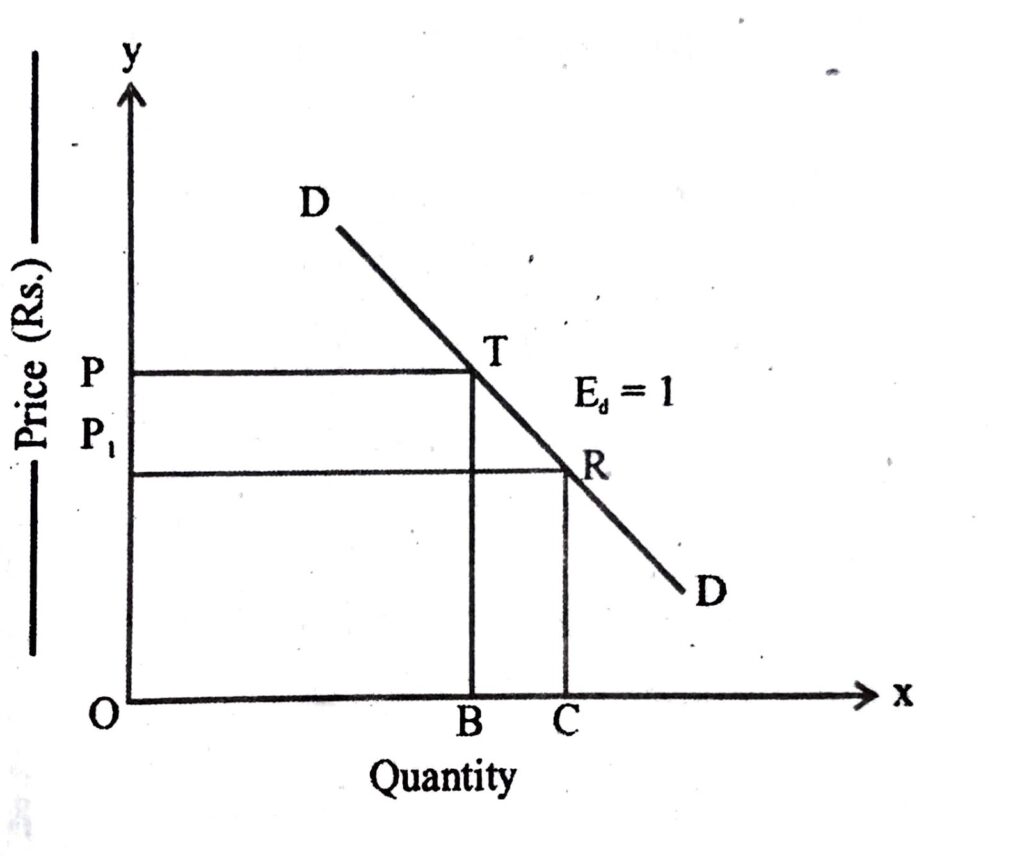
(c) Unitary Elastic Demand : It is a situation, when change in quantity demanded in response to change in price of the commodity is such that expenditure on the commodity remains constant. Total expenditure= Quantity purchased x price. In the figure, when price is OP, quantity demanded is OB and total expenditure is OB ×OP= area OBTP. Likewise, when price is P₁ total expenditure is OC x OP₁= Area OCRP₁ Area OBTP = Area OCRP₁ implying that total expenditure remains constant even after change in price of the commodity. Hence, elasticity of demand is unity.
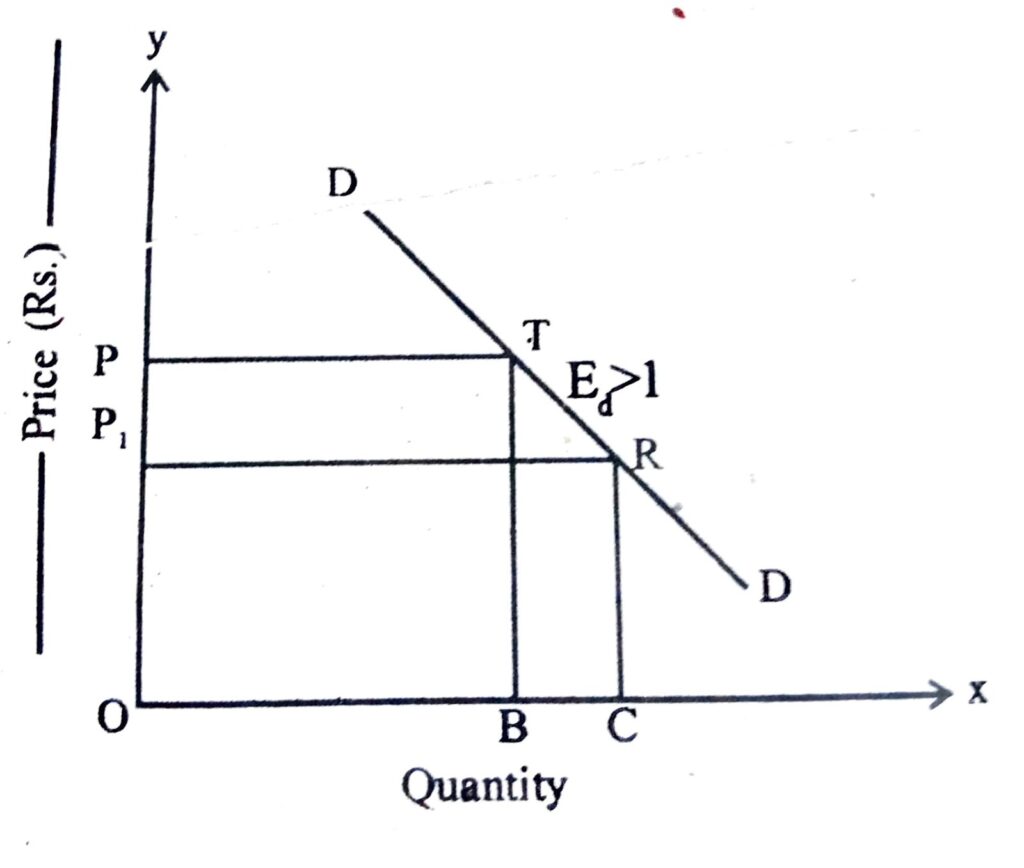
(d) Greater than unitary elastic : Demand is greater than unitary elastic, when change in quantity demanded in response to change in price of the commodity is such that, total expenditure on the commodity increases when price decreases and total expenditure decreases when price is OP, quantity demanded is OB, total expenditure is OB×OP=Area OBTP. Likewise, when price falls to OP₁, quantity demanded is OB, total expenditure is OCXOP₁=Area OCRP₁>A glance at the diagram shows. that area OCRP₁>Area OBTP. It implies that total expenditure increases in response to decrease in price of the commodity. Hence, Ed-greater than unity (>1).
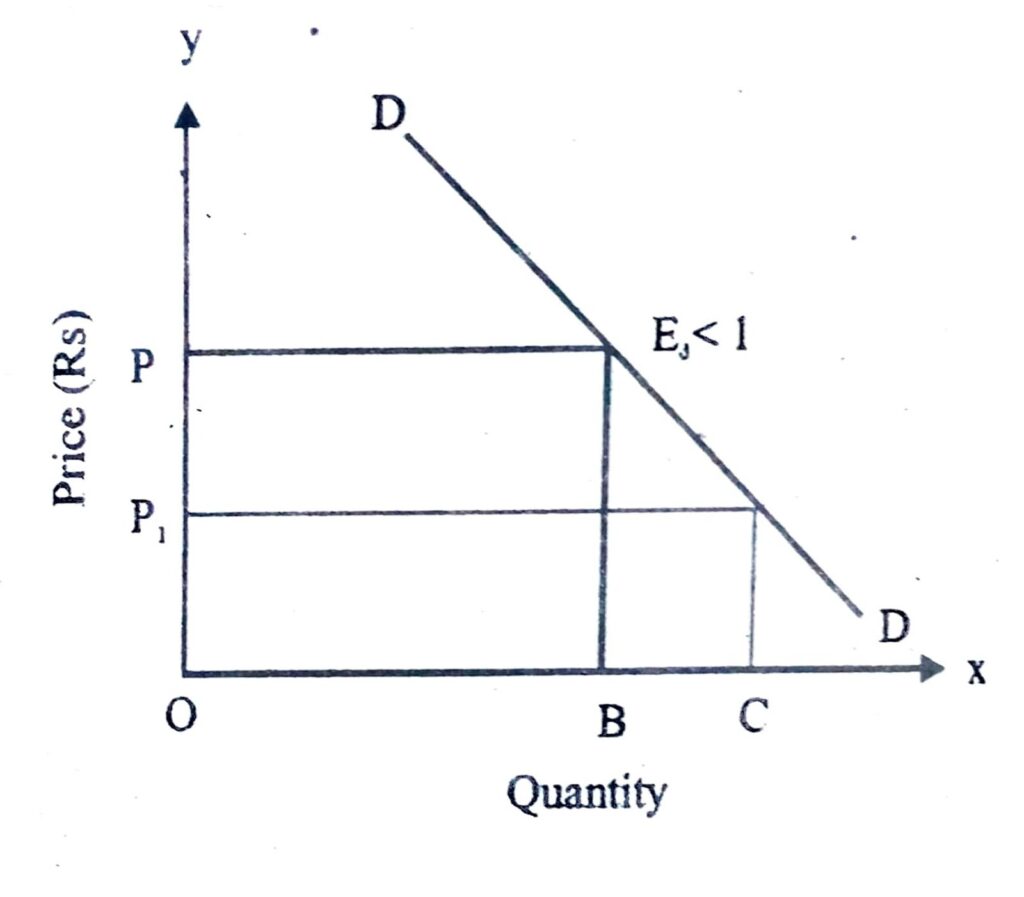
(e) Less than unitary elastic : Demand is less than unitary elastic when change in quantity demanded in response to change in price of the commodity is such that, total expenditure on the commodity decrease when price falls and total expenditure increases when price rises. In figure-
At price of quantity demand is OB, total expenditure is OB×OP=Area OBTP. Likewise, when price is OP₁, quantity demanded is OC, total expenditure is OC×OP₁= Area OCRP₁ is smaller than area OBTP. It implies that total expenditure is reduced in response to fall in price of the commodity. Hence, Ed = less than unitary (>1)
15. Show how can the elasticity be measured graphically along a linear demand curve.
Ans: Point Elasticity method or Graphic method: This method is used when elasticity of different points on a given demand curve is to be measured. This method is explained with the help of a figure. In the figure, MN is a straight line demand curve. In order to measure elasticity of demand at any point on this demand curve, the lower portion from that point is divided by the upper portion from the same point.
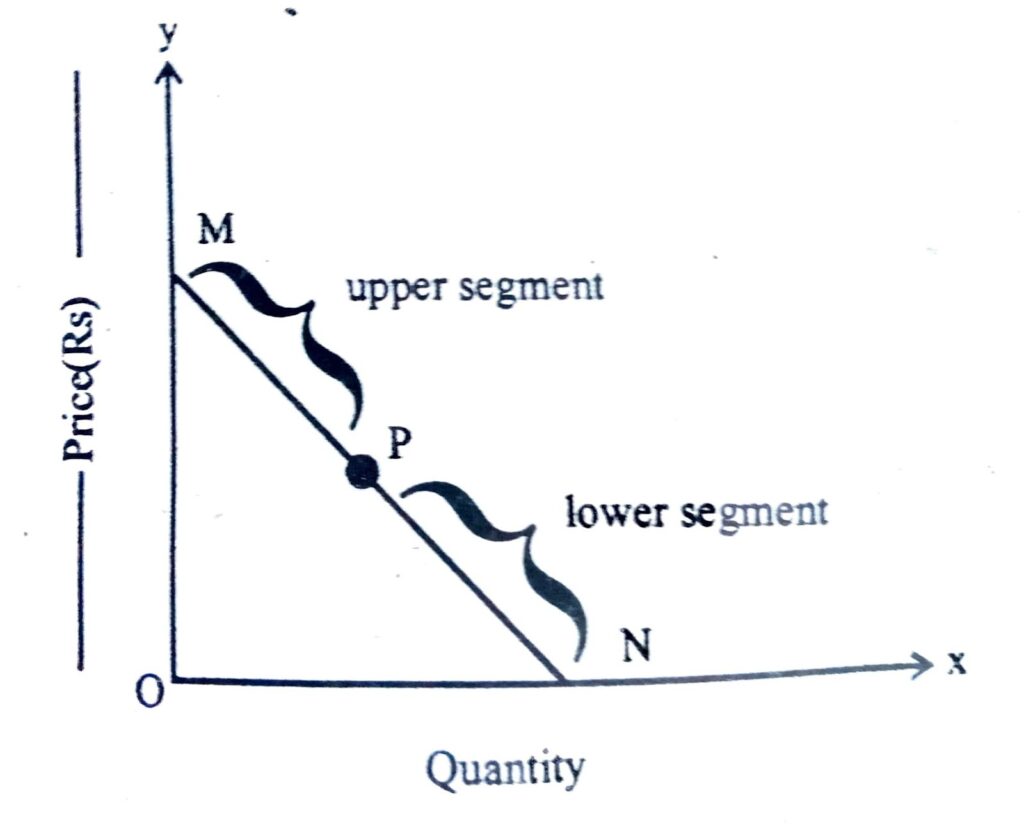
Ed = Lower segment of the demand curve/Upper segment of the demand curve

16. Suppose a consumer spends his entire money income on two commodities x and y. The consumer’s money income is Rs. 100 and the prices of commodity X (px) is Rs. 10 and the price of commodity Y (Py) is Rs. 5 state the budget equation of the consumer and draw the budget line. How the budget line would change if income increases from Rs. 100 to Rs. 200.
Ans: Same as Q. No. 1, (Long Type)
17. Individual demand functions of two consumers of a commodity in the market are-
Find out the market demand function and draw the market demand curve.
Ans: The market demand function is –
18. If the elasticity of demand is -2 and price of the commodity is increased by 9%, what will be the change in the quantity demanded of the commodity.
Ans: Same as Q. No. 33, (very short type)
19. State and explain the law of demand with the help of a diagram.
Ans: The law of demand explains the increase relationship between the price and quantity demanded of a commodity. According to this law other things seeing equal price and quantity demanded of a commodity move in the opposite direction. In other words when the price of a commodity increases, its demand falls and when price falls demand increases. The law of demand is explain with the help of a diagram
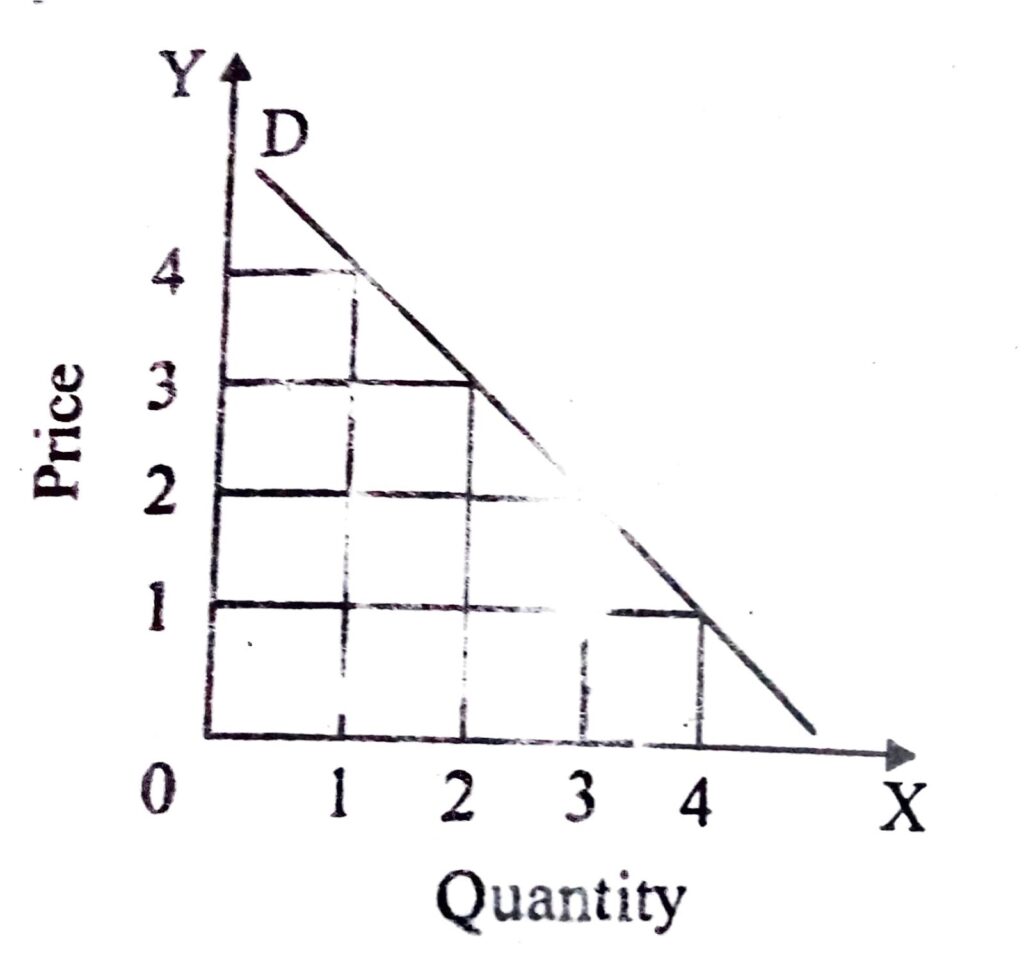
In the diagram its shown that when the rice of a commodity is 1 consumer demanded 4 un ts but when price increases to 4 consumer demanded 1 unit. The DD demand curve is a downward sloping demand curve which explains the law of demand.
20. Distinguish between normal goods and inferior goods with examples.
Ans: Goods that have a direct relationship with income are called normal goods as income increases a consumer buys more commodity. Things like milk, basmati rice, wheat, shoes, shirts, jeans, etc. a consumer demand as his income increases and demand less as his income decreases.
There are some goods, the demands for which move in the opposite direction of the income of the consumer. Such goods are called inferior goods. Low quality food, course cloth are example of inferior goods.
21. What is price elasticity of demand? Explain the factor determining price elasticity of demand for a good.
Ans: Price elasticity of demand is a measure of responsiveness of the demand for a good to change in its price. It is defined as the percentage change in demand for the good divided by the percentage change in price.
The factors determining the price elasticity of demand are:
(1) Availability of close substitutes: If close substitutes of a good are readily available, its price elasticity of demand is likely to be high, because even a very small increase in price will make consumers to switch over to other goods in a big way and vice versa.
(ii) Nature of the commodity: If the commodity is a necessity of life, its demand will not change much when its price change. Hence, the elasticity of demand will be low.
(iii) Habits: Habits also play a role in the determination of elasticity. For instance, if a person has developed the habit of smoking, he may not be able to reduce his consumption of cigarettes ever when the price of cigarettes goes up this demand for cigarettes will b inelastic.
(iv) Income of the purchaser : The elasticity of the demand is also influenced by the income of the consumer. If the consumer is rich he will not bother much by small changes in prices. Such change will leave his demand unaffected. The demands of this consumer for the various commodities will, therefore be relatively inelastic.The demands of this consumer for the various commodities will therefore be relatively inelastic. A poor consumer, on the other hand, will give importance even to small changes in price. This demand therefore will be price elastic.
(v) Period of Time: If the price of a product rises consumers will search for cheaper substitutes. The longer period they have, the more likely they are to find the one. Demand will, therefore more price elastic in the long run.
22. Explain the factors on which demand of a commodity depends.
Ans: The factors on which demand of a commodity depends are as follows:
(i) Own price of the commodity: Price is the most important factor that influences a consumer’s decisions to purchase a particular commodity. Lower price of a commodity attracts more consumers and higher price restricts their number.
(ii) Price of the Related Goods: The demand for a good depends not only on its own price but also on the price of related goods. If a change in the price of one good affects the goods are related.
(iii) Income of the consumer: Other things being equal, generally there is direct relationship between the consumer’s income and the demand of a commodity. However the effect of change in income on consumer’s demand depends upon the nature of the commodity.
(iv) Tastes, preferences and Fashion: Tastes, preferences of individuals and prevailing fashion also affect demand for a commodity. Demand is directly related with tastes preferences and fashion.
23. Explain with diagrams what happens to the demand curve when the following things change:
(a) The income increases.
(b) the price of related good changes.
Ans: (a) The income increases: An increase in the income of consumers shifts the demand curve to the right indicating that more will be demanded at each possible price. Conversely in a situation of fall in income, less will be purchased at each price. The demand curve will shift to the left. It is shown in the diagram below
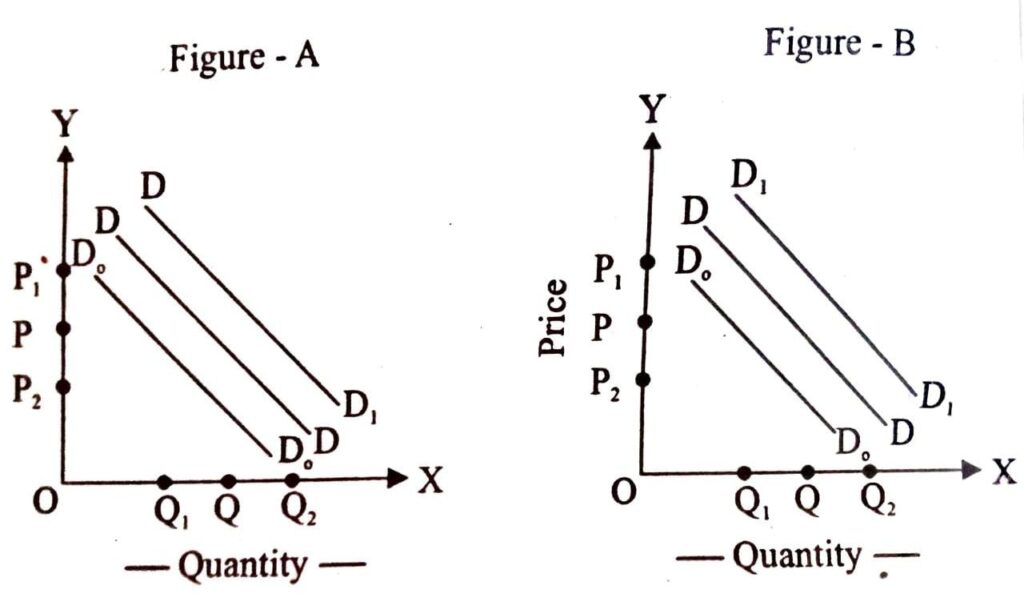
In the figure DD is the original demand curve when aggregate income in the economy increases, demand shifts to the right from DD to D₁D₁ decrease in income leads to leftward shift the demand curve as depicted by demand curve D₀D₀ conversely, when income of the consumers decreases, they will continue to depend on the inferior good and hence would buy more of the inferior good. This implies a situation of rightward shift in the demand curve from DD to D₁D₁ as shown in figure B.
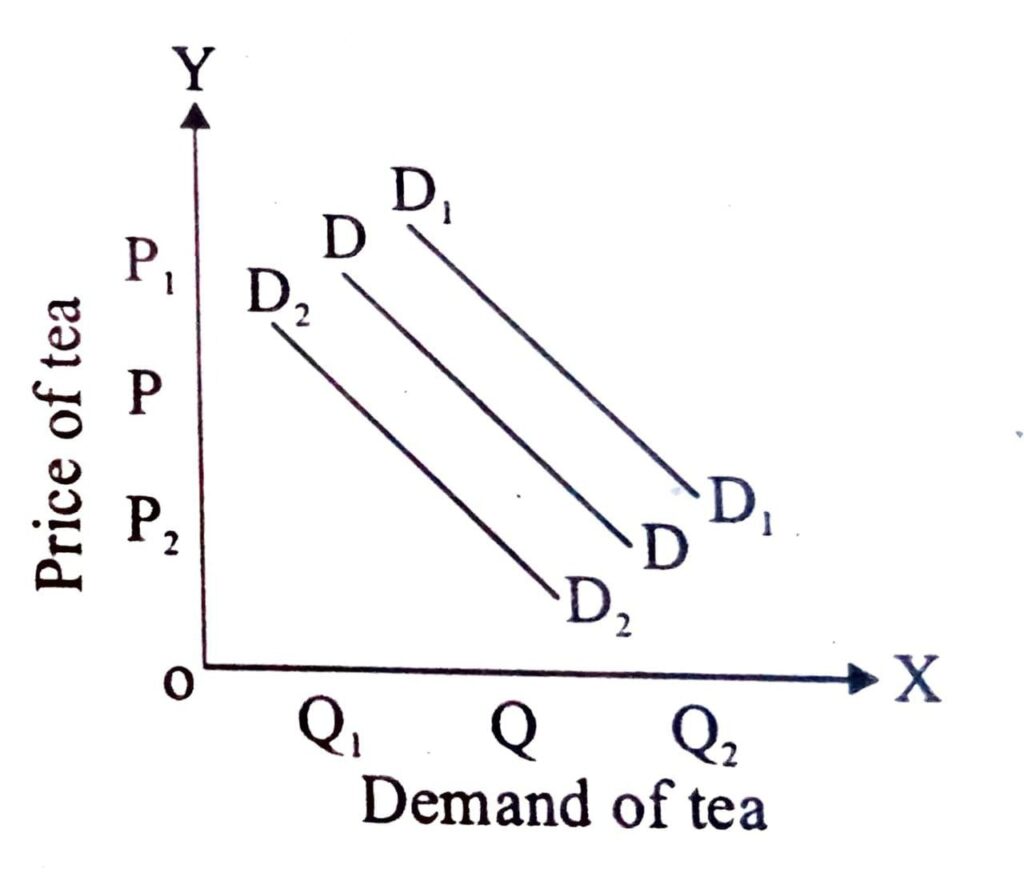
(b) The price of related good change: Goods are related if a charge in price of one commodity leads to change in demand for another commodity. Related consumption goods may be of two types-substitute goods and complementary goods. Any change in price of one good may shift the demand curve for the other. For example tea and coffee which are substitute goods. An increase in the price of a substitute good coffee causes an increase in demand for the product tea and shifts the demand curve to the right. This is because the product tea become cheaper relative to its substitute. On the other hand, a decrease in price of coffee shifts the demand curve of tea to the left. This is shown in the figure. In the figure when price of coffee rises consumers may decide to substitute some tea for coffee. In other words they may buy more of tea ever when its price is the same. This is reflected by rightward shift in demand curve from DD toD₁D₁ Conversely if price of coffee decreases will tend to substitute some coffee for tea. The demand curve for tea will shift to the left from DD to D₂D₂.
In the case of complementary goods the demand for a good move in the opposite direction of the price of its complementary good. Complementary goods are consumed together. For example tea-sugar, per-ink etc. since tea and sugar are used together, an increase in the price of sugar is likely to decrease the demand for tea and a decrease in the price of sugar is likely to increase the demand for tea. Thus the demand for a good move in the opposite direction of the price of its complementary good.
In figure (D) DD is the original demand curve for sugar and original demand for sugar was OM at OP price. New price of sugar remains constant but its demand decreases to OM₁. Hike in tea price reduces its demand and hence the demand of sugar also reduces. So the demand curve of sugar shift leftward from DD to D₁D₁ which means decreases in demand.
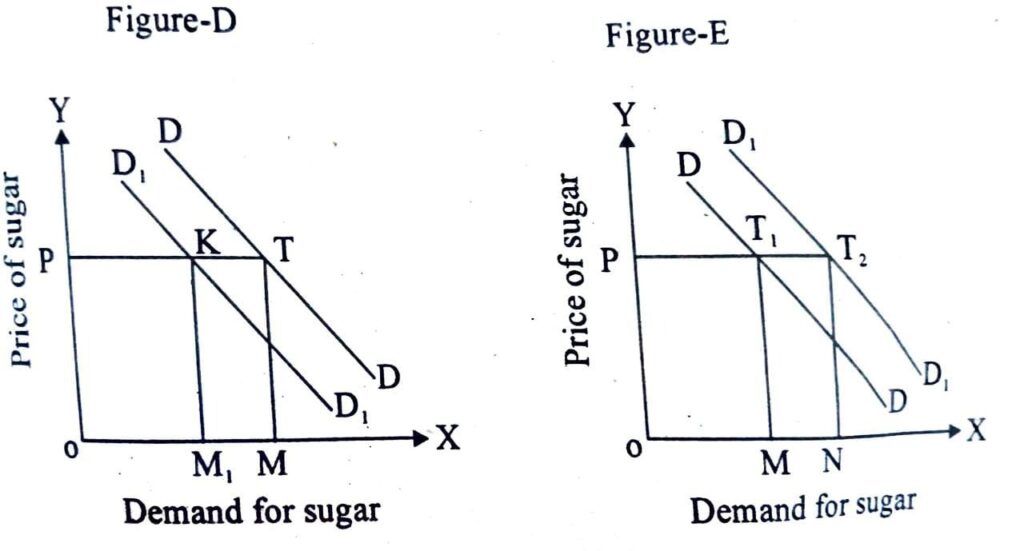
On the other hand, if tea price falls, there will more demand of sugar in the market, even when sugar price remains unchanged. Figure (E) given abuse illustrates this point initially, OM quantity of sugar was purchased at OP price. When price of tea falls in the market, demand of sugar increases to ON. This is because of the entry of some new buyers of sugar in the market who could not have purchased otherwise. The demand curve for sugar will shift to the right from DD to D₁D₁
24. Explain the conditions for profit maximisation of a firm.
Ans: In economics, profit maximisation is the short run or long ru process by which a firm determines the price and output level that returns the greatest profit. There are several approaches to this problem. The total revenue-total cost perspective relies on the fact that profit equals revenue minus cost and focuses on maximising this difference, and the marginal revenue-marginal cost perspective is based on the fact that total profit reaches its maximum point where marginal revenue equals marginal cost.
In the neoclassical theory of the firm, the main objective of a business firm is profit maximisation. The firm maximises its profits when it satisfies the two rules:
(i) MC = MR and,
(ii) MC curve cuts the MR curve from below.
Maximum profits refer to pure profits which are a surplus above the average cost of production. It is the amount left with the entrepreneur after he has made payments to all factors of production, including his wages of management. In other words, it is a residual income over and above his normal profits.
The profit maximisation condition of the firm can be expressed as:
Maximise p (Q)
Where p (Q)=R (Q)-C (Q)
Where p (Q) is profit, R (Q) is revenue, C (Q) are costs, and Q are the units of output sold.
The two marginal rules and the profit maximisation condition stated above are applicable both to a perfectly competitive firm and to a monopoly firm.
25. Explain briefly any two factors determining price elasticity of demand for a good.
Ans: (a) Availability of substitutes: Demand for a commodity with large number of substitutes will be more elastic. The reason is that even a small rise in its prices will induce the buyers to go for its substitutes. For example, a rise in the price of Pepsi encourages buyers to buy Coke and vice-versa.
Thus, availability of close substitutes makes the demand sensitive to change in the prices. On the other hand, commodities with few or no substitutes like wheat and salt have less price elasticity of demand.
(b) Income Level: Elasticity of demand for any commodity is generally less for higher income level groups in comparison to people with low incomes. It happens because rich people are not influenced much by changes in the price of goods. But, poor people are highly affected by increase or decrease in the price of goods. As a result, demand for lower income group is highly elastic.
(c) Level of price: Level of price also affects the price elasticity of demand. Costly goods like laptop, Plasma TV, etc. have highly elastic demand as their demand is very sensitive to changes in their prices. However, demand for inexpensive goods like needle, match box, etc. is inelastic as change in prices of such goods do not change their demand by ra considerable amount.
(d) Postponement of Consumption: Commodities like biscuits, soft drinks, etc. whose demand is not urgent, have highly elastic demand as their consumption can be postponed in case of an increase in their prices. However, commodities with urgent demand like life saving drugs, have inelastic demand because of their immediate requirement.
26. Explain the two basic conditions of consumer’s equilibrium assuming that the consumers consumes only two goods.
Ans: Conditions of Consumer’s Equilibrium: The Budget line should be Tangent to the Indifference Curve. Given these assumptions, the consumer can buy 5 units of X by spending the entire sum of Rs. 10 on good X or on 10 units of Y. Table 15.4 illustrates some of the possible combination on which Rs.10 can be allocated
Table 4 Expenditure Plan
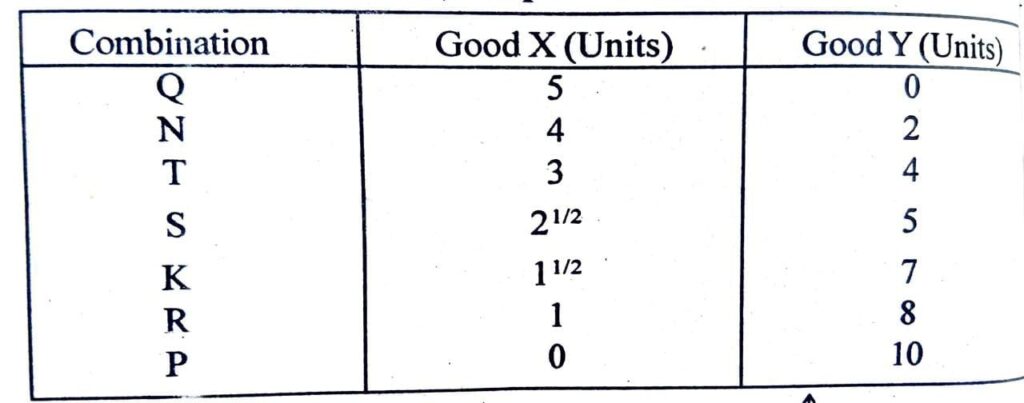
Fig. 16 shows these seven possible combinations indicated by points P, R, K, S,T,N and Q. The line PQ shows combinations of goods X and Y, given their prices, when he spends his income on them. This is because, algebraically I = Px. X + P.Y, where I represents the consumer’s income P and P the prices of goods X and Y, respectively.
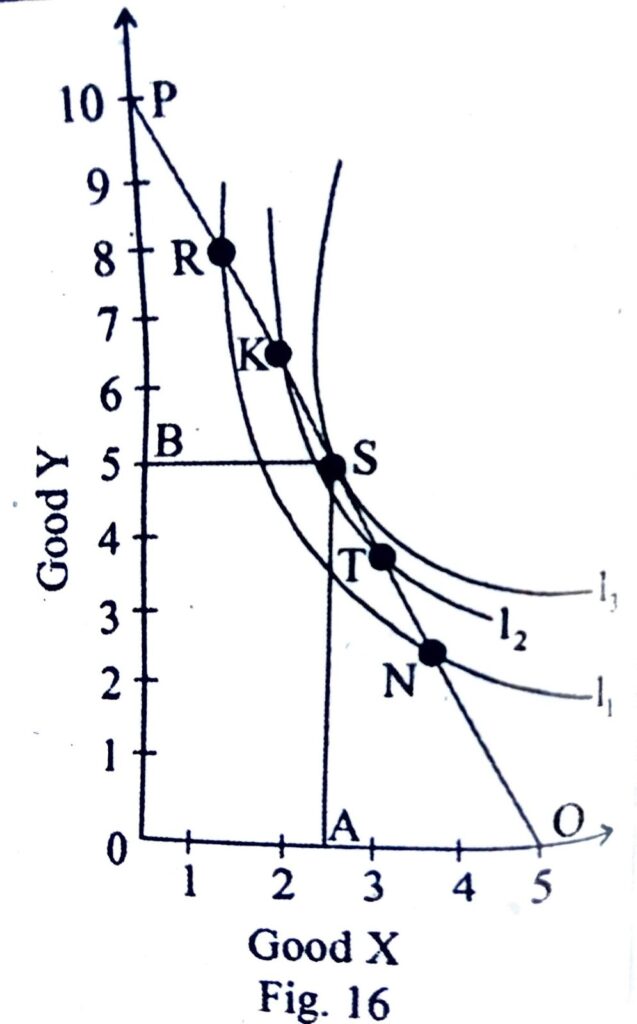
This budget equation is the equation of the line connecting the points Q and P, where Q= I/Px and P=I/Py Thus PQ is the budget line.
On this budget line, the consumer can have any combination, out of the possible seven combinations P, R, K, S, T, N, or Q. Combination Por Qis out of question for in either case he would have only Y or only X. He would not take combination R or N on a lower indifferences curve because combination K or T is also available to him on a higher indifference curve 12.
But there is another combination S which is on the highest indifference curve 13, on this budget line PQ.
Since all other combinations lie on lower indifference curves, they represent lower levels of satisfaction than combination S which is the consumer’s equilibrium point. We may thus enumerate the conditions of consumer’s equilibrium.
The consumer is in equilibrium when his budget line is tangent to an indifference curve. PQ is tangent to curve I, at S. At point S, he is also satisfying the budget equation 1 (Rs 10) = OA. P + OB.PY
= 2½ units of X. Rs. 2+5 units of Y.
Re 1 =Rs 5+ Rs 5 = Rs 10
(2) At the point of Equilibrium the Slope of the Indifference Curve and of the Budget Line should be the same. At S, the slope of the indifference curve is, in fact, the marginal rate of substitution of X for Y and on the budget line it is the ratio of the price of X to the price of Y. The slope of the budget line
PQ=l/?/l/P=l/PY x YPX/I= PX/PY
And the slope of I’ curve is MRSXY.
Thus MRSx=PX/P at point S in Fig. 16.
27. Explain the concepts of change in quantity demanded and change in demand using suitable diagrams.
Ans: A. Change in Demand: A change in demand of a good means a change of the whole purchase plan. It is caused by factors other than the change in the price of the good. Graphically, a change in demand involves a shift of the demand curve. This means greater/smaller quantities demanded than before at the original prices.
B. Change in quantity demanded: A change in quantity demanded of a good refers to a change of quantity demanded as a result of price change of the good. Graphically, the demand curve remains the same. The change is only shown by a “movement along the demand curve”.
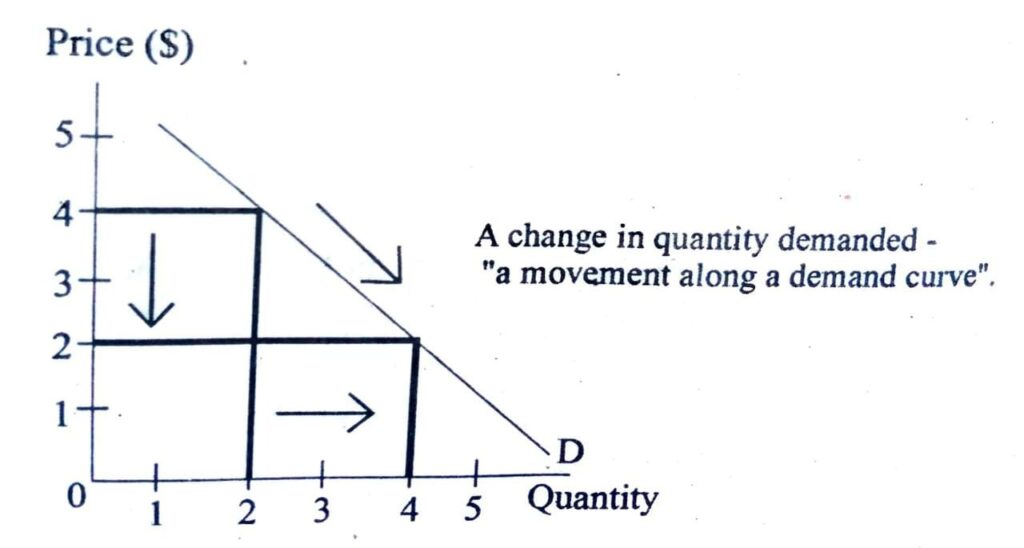
Suppose the price falls from $4 to $2, the quantity demanded will increase from 2 units to 4 units.

Hi, I’m Dev Kirtonia, Founder & CEO of Dev Library. A website that provides all SCERT, NCERT 3 to 12, and BA, B.com, B.Sc, and Computer Science with Post Graduate Notes & Suggestions, Novel, eBooks, Biography, Quotes, Study Materials, and more.


 Buy Now