NCERT Class 8 Science Chapter 5 Coal and Petroleum Solutions to each chapter is provided in the list so that you can easily browse through different chapters NCERT Class 8 Science Chapter 5 Coal and Petroleum and select need one. NCERT Class 8 Science Chapter 5 Coal and Petroleum Question Answers Download PDF. NCERT Class 8 Science Solutions.
NCERT Class 8 Science Chapter 5 Coal and Petroleum
Also, you can read the NCERT book online in these sections Solutions by Expert Teachers as per Central Board of Secondary Education (CBSE) Book guidelines. CBSE Class 8 Science Solutions are part of All Subject Solutions. Here we have given NCERT Class 8 Science Chapter 5 Coal and Petroleum and Textbook for All Chapters, You can practice these here.
Coal and Petroleum
Chapter: 5
NCERT TEXT BOOK EXERCISES
Q. 1. What are the advantages of using CNG and LPG as fuels?
Ans. Advantages of LPG as fuel:
(i) LPG has a high calorific value. Its calorific value is about 50 kJ/g.
(ii) It burns with a smokeless flame and so does not cause any pollution.
(iii) LPG is easy to handle and convenient to store.
(iv) It undergoes complete combustion.
Advantages of CNG as fuel:
(i) It does not cause air pollution.
(ii) It leaves no ash on burning.
Q. 2. Name the petroleum product used for surfacing of roads.
Ans. Bitumen.
Q. 3. Describe how coal is formed from dead vegetation. What is this process called?
Ans. Formation of coal from dead vegetation: About 300 million years ago, there were dense forests in the wet lands that got buried under the surface of the earth due to some environmental changes such as earthquakes, volcanoes and flooding. Gradually, they were covered with many layers of soil and got decomposed. The high pressure and intense heat ultimately converted the purified vegetable remains into coal.
The formation of coal from dead vegetation is known as carbonisation.
Q. 4. Fill in the blanks:
(a) Fossil fuels are _________, _________ and _________.
Ans. Coal, petroleum, natural gas.
(b) Process of separation of different constituents from petroleum is called __________.
Ans. Refining.
(c) Least polluting fuel for vehicles is __________.
Ans. CNG (compressed natural gas)
Q. 5. Tick True/False against the following statements:
(a) Fossil fuels can be made in the laboratory. (T/F)
Ans. False.
(b) CNG is more polluting fuel than petrol. (T/F)
Ans. False.
(c) Coke is almost pure form of carbon. (T/F)
Ans. True.
(d) Coal-tar is a mixture of various substances. (T/F)
Ans. True.
(e) Kerosene is not fossil fuel. (T/F)
Ans. False.
Q. 6. Explain why fossil fuels are exhaustible natural resources.
Ans. It took many hundred years to convert dead plants and animals into fossil fuels. Moreover, reserves fossil fuels are limited in quantity for the use of human activities. Hence, these fossil fuels are called exhaustible natural resources.
Q. 7. Describe the characteristics and uses of coke.
Ans. Characteristics of coke:
(i) It is a tough and porous black substance.
(ii) It is a pure form of carbon.
Uses of Coke
1. Coke is used as domestic fuel.
2. Coke is used as a reducing agent in metallurgical processes.
3. Coke is used for producing fuel gases such as water gas (CO + H₂) and producer gas (CO + N₂).
4. Coke is used for producing carbides such as calcium curbide (CaC2), silicon carbide (SiC) and aluminium carbide (Al4 C₂).
Calcium and aluminium carbides are very useful and cheap raw materials for petro chemical industry. Silicon carbide is very hard and used as an abrasive.
Q. 8. Explain the process of formation petroleum.
Ans. Formation of Petroleum: Petroleum is formed from the bacterial decomposition of remains of plants and animals which got buried under the sea. When these organisms died, they sank to the bottom of the sea and got covered with sand and clay. Due to high pressure, heat, action of bacteria and in the absence of air, the dead remains of tiny plants and animals were slowly converted into petroleum.
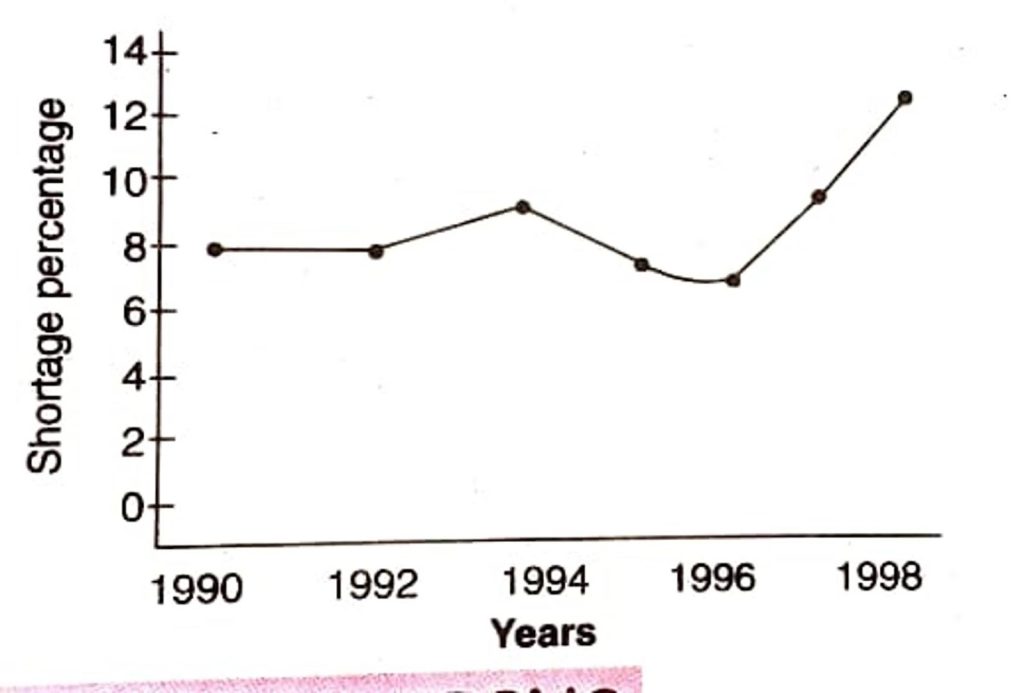
Q. 9. The following table shows the total power shortage in India from 1991-1997. Show the data in the form of a graph. Plot shortage percentage for the year on the Y-axis and the year on the X-axis.
Ans.
| Year | Shortage % | |
| 1. | 1991 | 7.9 |
| 2. | 1992 | 7.8 |
| 3. | 1993 | 8.3 |
| 4. | 1994 | 7.4 |
| 5. | 1995 | 7.1 |
| 6. | 1996 | 9.1 |
| 7. | 1997 | 11.5 |


Hi! my Name is Parimal Roy. I have completed my Bachelor’s degree in Philosophy (B.A.) from Silapathar General College. Currently, I am working as an HR Manager at Dev Library. It is a website that provides study materials for students from Class 3 to 12, including SCERT and NCERT notes. It also offers resources for BA, B.Com, B.Sc, and Computer Science, along with postgraduate notes. Besides study materials, the website has novels, eBooks, health and finance articles, biographies, quotes, and more.


