
Class 11 Economics Chapter 6 Non – competitive Markets, (Assam Higher Secondary Education Council) AHSEC Class 11 Economics Question Answer in English Medium each chapter is provided in the list of AHSEC so that you can easily browse through different chapters and select needs one. Assam Board Chapter 6 Non – competitive Markets Class 11 Economics Question Answer can be of great value to excel in the examination.


AHSEC Class 11 Economics Chapter 6 Non – competitive Markets
Class 11 Economics Chapter 6 Non – competitive Markets Notes cover all the exercise questions in SCERT Textbooks. The SCERT Class 11 Economics Chapter 6 Non – competitive Markets Solutions provided here ensure a smooth and easy understanding of all the concepts. Understand the concepts behind every chapter and score well in the board exams.
Non – competitive Markets
LONG ANSWER QUESTIONS TYPE : ( MARKS : 5)
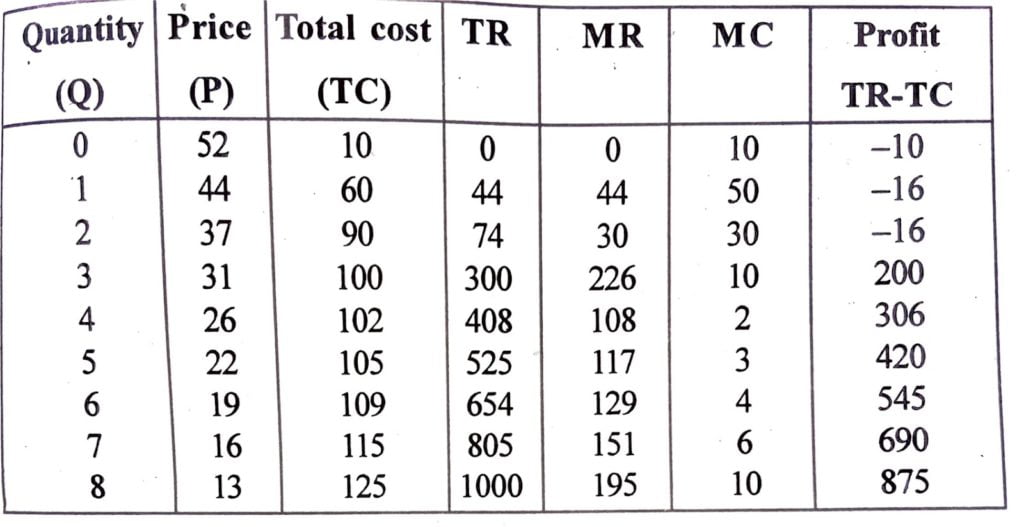
1. The Marginal revenue (MR) and marginal cost (MC) schedule of a monopolists are given below:
Now, (i) find out equilibrium level of output.
(ii) What is the level of profit at the equilibrium output.
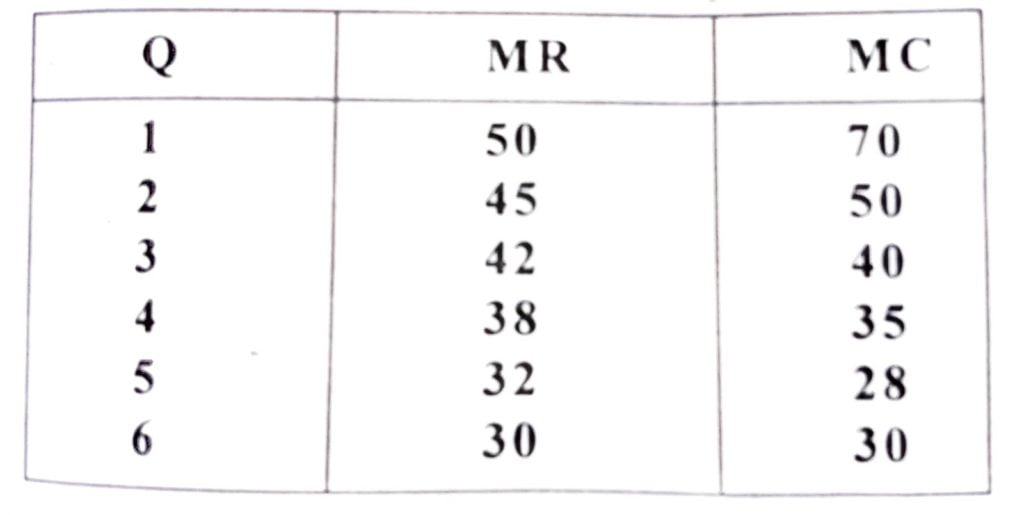
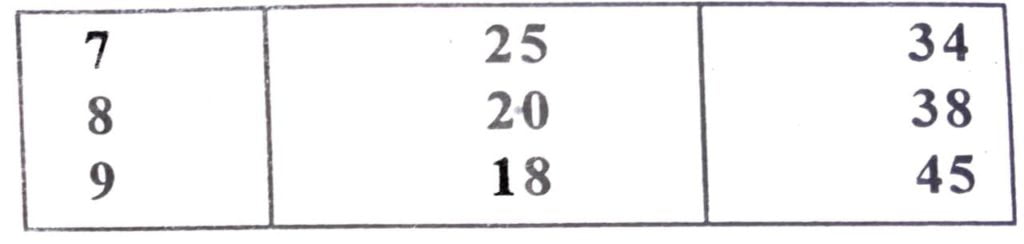
Ans: (a) Quantity price
(b) At 2 units MR and MC are equal.
(c) Equilibrium quantity of output is 2 and the equilibrium price of the commodity is Rs. 37.
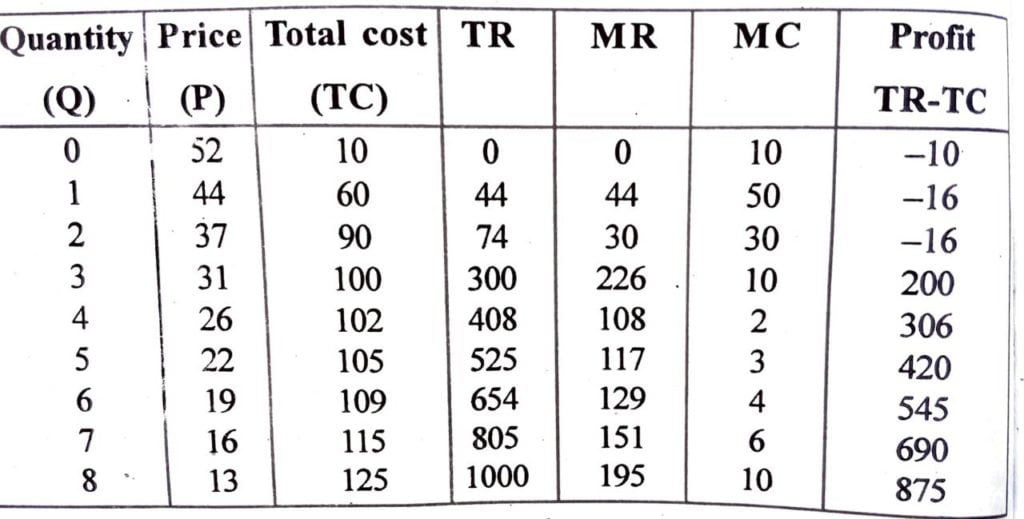
2. The total cost (TC) schedule and the price level (P) of a monopolist faces at different level of output are given.Find out the equilibrium level of output
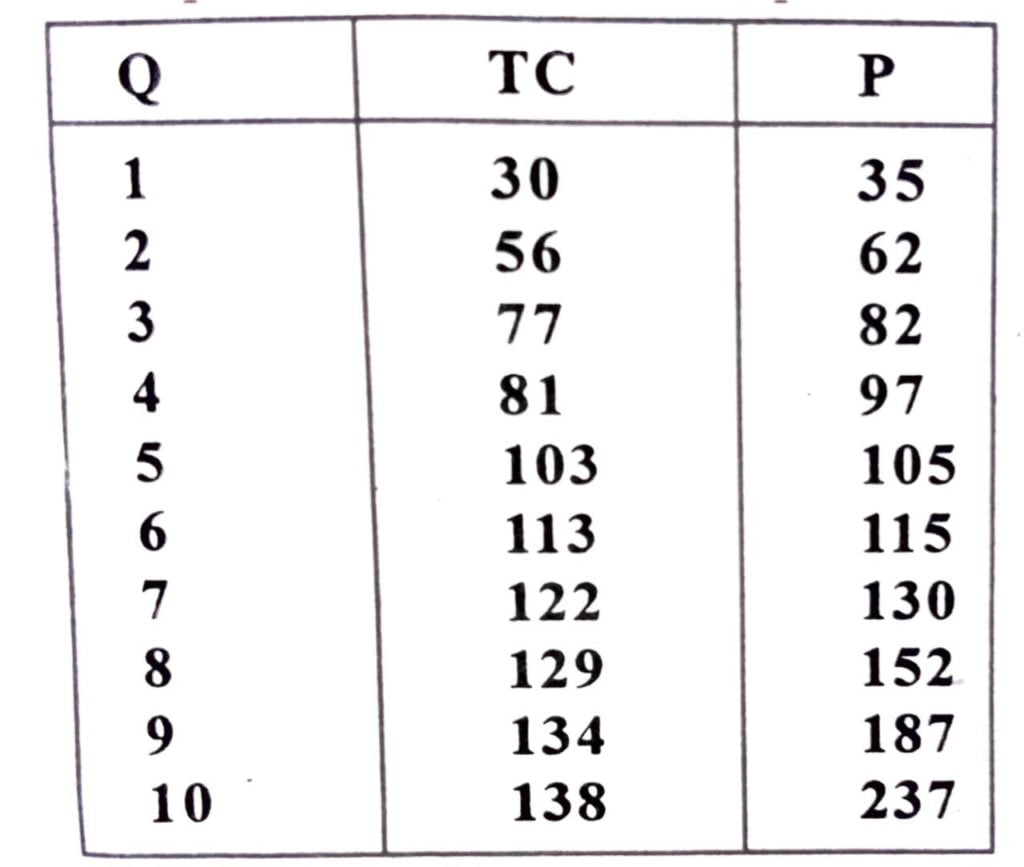
(i) Calculate the marginal revenue (MR) and marginal cost (MC) schedule.
(ii) Find out the equilibrium level of output.
Ans: (a) Quantity price
(b) At 2 units MR and MC are equal.
(c) Equilibrium quantity of output is 2 and the equilibrium price of the commodity is Rs. 37.
3. ‘Monopoly firm is a price maker’―Explain.
Ans:
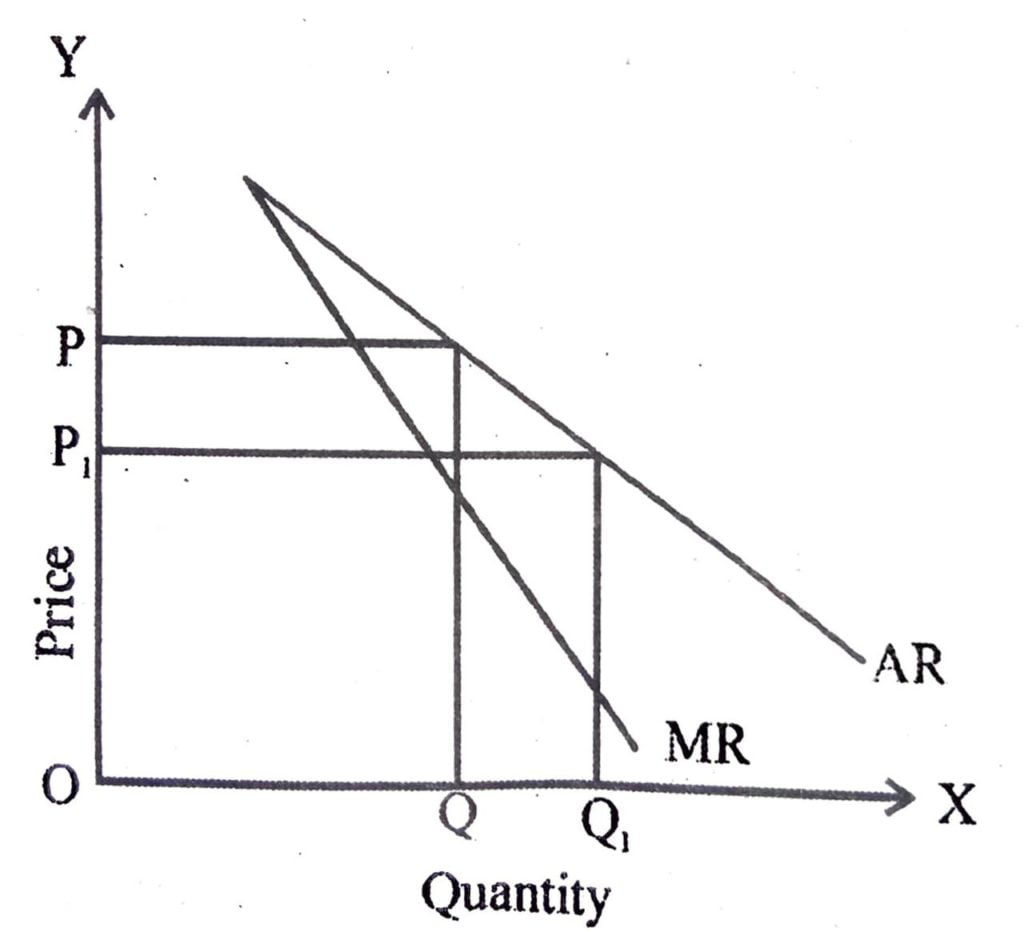
Once the monopolist Fi price of the commodity, quantity demanded will entirely depend upon the buyers. If the buyers feel that price is high, quantity demanded will be low and vice versa. Accordingly, there is an inverse relationship between price fixed by the monopolist and quantity sold by the monopoly firm or quantity demanded of the monopoly product. Thus, demand curve facing a monopoly firm is downward sloping. It is shown in the beside figure. The figure shows that if OP price is fixed by the monopolist, demand for its product will be OQ. In case price is OP₁ quantity demanded is OQ₁. This prove the point that monopolist faces a downward sloping demand curve (AR), which shows that more can be sold only at a lower price. Accordingly, demand curve facing a monopolist is a constraining factor. Unlike a perfectly competitive market, a monopolist can not sell any amount at the given price.
4. Explain the relation among the TR, AR and MR of a monopoly firm with the help of an imaginary table and diagram.
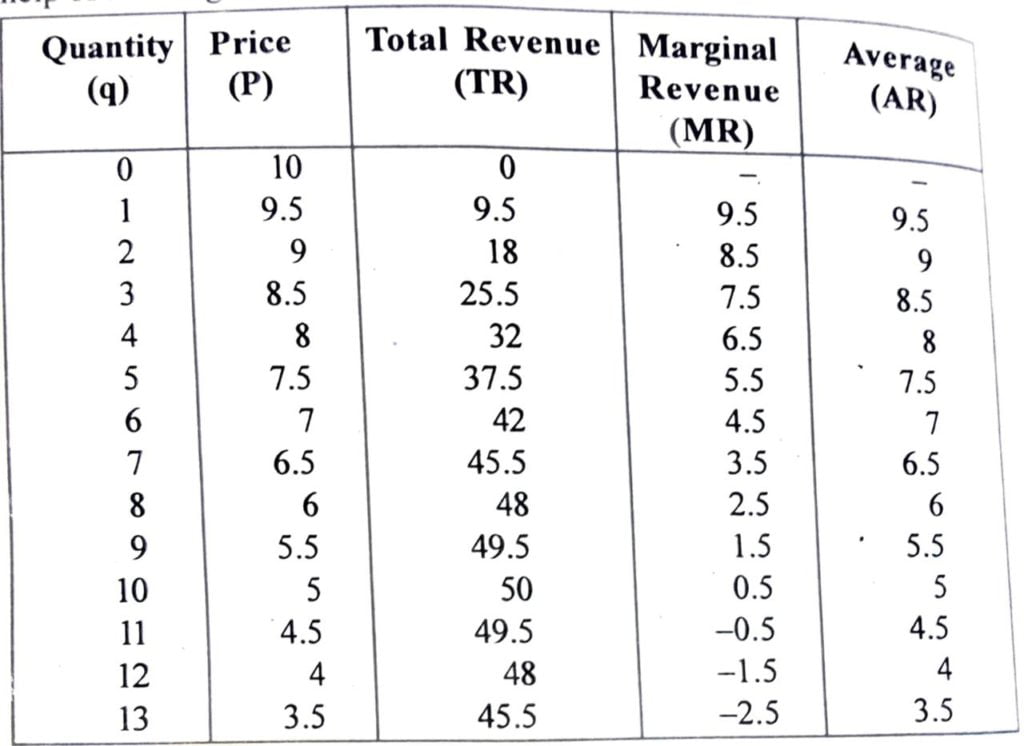
Ans: The total revenue received by the firm from the sale of the commodity equals the product of the price and the quantity sold. In the monopoly firm, the total revenue curve is not a straight line. It’s shape depends on the shape of demand curve. The relation between total revenue, marginal revenue and average revenue can be shown with the help of a table given below―
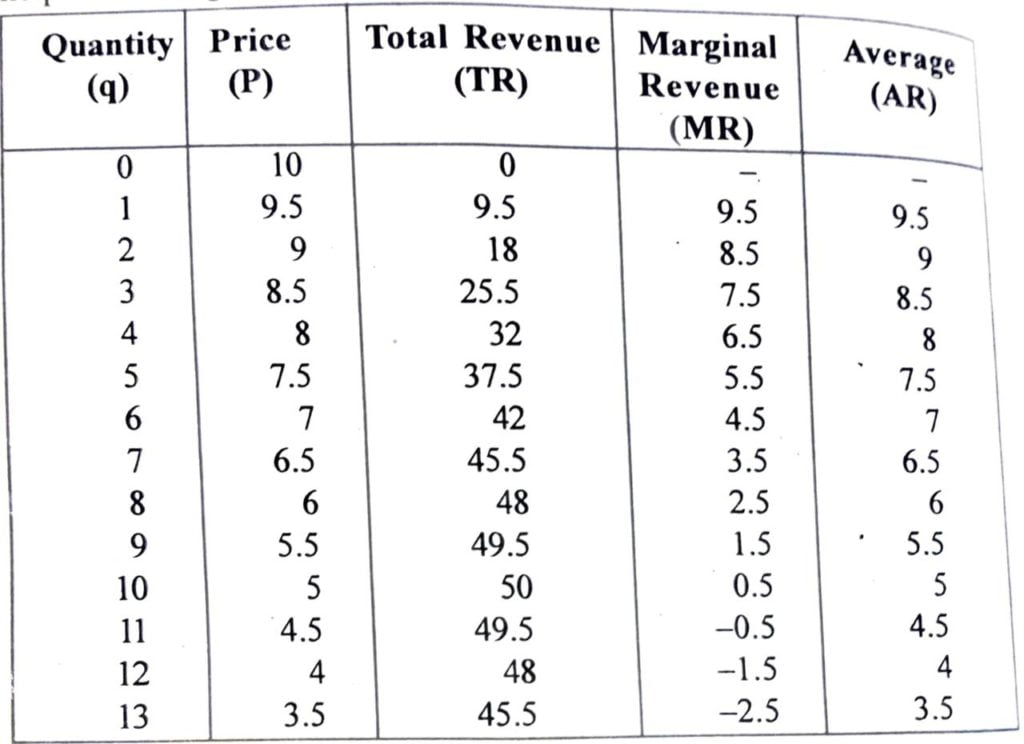
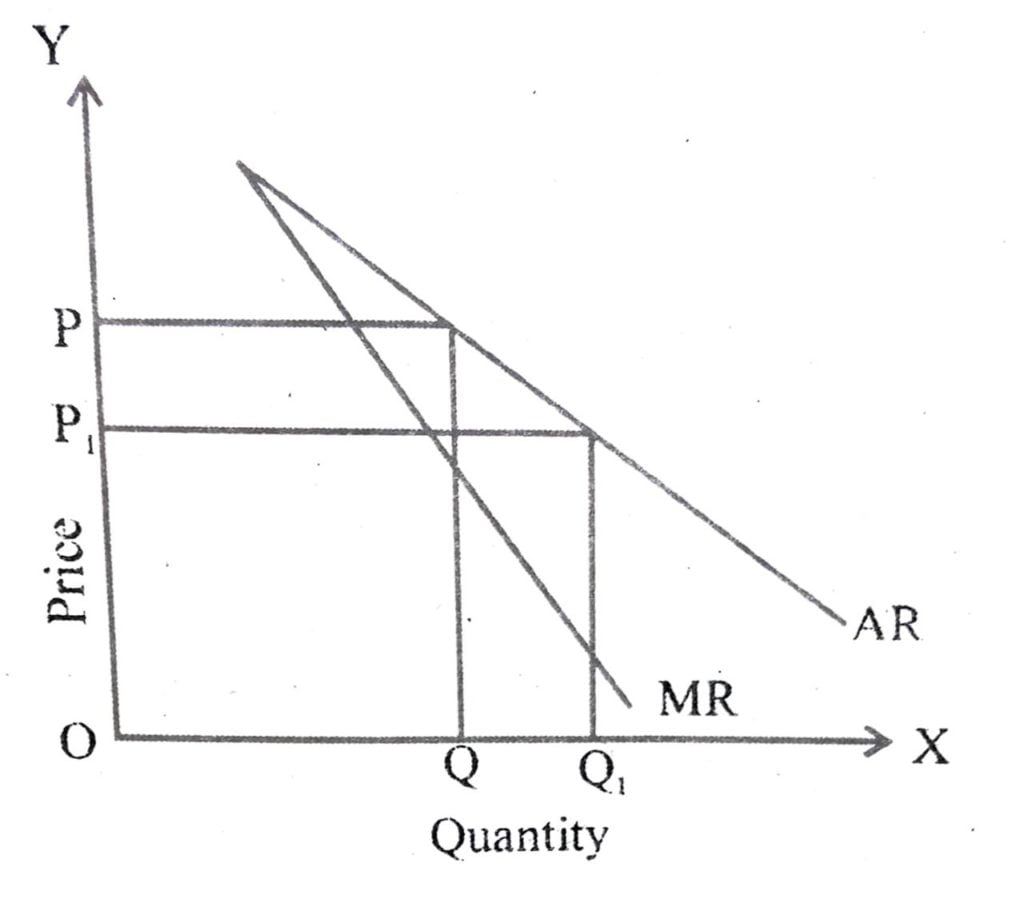
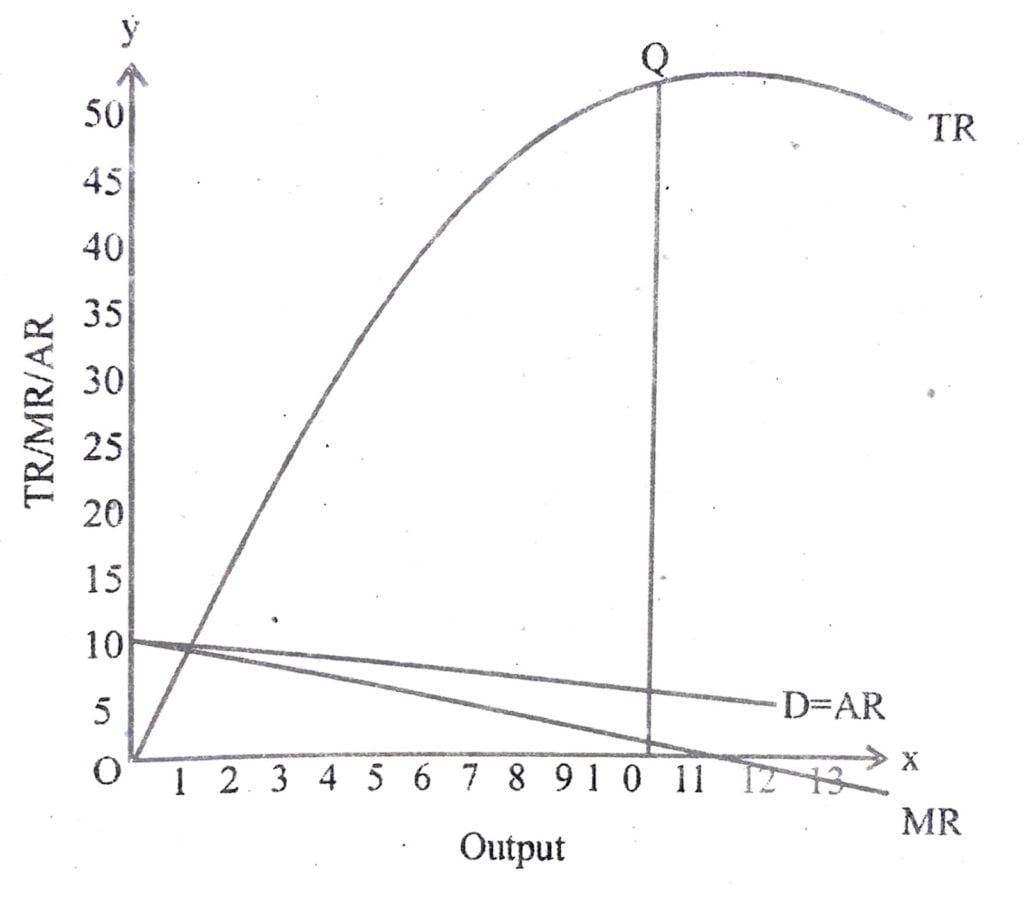
If we put the values of TR, AR, MR and Quantity in a diagram, we will get the TR, AR, MR curves.
In the diagram above, it can be noticed that as quantity increases, TR increases to 50 when output is 10, after his level of output TR declines. The revenue received by the firm per unit of commodity sold is called the average revenue (AR). TR increases more slowly as quantity sold increases and falls after quantity reaches 10 units and MR value also falls as after quantity increases. After quantity reaches 10, MR has negative values. When TR is rising, MR is positive and when TR is falling MR is negative. Another relation between AR and MR curves is that curve lies below the AR curve. The same can be seen in the table also, where the values of MR at any level of output are lower than the corresponding values of AR. If AR curve is falling steeply, the MR curve is far below the AR curve. On the other hand, if the AR curve is less steep, the vertical distance between the AR and MR curve is smaller.

5. Show that the Marginal revenue of a monopoly firm at any level of output can have by the slope of the total revenue curve at that level of output.
Ans:
Once the monopolist Fi price of the commodity, quantity demanded will entirely depend upon the buyers. If the buyers feel that price is high, quantity demanded will be low and vice versa. Accordingly, there is an inverse relationship between price fixed by the monopolist and quantity sold by the monopoly firm or quantity demanded of the monopoly product. Thus, demand curve facing a monopoly firm is downward sloping. It is shown in the beside figure.
The figure shows that if OP price is fixed by the monopolist, demand for its product will be OQ. In case price is OO1, quantity demanded is OQ1. This prove the point that monopolist faces a downward sloping demand curve (AR), which shows that more can be sold only at a lower price. Accordingly, demand curve facing a monopolist is a constraining factor. Unlike a perfectly competitive market, a monopolist can not sell any amount at the given price.
6. Explain the relation between AR and MR of a monopoly market with the help of a diagram.
Ans: The total revenue received by the firm from the sale of the commodity equals the product of the price and the quantity sold. In the monopoly firm, the total revenue curve is not a straight line. It’s shape depends on the shape of demand curve. The relation between total revenue, marginal revenue and average revenue can be shown with the help of a table given below―
If we put the values of TR, AR, MR and Quantity in a diagram, we will get the TR, AR, MR curves.
In the diagram above, it can be noticed that as quantity increases, TR increases to 50 when output is 10, after his level of output TR declines. The revenue received by the firm per unit of commodity sold is called the average revenue (AR). TR increases more slowly as quantity sold increases and falls after quantity reaches 10 units and MR value also falls as after quantity increases. After quantity reaches 10, MR has negative values. When TR is rising, MR is positive and when TR is falling MR is negative. Another relation between AR and MR curves is that curve lies below the AR curve. The same can be seen in the table also, where the values of MR at any level of output are lower than the corresponding values of AR. If AR curve is falling steeply, the MR curve is far below the AR curve. On the other hand, if the AR curve is less steep, the vertical distance between the AR and MR curve is smaller.
7. Explain the concept of short-run equilibrium of a monopoly market by assuming zero costs.
Ans:
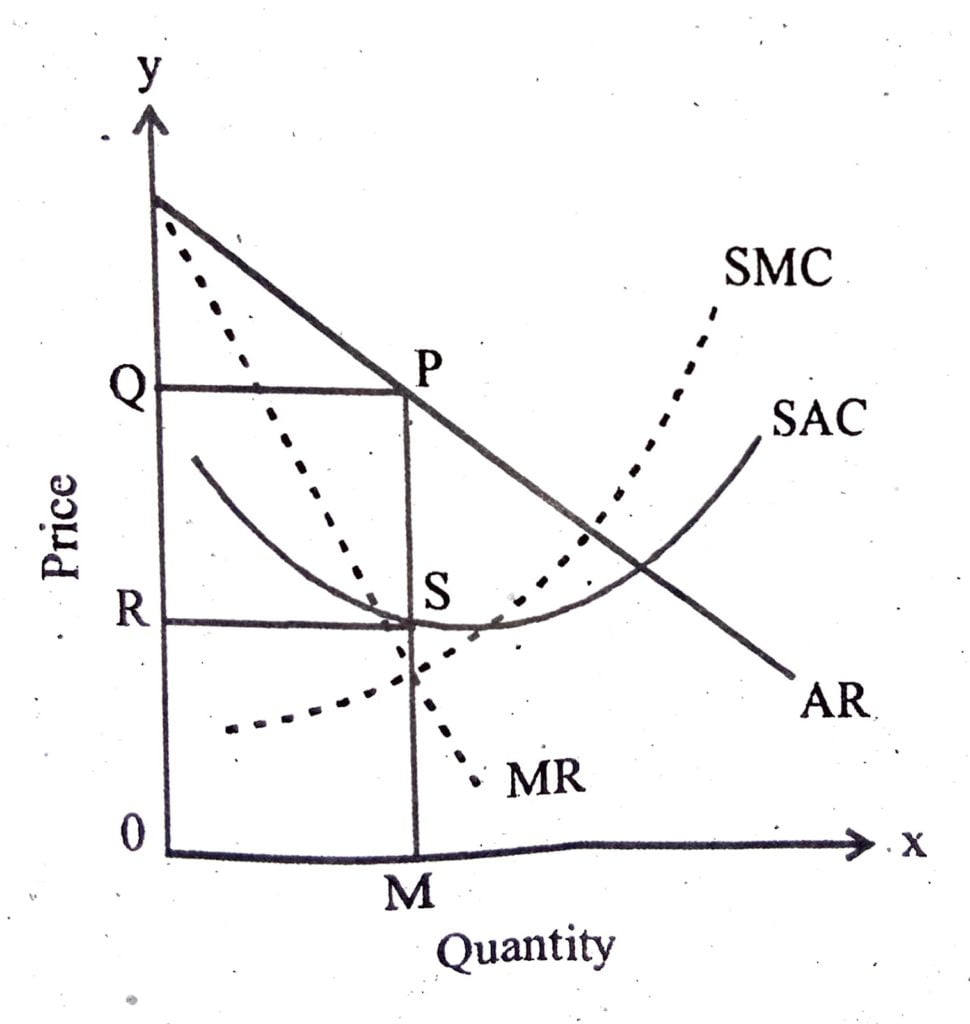
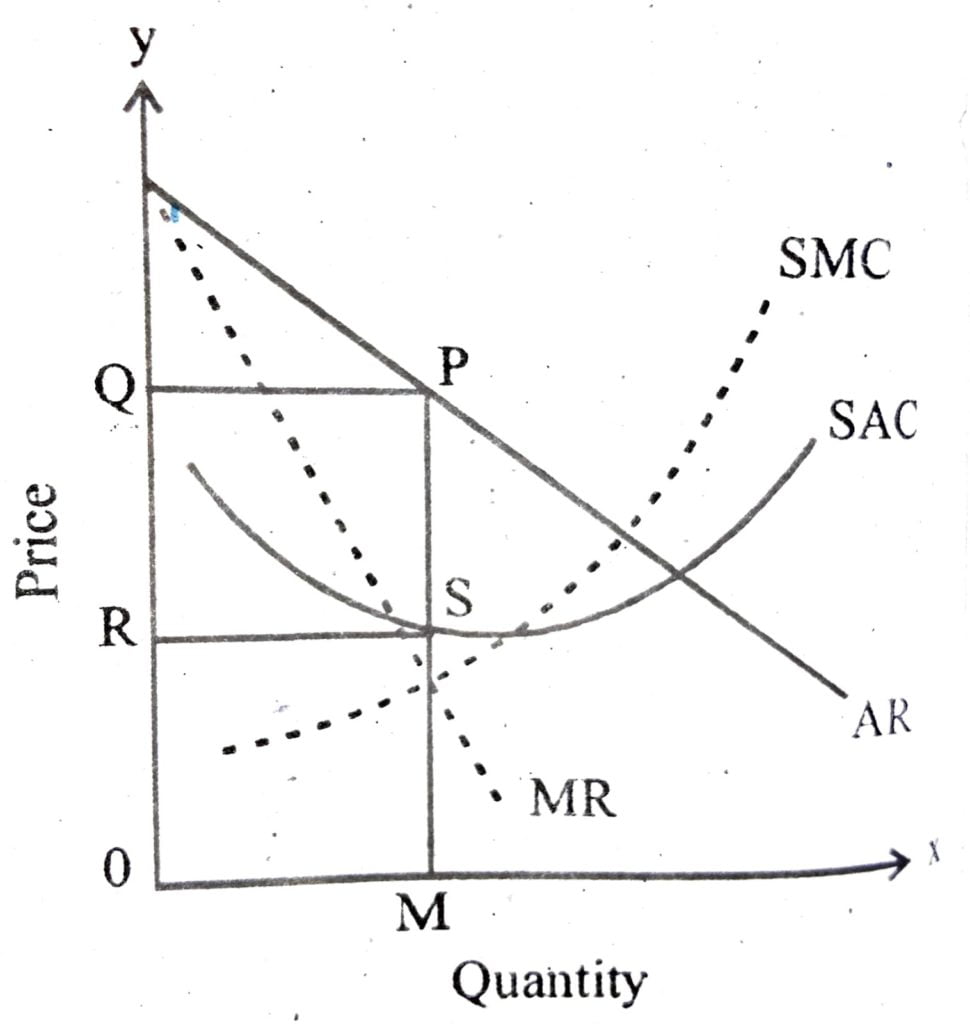
In the short period, the monopolist behaves like any firm. His aim is minimization of losses. Profits are maximised when marginal cost is equated to marginal revenue. A monopolist with no close substitutes of his product should be able to keep the price of his product at least equal to fit short run average cost, so as to avoid losses. But a monopolist referring losses in the short run is not an impossibility.
The attached figure shows the determination of price and output by a monopolist. The output at which his marginal cost curve (SMC) equals his marginal revenue curve is OM. It is the equilibrium output.
At this output, the average revenue (price) is MP and average cost (SAC) is MS. Per unit profit is MP=MS=PS. The total profit area is PSRQ.
8. Show how does a monopolist earn profit by using total cost curve and total revenue curve.
Ans:
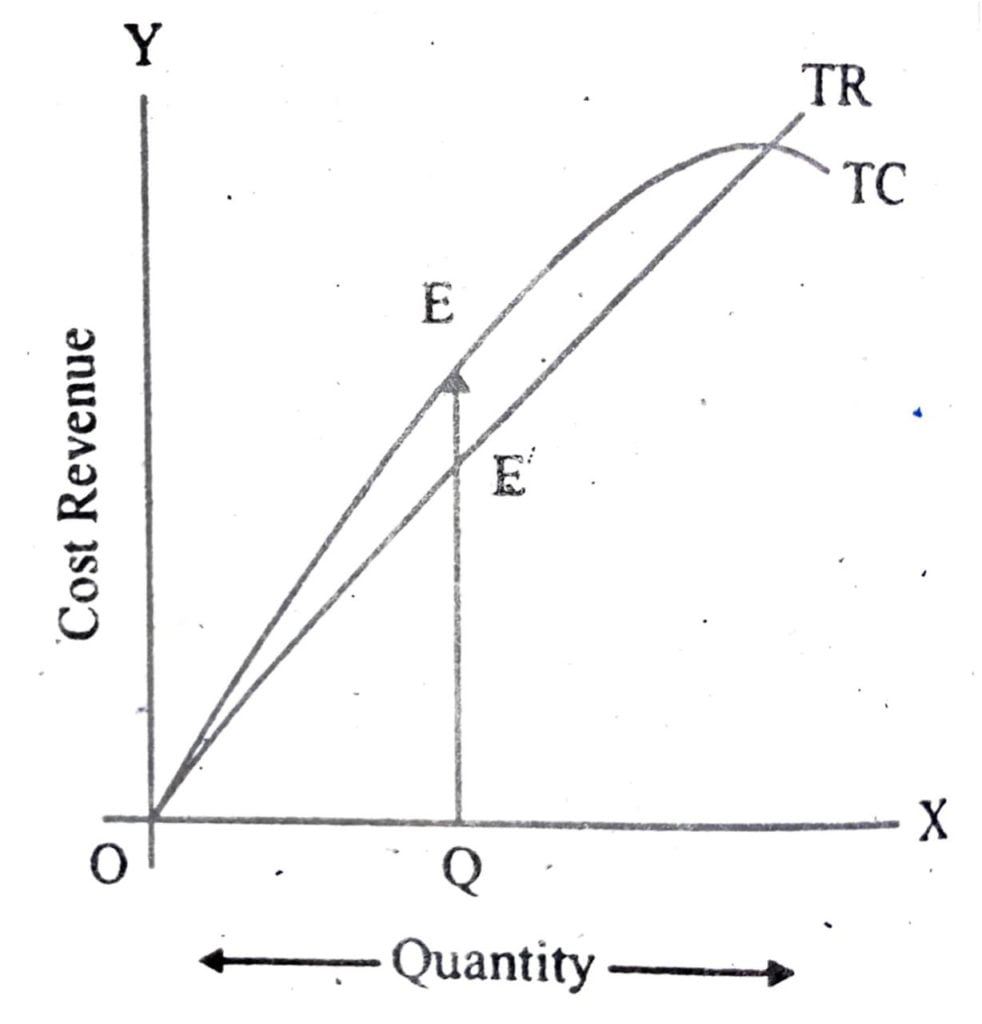
A monopolist firms will earns profit at that level of output where the difference between TC and TR is the highest.
At OQ the gap between TR & TC is highest, ie, EE. Therefore the firm will attain equilibrium at this particular portion with oq equilibrium quantity.
9. By using average and marginal cost curve explain how does a monopolist reaches it’s equilibrium position. Show the level of maximum profit in this respect. market by assuming zero costs.
Ans:
In the short period, the monopolist behaves like any firm. His aim is minimization of losses. Profits are maximised when marginal cost is equated to marginal revenue. A monopolist with no close substitutes of his product should be able to keep the price of his product at least equal to fit short run average cost, so as to avoid losses. But a monopolist referring losses in the short run is not an impossibility.
The attached figure shows the determination of price and output by a monopolist. The output at which his marginal cost curve (SMC) equals his marginal revenue curve is OM. It is the equilibrium output.
At this output, the average revenue (price) is MP and average cost (SAC) is MS. Per unit profit is MP=MS=PS. The total profit area is PSRQ.
10. Explain the three conditions in which oligopoly firms may behave in determining their price output.
Ans: The three different ways in which oligopoly firms may behave are :
(i) Individual firms may adopt independent price and output policies.
(ii) At another time, they may desire to form a caste to reap monopoly profits.
(iii) Firms may maintain a fixed price of their products which is known as price-rigidity.
11. The total cost (TC) and total revenue (TR) of a monopolist given below :
| Quantity(Q) Average | 1 | 2 | 3 | 4 | 5 | 6 | 7 |
| Revenue(AR) | 20 | 38 | 53 | 65 | 75 | 83 | 88 |
| Total Cost (AR) | 15 | 7 | 37 | 42 | 52 | 67 | 87 |
Find out the equilibrium level of output.
Ans: See Q.No. 2 (Long Type).
12. Explain with diagram that the price of the commodity under perfect competition is lower as compared to monopoly.
Ans:
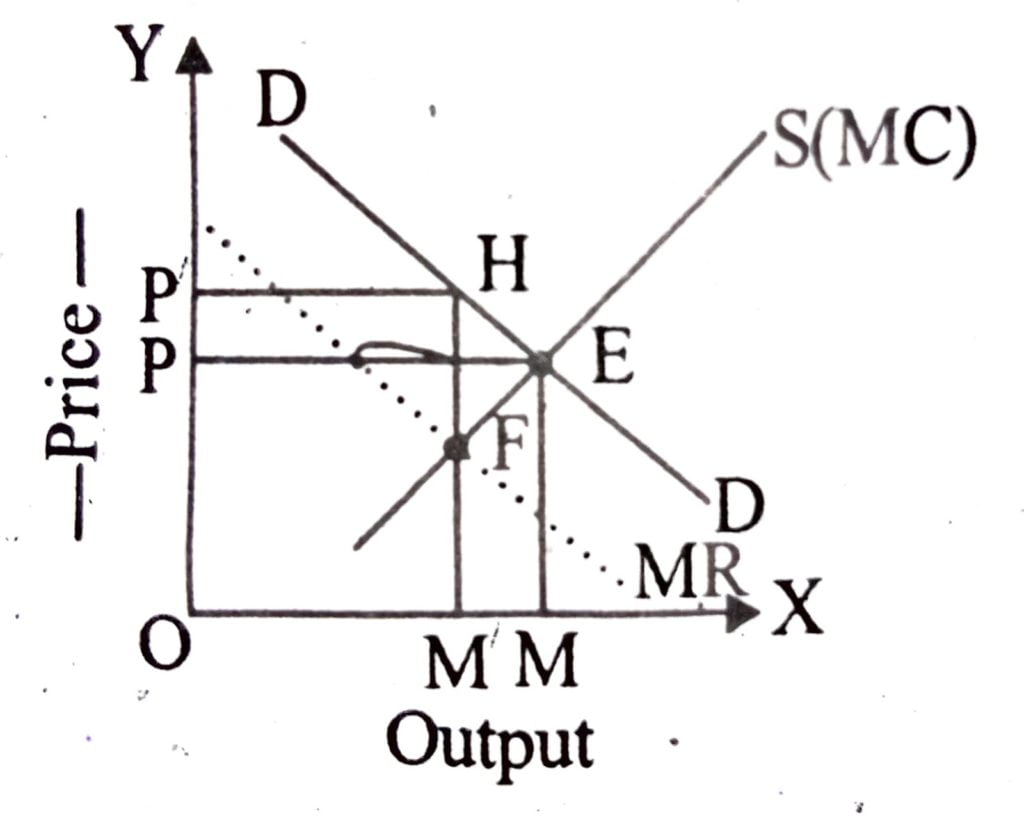
It is shown units the help of the following diagram that the price of the commodity under perfect competition is lower as compared to monopoly.
In this diagram the curve DD and SS are demand and supply curves of the perfectly competitive industry. The two curves intersect each others at point E and as a result price is output OP and output OM. The marginal revenue curve MR is drawn corresponding to the demand curve DD and the curves SS the supply curve of perfectly competitive industry will be the marginal cost curve of the monopoly. The marginal revenue curve MR cuts the marginal cost MC at point E in the figure above and the monopoly price OP and output OM are determined. It is thus clear that if the cost conditions remains unchanged, the combination of firms to form a monopoly has resulted in a higher price and a lower output of the product.
13. Explain with diagram that the monopolistic competitive firms produces lower output as compared to the perfectly competitive firm.
Ans:
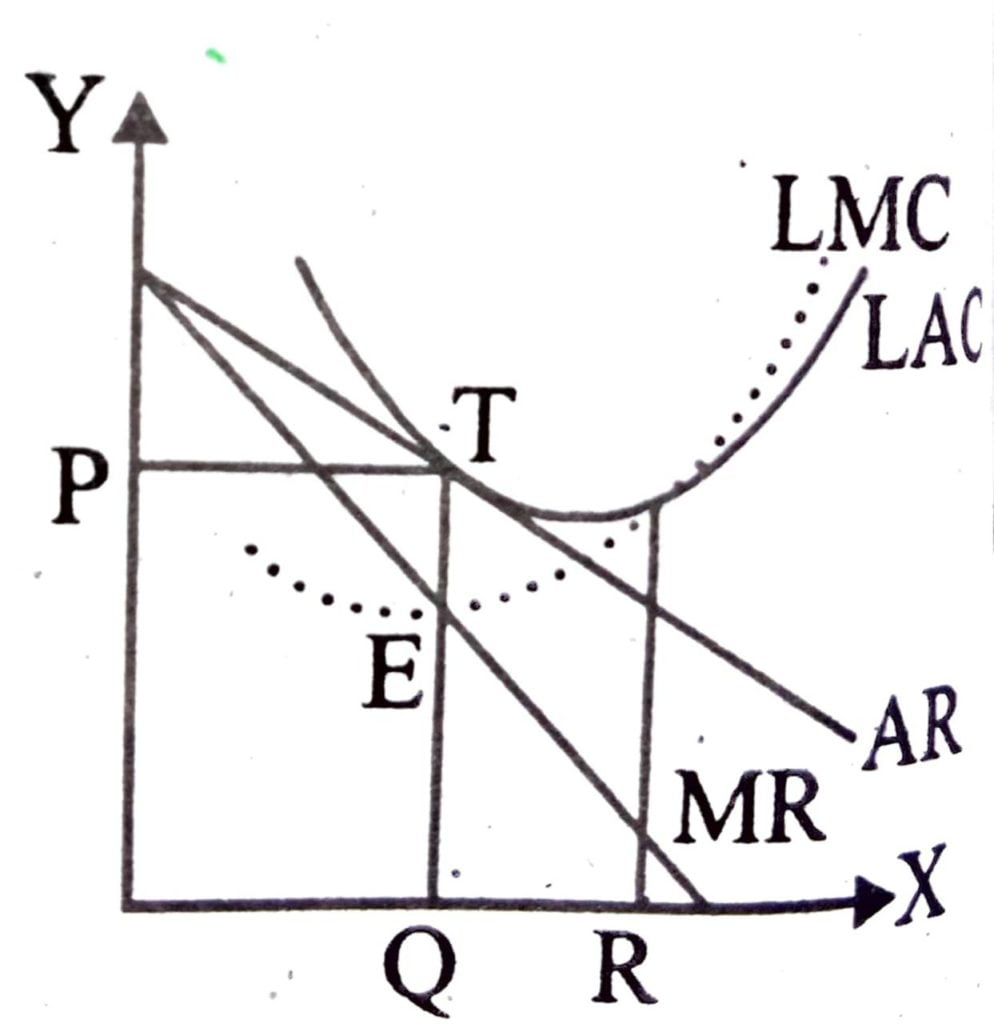
The monopolistic firm produce lower output as compared to the perfectly competitive firm. It is shown with the help of the diagram under perfect competition the firm is established at the minimum point of the average cost curve.
In other words a firm under perfect competition tends to be of the optimum size. But a firm under monopolistic competition as is evident from the above figure start short of the optimum point and operates at the point at which average cost is still falling. In the figure the firm produces output.
OQ while a firm under perfect competition would have produced output OR at which average cost is minimum. The firm under monopolistic competition can reduce it’s cost of production by expanding output to the point R but it will not do so because by expending output beyond OQ it will be therefore, clear that by producing OQ instead of OR, the firm under monopolistic competition does not use it’s capacity fully. The capacity equal to QR is lying unused in the firm’s long run equilibrium under monopolistic competition.
14. Explain the similarities and dissimilarities of firms under perfect competition and monopolistic competition.
Ans: similarities of the firms under perfect competition and monopolistic competition are as follows:
(i) In both the markets, the number of buyers and sellers is large.
(ii) There are not restrictions on the entry or exit of firms from the market.
(iii) In both the markets the principal goal of a firm is to maximise it’s profit.
(iv) Each firm earns only normal profit in the long run. Dissimilarities of firm under perfect competition and monopolistic competition are as follows.
(a) A perfectly competitive firm faces perfect by elastic demand curve and a monopolistic firm has a negatively sloped demand curve.
(b) Products of all sellers under a perfectly competitive firm are homogeneous. Products of a monopolistic firm are different but close substitute of one another.
(c) Under perfect competition products have uniform price. Each firm is a price taker. Under monopolistic competition different sellers charge different price for their protect.
(d) There is no selling cost in perfect competition. But selling cost is thus in monopolistic competition.
15. The demand and supply functions of a firm under perfectly competitive market are given below:
Qd = 200-2p and
Qs = -100 + 3p
Find (i) The equilibrium level of output and price.
(ii) If due to increased cost, the supply function becomes Qs=- 200+ 3p, what will be the changes in equilibrium price and quantity?
Ans: Given Qd = 200-2P Q₂ = -100+3p
In equilibrium,, Qd=Qs
∴ 200-2P = -100+3P
⇒ 200+100=3P+2P
⇒300=5P
⇒60=P
∴ Qd = 200-2×60
= 200-120
= 80
(i) The equilibrium output is 80 unit equilibrium price is Rs. 60
(ii)When Supply function is Qs =-300+3P
16. Explain the implications of the features, “Product differentiation” and “Selling Costs” under monopolistic competition.
Ans: Product Differentiation: Under monopolistic competition products are differentiated. This is the outstanding features of this form of market. Otherwise monopolistic competition closely resemble perfect competition. The fundamental difference between the two is that products are no more homogeneous. Goods produced are deliberately differentiated.By differentiation we mean the goods are made to appear somewhat different and superior to those produced by other firms. Product differentiation may be real or apparent. By real differentiation we mean that a difference is maintained in some physical or chemical composition of a product or in the taste and appearance of that product. This is easily done with the help of attractive packaging; or some extra services are rendered. A product can also be marketed as superior using local advantage. When products are differentiated more buyers are likely to be attracted. Thereby the firm gains extra control over demand and market conditions. The demand curve of a firm will then alter to the advantage of a firm. It will become more flexible and shift upwards. A firm’s capacity to alter the demand curve for its own products is the chief analytical feature of monopolistic competition. Under no other from of market do producers attempt to influence the demand which is entirely based on consumer behaviour. Gains of product differentiation have been shown in Figure 49. In the figure dd is the original demand curve that the firm faces before product differentiation.
On this demand curve at market price P the firm sells output Q. When the firm differentiates it’s product successfully it’s demand curve alters and is now d1d1. On the new demand curve the firm at point R1 can charge a price as high as P1 and sell old output Q. It could also charge the same price P and sell a very large output Q1 at point R3. Or then the firm could choose a somewhat higher price (higher than P1 but lower than P2) P2 at point R2 and sell a somewhat larger quantity Q2.
Selling ( Advertising) Cost : Selling Cost (SC) is another outstanding feature of a monopolistic competitive market. This in the form of advertisement expenditure. Selling Cost and product Differentiation together enable the producer to maintain some control over market conditions and influence the shape of the demand curve. Both features are interdependent. Whenever a product is differentiated it is necessary to inform buyers; and advertisement is the only medium through which buyers can be told about superiority of that product. Selling Cost by itself is apparent product differentiation. When a product does not contain any genuine quantitative difference, buyers can be made to treat a product differently through advertisements. So whenever products are differentiated and advertised, the market becomes a monopolistic competition. These are the hallmarks of this form of market. The presence of selling cost increases the firm’s cost of production. In order to recover it, firms have to charge a higher price. The net effect of a monopolistic competitive market is pricing goods at a higher rate. Consumers have to bear this extra expenditure.
17. Write down three characteristics of monopolistic competition. State whether the output produced by a firm under such a market is higher/lower than or equal to that of a firm under perfect competition.
Ans: Features of Monopolistic Competition:
(a) Large Number of Sellers : There are large number of firms selling closely related, but not homogeneous products. Each firm acts independently and has a limited share of the market. So, an individual firm has limited control over the market price. Large number of firms leads to competition in the market.
(b) Products Differentiation : Each firm is in a position to exercise some degree of monopoly (in spite of large number of sellers) through product differentiation. Product differentiation refers to differentiating the products on the basis of brand, size, colour, shape, etc. The product of a firm is close, but not perfect substitute of other firm.
(c) Freedom of Entry and Exit : Under monopolistic competition, firms are free to enter into or exit from the industry at any time they wish. It ensures that three are neither abnormal profits nor any abnormal losses to a firm in the long run. However, it must be noted that entry under monopolistic competition is not as easy and free as under perfect competition.
The output produced by a firm under such a market is lower than that of a firm under perfect competition.

Hi, I’m Dev Kirtonia, Founder & CEO of Dev Library. A website that provides all SCERT, NCERT 3 to 12, and BA, B.com, B.Sc, and Computer Science with Post Graduate Notes & Suggestions, Novel, eBooks, Biography, Quotes, Study Materials, and more.
