
Class 11 Economics Chapter 5 Market Equilibrium, (Assam Higher Secondary Education Council) AHSEC Class 11 Economics Question Answer in English Medium each chapter is provided in the list of AHSEC so that you can easily browse through different chapters and select needs one. Assam Board Chapter 5 Market Equilibrium Class 11 Economics Question Answer can be of great value to excel in the examination.


AHSEC Class 11 Economics Chapter 5 Market Equilibrium
Class 11 Economics Chapter 5 Market Equilibrium Notes cover all the exercise questions in SCERT Textbooks. The SCERT Class 11 Economics Chapter 5 Market Equilibrium Solutions provided here ensure a smooth and easy understanding of all the concepts. Understand the concepts behind every chapter and score well in the board exams.
Market Equilibrium
LONG ANSWER QUESTIONS TYPE: (MARKS : 5)
1. Explain the concept of market equilibrium with the help of demand and supply curve. With the same diagram trace out the situations of excess demand and excess supply.
Ans:
Equilibrium for a perfectly competitive market with fixed number of firms is explained with the help of a figure.
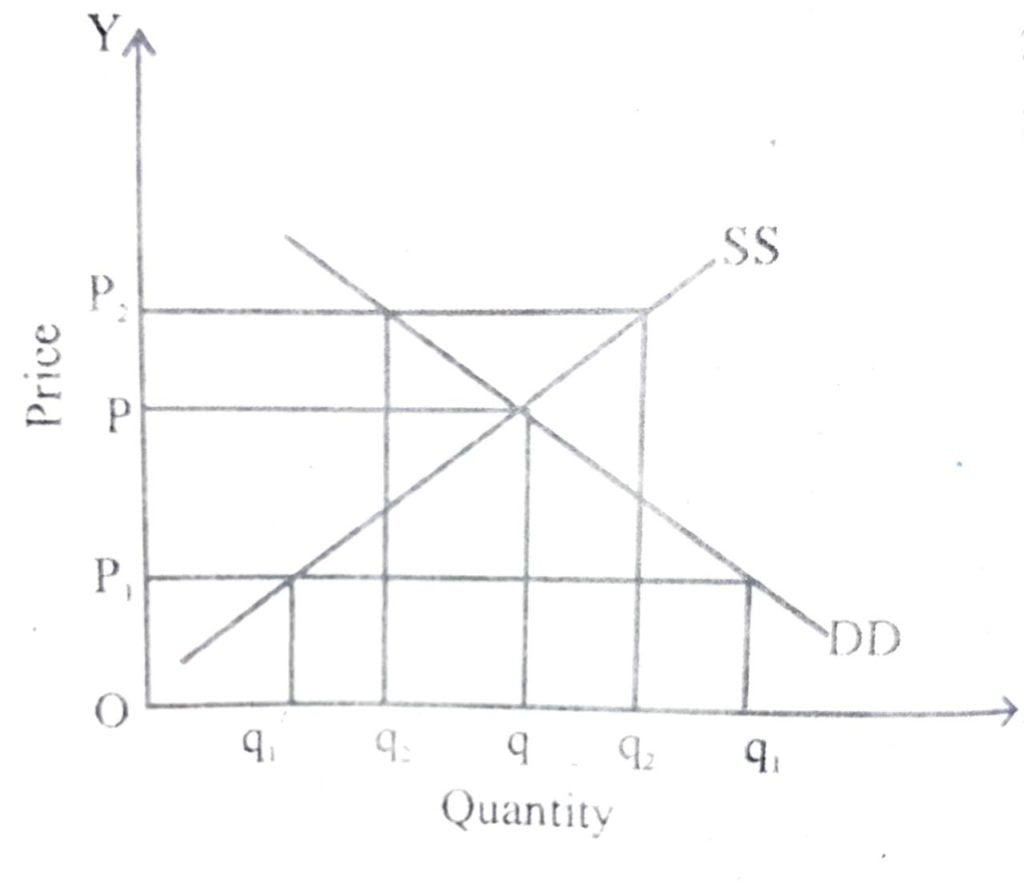
In the figure, SS denotes the market supply curve and DD denotes the market demand curve for a commodity. The market supply curve SS shows how much of the commodity firms would wish to supply at different DD tells how much of the would be willing to purchase at different prices. Graphically, an equilibrium is a point where the market supply curve intersects the market demand curve because this is where the market demand equals market supply. At any other point, either there is excess supply or there is excess demand.
If the prevailing price is P₁, whereas the market supply is q₁, there is excess demand in the market equal to q₁q₁. Some consumers who are either unable to obtain the commodity at all or obtain it in insufficient quantity will be willing to pay more than P. The market price tend to increase. All other things remaining constant as price rises, quantity demanded falls, quantity supplied increases and the market moves towards the point where the quantity that the firms want to sell is equal to the quantity that the consumers want to buy. At p the supply decisions of the firms match the demand decisions of the consumers.
Similarly, if the prevailing price is P₂ the market supply (q₂) will exceed the market demand (q₂) at that price, giving rise to excess supply equal to q₂q₂. Under such a circumstance, some firms will not be able to sell their sed quantity, so, they will lower their price. All other things remaining estant as price falls, quantity demanded rises, quantity supplied falls, dat P the firms are able to sell their desired output since market demand equals market supply at that price. Therefore P is the equilibrium price and the corresponding quantity q is the equilibrium quantity.
2. Explain how is wage determined under perfect competition.
Ans:
In a perfectly competitive market, the wage rate is determined at the intersection of the demand and supply curves of labour, where the demand for and supply of labour balance. We shall now see what the demand and supply curves of labour look like.
To examine the demand for labour by a single firm, we assume that the our is the only variable factor of production and the labour market is perfectly competitive, which in turn, implies that each firm takes wage e as given.
The firm being a profit-maximizer will always employ labour up to point, where the extra cost she curs for employing the last unit labour is equal to the additional benefit she earns from that unit. The extra cost of hiring one more unit of labour is the wage rate (w) be extra output produced by one more unit of labour is its marginal product (MP₁) and by selling each extra unit of output, the additional earning of the firm is the marginal revenue (MR) she gets from that unit. Thus, while hiring labour, the firm employs labour up to the point where.
wa= MRPL and MRP = MR x MPL
Since we are dealing with a perfectly competitive firm, marginal revenue is equal to the price of the commodity and hence, marginal revenue product of labour in this case is equal to the value of marginal product of labour (VMPL). As long as the VMP, greater than the wage rate, the firm will earn more profit by hiring one more unit of labour and if at any level of labour employment VMP₂ is less than the wage rate the firm can increase her profit by reducing a unit of labour employed.
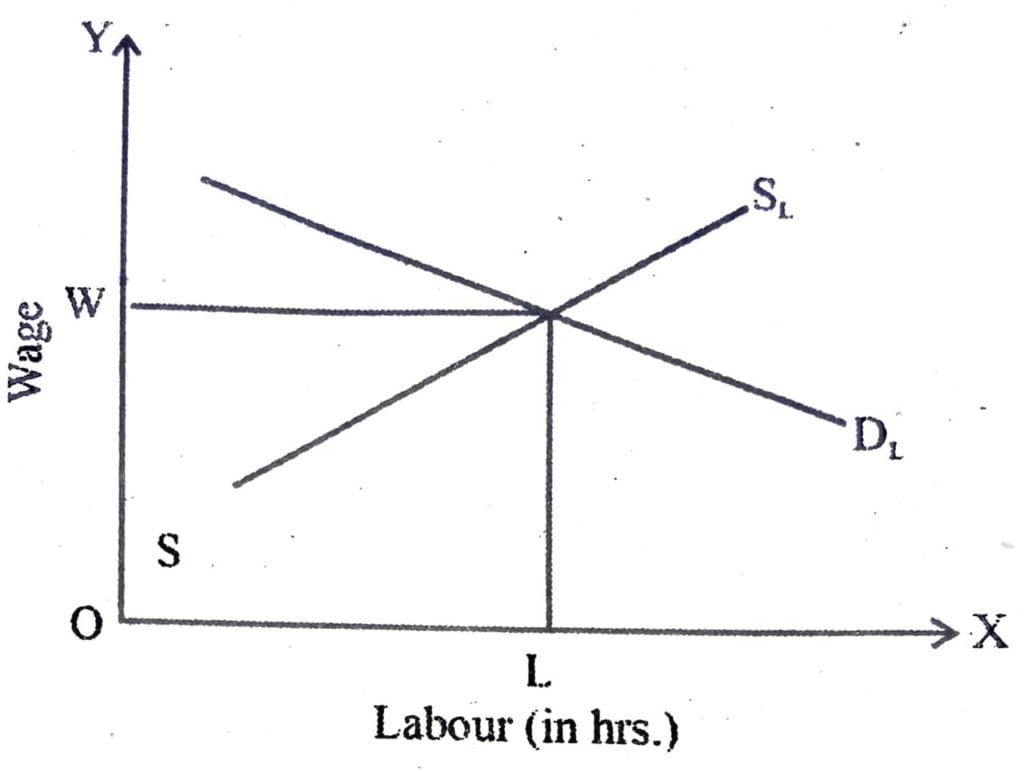
Given the assumption of the law of diminishing marginal product, the fact that the firm always produce at w= =VMP, implies that the demand curve for labour is downward sloping. The following diagram illustrate this― In the diagram, D, and S, is the demand and supply curve of labour. With an upward sloping supply curve, and downward sloping demand curve the equilibrium wage rate is determined at the point, where these two curves intersect. In other words, where the labour that the household wish to supply is equal to the labour that the firms wish to hire.The equilibrium wage rate is Ow.
3. Show and explain how market equilibrium changes due to the shifting of the demand curve.
Ans: There can be three possible situations when there is simultaneous change in demand and supply:
(a) When changes in demand and supply are equal.
(b) When change in supply is more than change in demand
(c) When change in supply is less than change in demand.
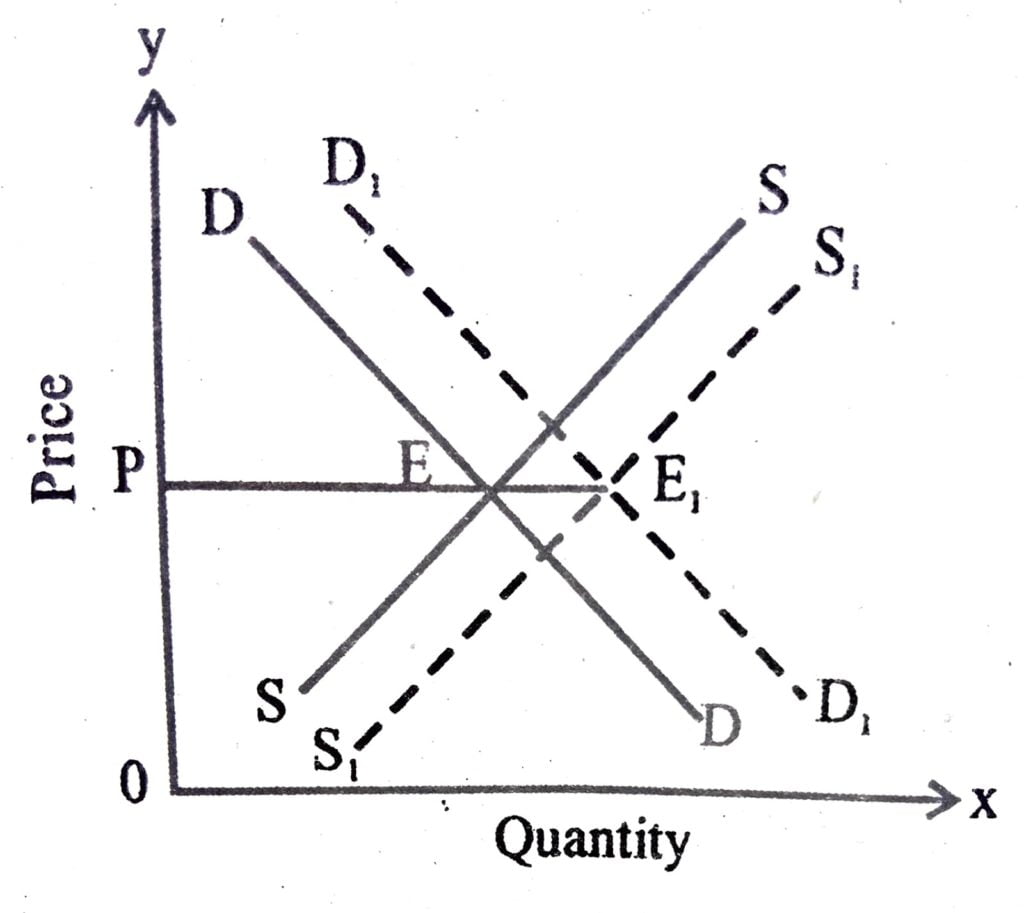
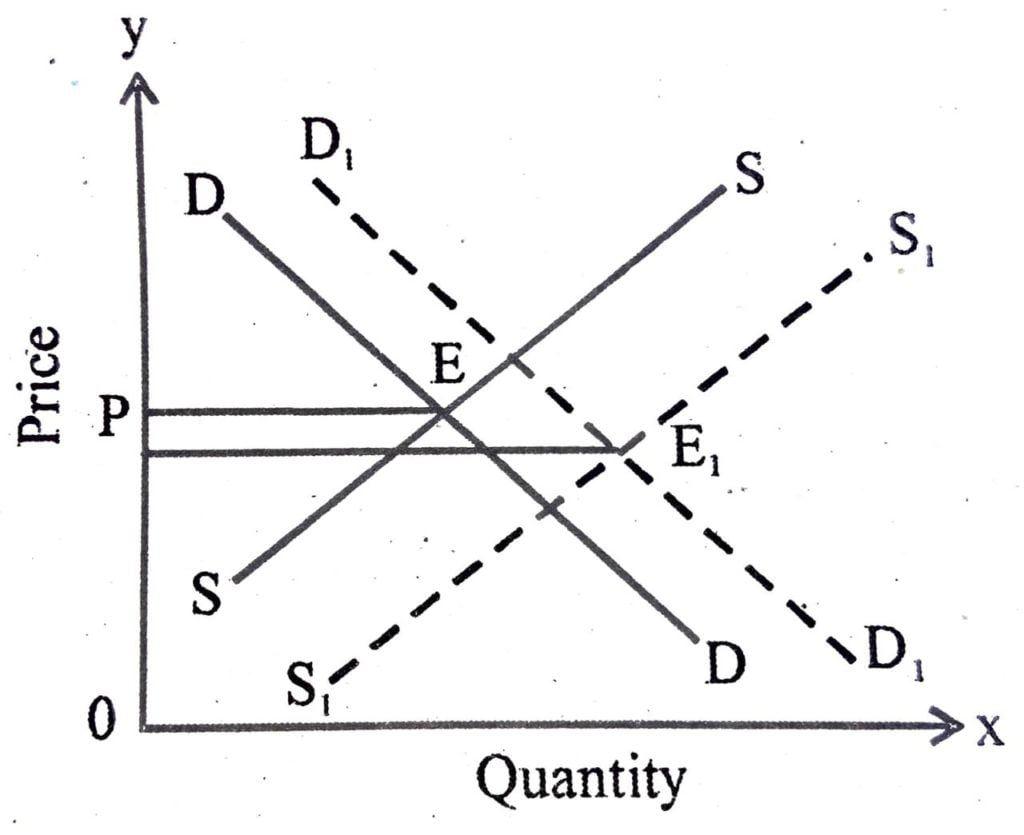
(a) When changes in demand and supply are equal : This situation has been depicted in the figure. In the figure DD and SS are the original demand and supply curve respectively whereas broken lines D₁D₁ and S₁S₁ represent the increase in demand and increase in supply respectively. The diagram clearly shows that changes in demand and supply are equal. Hence the old and new equilibrium prices are the same. i.e. OP but new equilibrium quantity increases from PE to PE₁.
(b) When change in supply is more than change in demand Following figure depicts a situation, where increase in supply is more t increase in demand. In this figure, as a result of shift in demand curve from DD to D₁D₁ supply curve shifts from SS to S₁S₁ Here, increase in supply is more than increase in demand.
Consequently equilibrium price falls from OP to OP¹ but the equilibrium quantity increase from PE to P₁E₁.
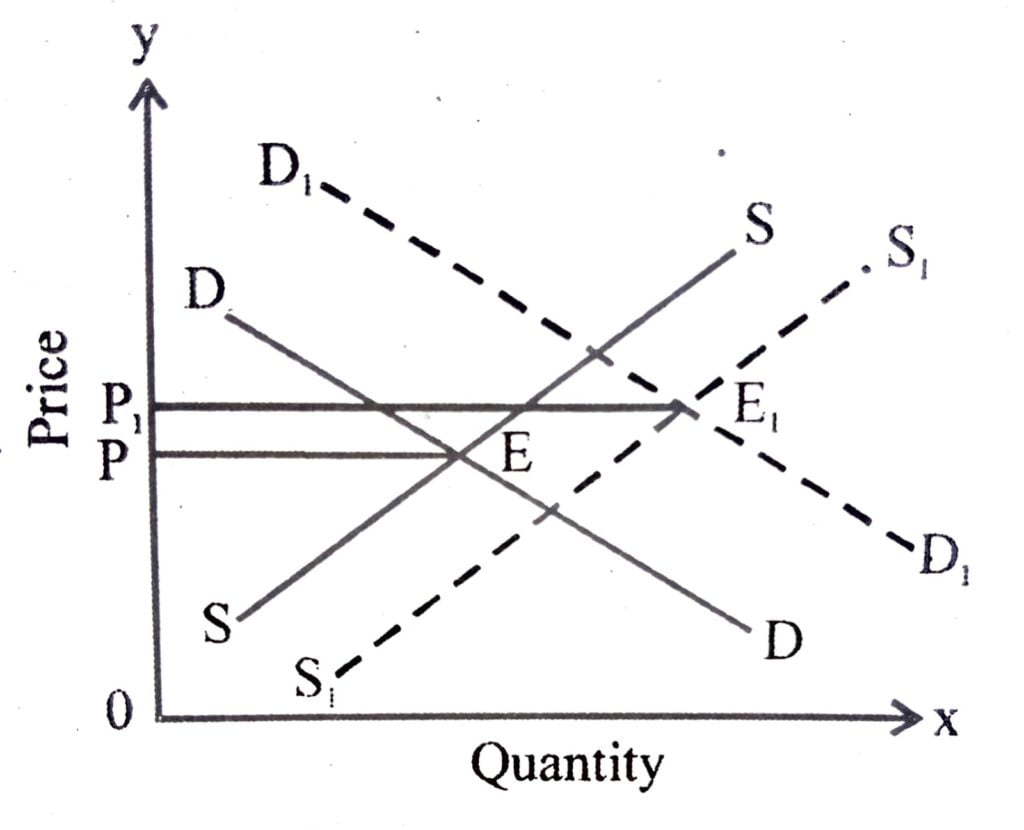
(c) When change in supply is less than change in demand, the following figure shows the effect of simultaneous increase in demand and supply, when increase in supply is less than increase in demand. In such a case, equilibrium price and quantity both increase.
In the figure, OP is the original equilibrium price and PE the equilibrium quantity Demand curve D₁D₁ reflects the situation of increase in demand, while the supply curve S₁S₁ represents the increase in supply. This is clearly visible in the diagram that increase in supply is less as compared to increase in demand. As a consequence of it, new equilibrium price rises to OP₁. New equilibrium quantity also increases from PE to P₁E₁.
4. Show and explain how market equilibrium changes due to the shifting of supply curve.
Ans: Same as above Q. No. 3
5. Explain diagrammatically the impact of simultaneous shift of demand and supply on equilibrium price and quantity.
Ans: Same as above Q. No. 3
6. Explain graphically that with free entry and exit in a perfectly competitive market, the equilibrium price is always equal to the minimum average cost of the firms.
Ans:
The free entry and exit of firms assumption implies that in the long run, all firms in the market will earn only normal profit. In other words, at equilibrium point P=LAC, If at the prevailing market price, each firm i getting abnormal profit, that is price is greater than the minimum of average cost will attract some new firms into the market. Consequently, the market supply of the product will increase leading to fall an its market price, till abnormal profits are wiped out. Similarly, if the existing firms fail to earn even normal profits at the prevailing market price some firms will leave t this point, no the market. This will reduce the market supply of the product. The price would bring to rise till firms are getting normal profits. more firms would leave the market. Thus, with free entry and exit, each firm will always earn normal profit at the prevailing market price.
So long as the market price is greater than the minimum average cost, new firms will enter and at prices below the minimum average cost, existing firms will start leaving the market. At the price level equal to the minimum average cost, the entry or exit process will come to an end. At this, each of the firm will earn only normal profits. Therefore, this price will prevail in the market in the long run.Thus competing firms will supply at the minimum of AC, when free entry and exit is allowed in the market.
Therefore the assumption of free entry and exit of the firms imply that the market price will always be equal to the minimum average cost in long run. i.e.
P=Minimum LAC
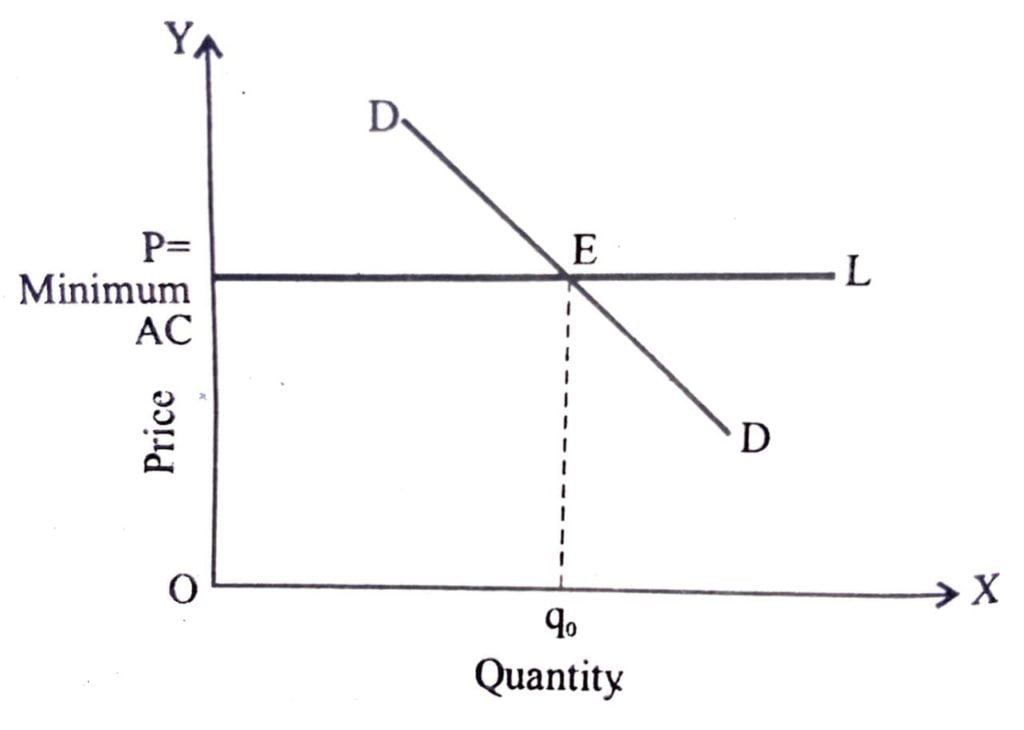
In equilibrium, the quantity supplied will be determined by the market demand at that price so that quantity demanded and quantity supplied are equal. This is shown in the following figure- in the figure the market equilibrium is reached at point E where the market demand curve DD Intersect the P = Minimum AC line, so that at price P, the total quantity demanded and supplied are both equal to q₀ Equilibrium output is q₀ Therefore, the equilibrium number of firms in the market is equal to the number of firms required to produce q₀ output level at price P. Each firm supplies the same amount of output say q₀ If the equilibrium number of
firms in the market is denoted by nf, then nf = q₀/q₀f
7. Does the shift in the demand curve have any impact on the equilibrium price if the condition of free entry and exit prevails ? Explain
Ans: Same as above Q. No. 6
8. Explain the effect of price-ceiling on market equilibrium under the condition of perfect competition.
Ans:
The government fixes a maximum price for a good or service. It is through that if essential goods like sugar, rice, wheat etc. were left to free market, poor people would not, able to buy them at the market determined price. Equilibrium price is presumed to be high. In such a situation, the government fixes maximum allowable price for contain goods which is called price ceiling.
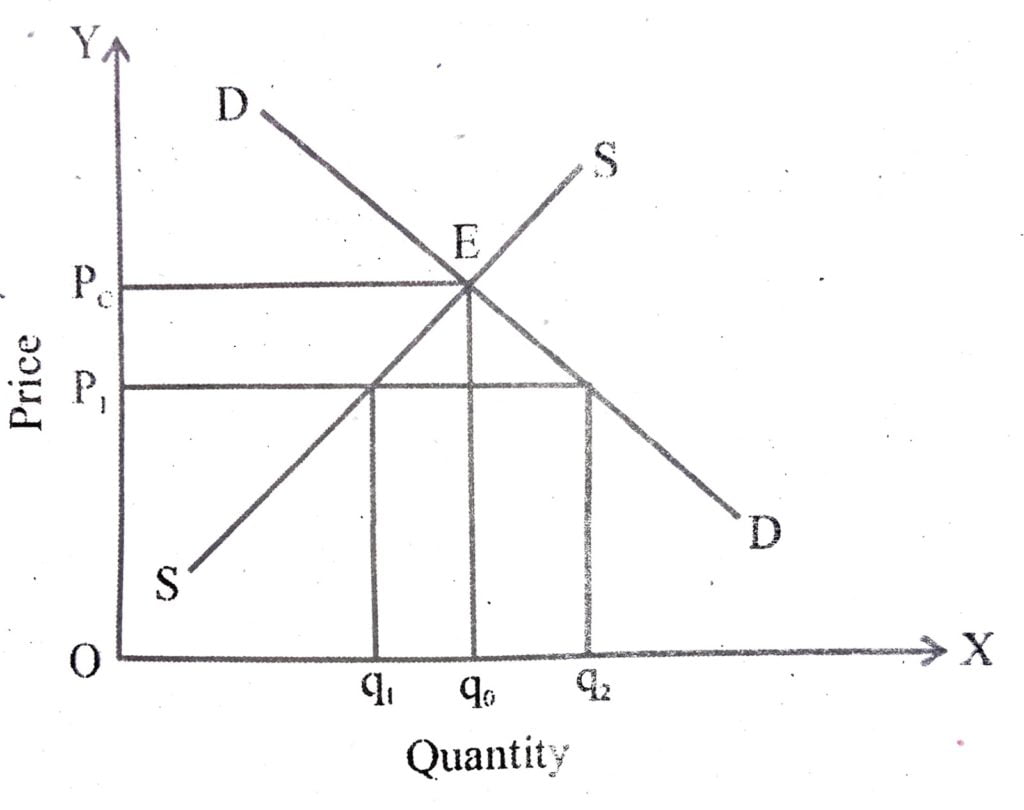
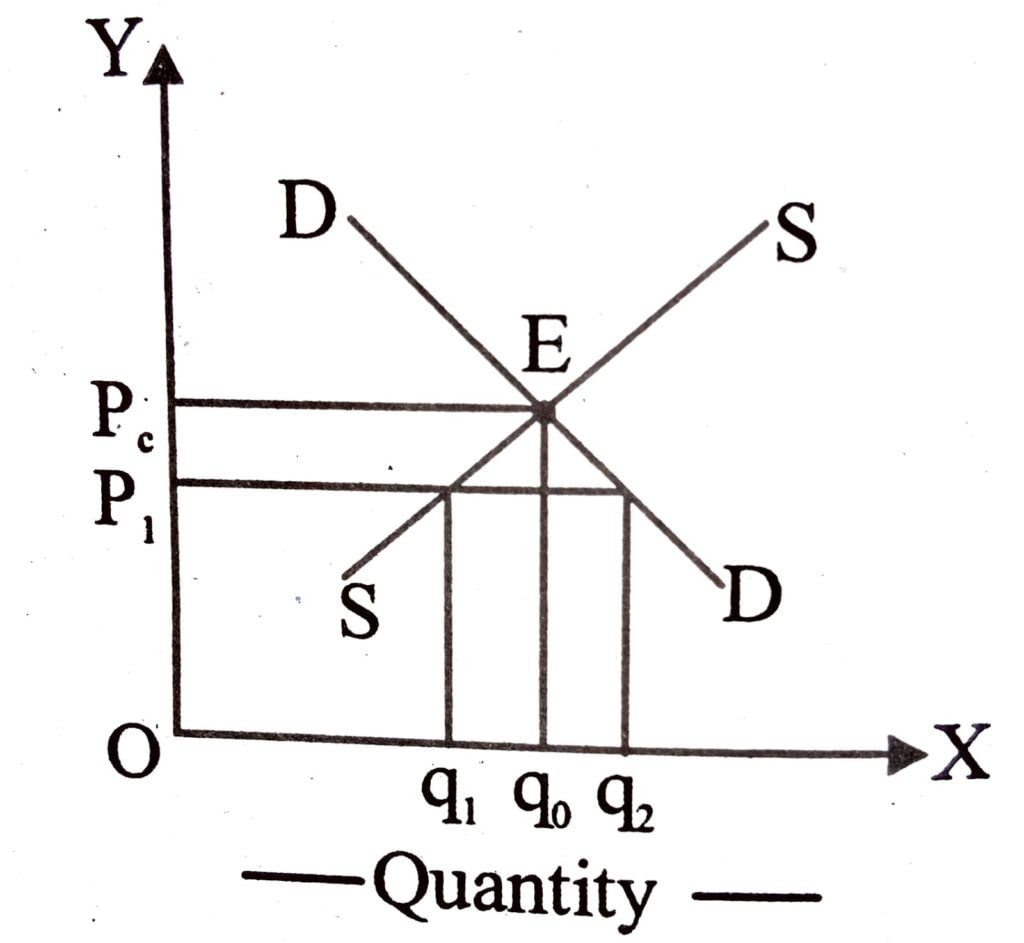
The effect of price ceiling on market equilibrium is discuss through the example of market of rice.The figure given beside shows the market curve DD for rice and SS supply curve. The equilibrium price and quantity of rice are Pₑ and q₀ respectively. When the government fixes the maximum price of rice at P₁ which is below the equilibrium price Pₑ, the producers will produce and
supply less quantity q₁ of the commodity. Consumers on the other hand demand more of the commodity i.e. q₂. Thus, quantity demanded exceeds the quantity supplied by q₁q₂ amount. This means that everybody’s demand at this maximum price is not met or satisfied. Some consumers gain Consumers who can purchase the commodity at the lower price are better off. But those consumers who can not purchase the commodity at all are worse off. The consumers who purchase the commodity may also face the quality deterioration. As the producers already have more buyers than can be actually served, sellers may resort to a lower quality of a commodity. They don’t need to offer a higher quality rice to attract buyers.
In general, price ceiling accompanied by rationing of the goods may have the following advance consequences on the consumers; (a) Each consumer has to stand in long queues to buy the good from ration shops. (b) Since all consumers will not be satisfied by the quantity of the goods that they get from the fair price shop, some of then will be willing to pay higher price for it. This may result in the creation of black market.
9. The supply and demand function of a firm in a perfectly competitive market is given below:
D-50-2P
S=-25+ 3P
Where, P-Price, D-demand, S supply.
– Find out the equilibrium level of price(P) and quantity (q)
Ans: Ans: Given,
D=50-2P
S=25+3P
We know that, at equilibrium,
D=S
⇒50-2P = -25+3P
⇒5P=75
∴ P=15, ie, equilibrium price.
Again, eqlbⁿ Quantity——–
D=50-2P
=50-2.15-50-30=20, i.e., equilibrium quantity.
10. The demand and supply function of a firm under perfectly competitive market are given –
D=100-P
S=-30+4P
where D-quantity demanded, Quantity supplied, P = price Now,
(i) find out the equilibrium level of price and output.
(ii) if the government imposes a tax of ₹5 on each unit of output, find out the impact on equilibrium level of price and output.
Ans: (i) Given,
D=100-P
S=30+4P
∴ In Equilibrium,
D=S
⇒ 100-P=-30+4P
∴ P=26, ie, equilibrium price.
Again, D=100-P=100-26=74, ie,
equilibrium quantity
(ii) Given, government impose a tax of Σ 5,
∴ S=25+3(P-5)
⇒ S=3P-40
∴ New equilibrium
D=S
⇒ 100-P=3P-40
⇒ 100+40=3P + P
⇒ 140 = 4P
∴ P=140/4= 35,ie,equilibrium price.
Again, D=100-P =100-35
65, ie, equilibrium quantity
That means, when a text of Σ 5 is imposed,
price increases from P = 26 to P = 35 and quantity decreases from Q = 74 to Q = 65.
11. The demand and supply functions of a salt producing firm under perfectly competitive market are given below –
Qd = 200-2P and Qs =-100 + 3P
Now,
(i) find out the equilibrium level of output and price.
(ii) If due to increases cost the supply function becomes Qs =- 200+3P, what will be the charges in equilibrium price and quantity? Do you think that this changes are expected?
Ans: Same as above Q. No. 10
12. The supply and demand curve of a firm under perfectly competitive market is given below-
D=75-5P
S=-50+ P
where, D-quantity demanded, Quantity supplied and P-Price, Find out the equilibrium price, quantity demanded and quantity supplied.
Ans: See Q. No. 6, (Short Type l).
13. The demand and supply functions of a firm under perfectly competitive market are given below- Qd = 100 – 3P and Qs =-200+3P Now,
(i) Find out the equilibrium level of price and output.
(ii) If due to increased cost the supply function becomes Qs = -380 +3P, what will be the changes in equilibrium price and quantity? – State reasons for your answer.
Ans:See Q. No. 10 (Long Type)
14. Distinguish between price ceiling and price floor.
Ans: When the government fixes a maximum price for a goods or services it is called price ceiling. It is done because if essential goods like sugar, rice, wheat etc. were left to free market, poor people would not able to buy them at the market determined price. Equilibrium price presumed to be high.
Sometimes, the government fixes the prices of several goods higher than their equilibrium price to protect the interests of certain category of producers. In case of excess supply, farmers of these commodities need not to sell at prices lower than the minimum price fixed by the government. The surplus quantity will purchased by the government. If the government does not procure the excess supply, competition among its sellers would bring down the price to the level of equilibrium price.
15. Explain the concept of excess supply and excess demand with the help of diagram.
Ans:
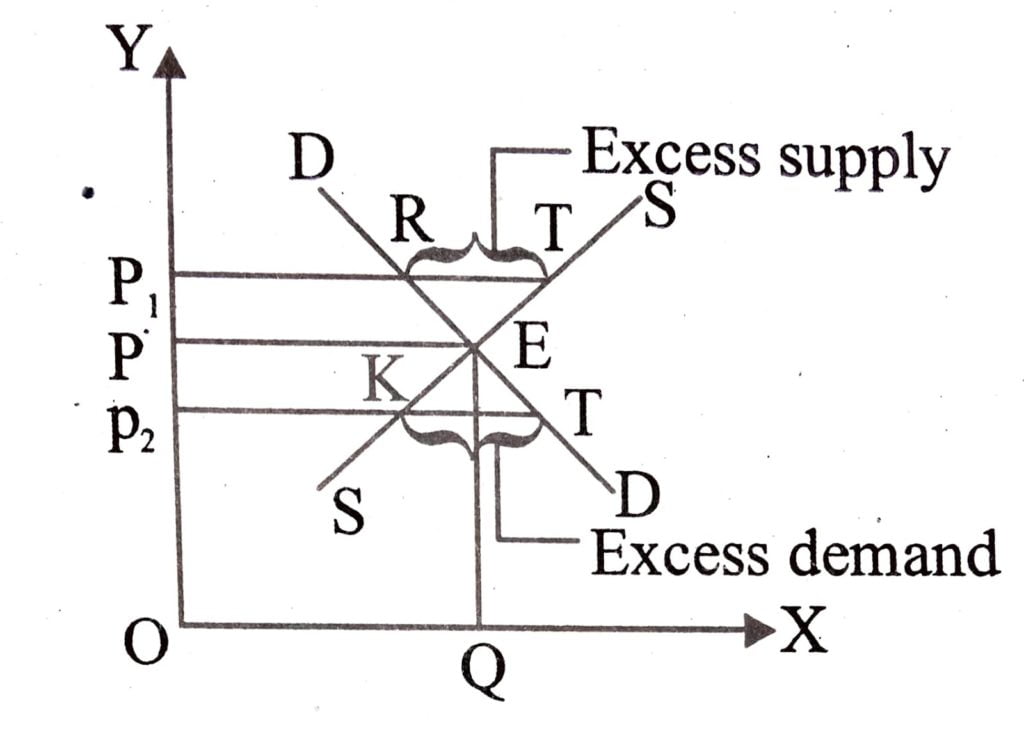
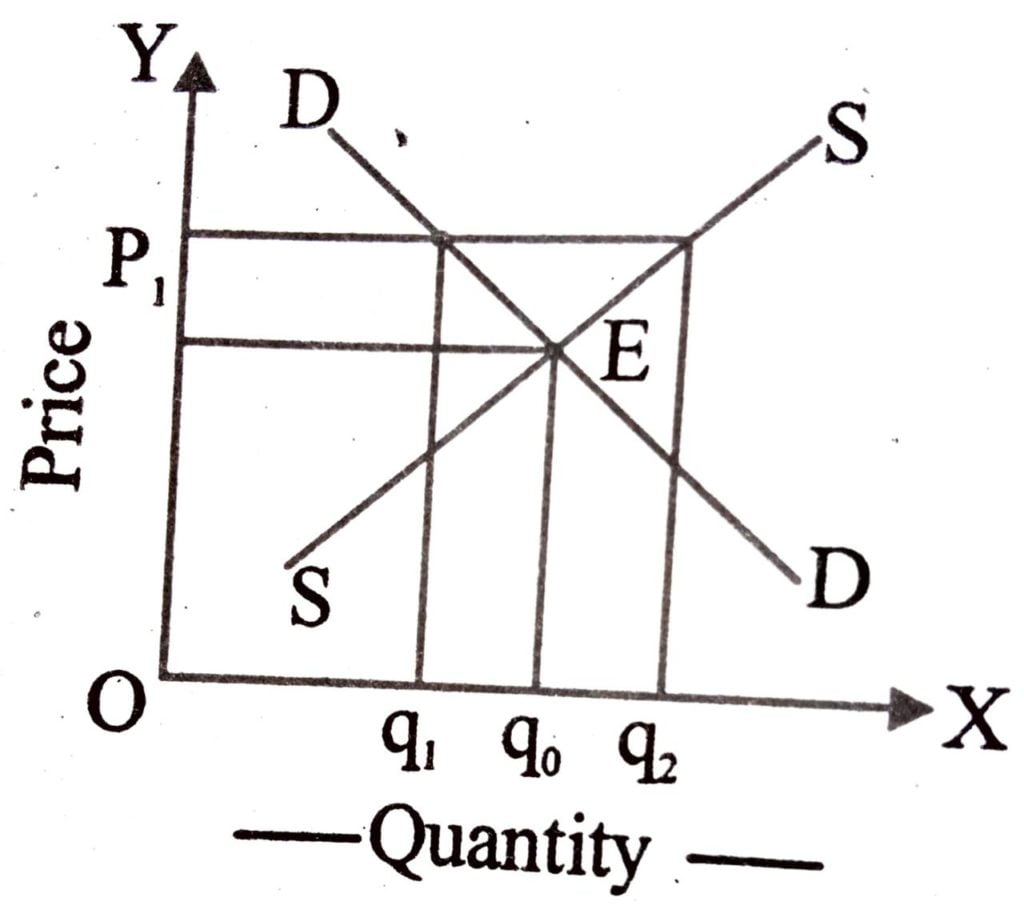
Other thing remaining constant if price increases the demand will reduce and supply will increase as the sellers may tempted to produces and sell more at higher price. The supply over demand is called excess supply. Again if price falls of a commodity many new consumers will emerged. These consumers positively could not be offered this commodity as due to price drop supply will decrease. This demand is called excess demand. It is shown in the diagram below.
In the diagram ‘E’ is equilibrium point where at OP price OQ quantity demand. But when price rise to P, the demand will reduce to P,R and RT is the excess supply. When price decrease to P, demand is P, T and supply is P2 KT is the excess demand.
16. Explain the concept of free entry and exit in case of perfect competition.
Ans: The assumption of free entry and exit of the firm in perfect competition imply that the market price will always equal to the minimum average cost in long run. That is P= Minimum LAC If at the prevailing market price, each firm is getting abnormal profits. That is price is greater then the minimum of average cost. This will attract some new firms into the market. Consequently, the market supply of the product will increase leading to fall in its market price till abnormal profits are wiped out. Similarly, if the existing firms fail to earn even normal profits at the prevailing market price some firms will leave the market. This will reduce the market supply of the product. This price would begin to rise till firms are getting normal profits, at this point no more firms would leave the market and at the price below the minimum average cost exciting firm will start leaving the market. At the price level equal to the minimum average cost free entry and exit is allowed in the market firms will supply at the minimum of AC.
17. What is price ceiling ? Explain the effects of price ceiling on market equilibrium. Mention two adverse consequences of price ceiling on the consumers.
Ans: It is thought that if essential goods like sugar, rice, wheat etc. were left to free market, poor people would not able to buy them at the market determined price. Equilibrium price is presumed to be high. In such a situation, the government fixes maximum allowable price for certain goods which is called price ceiling.
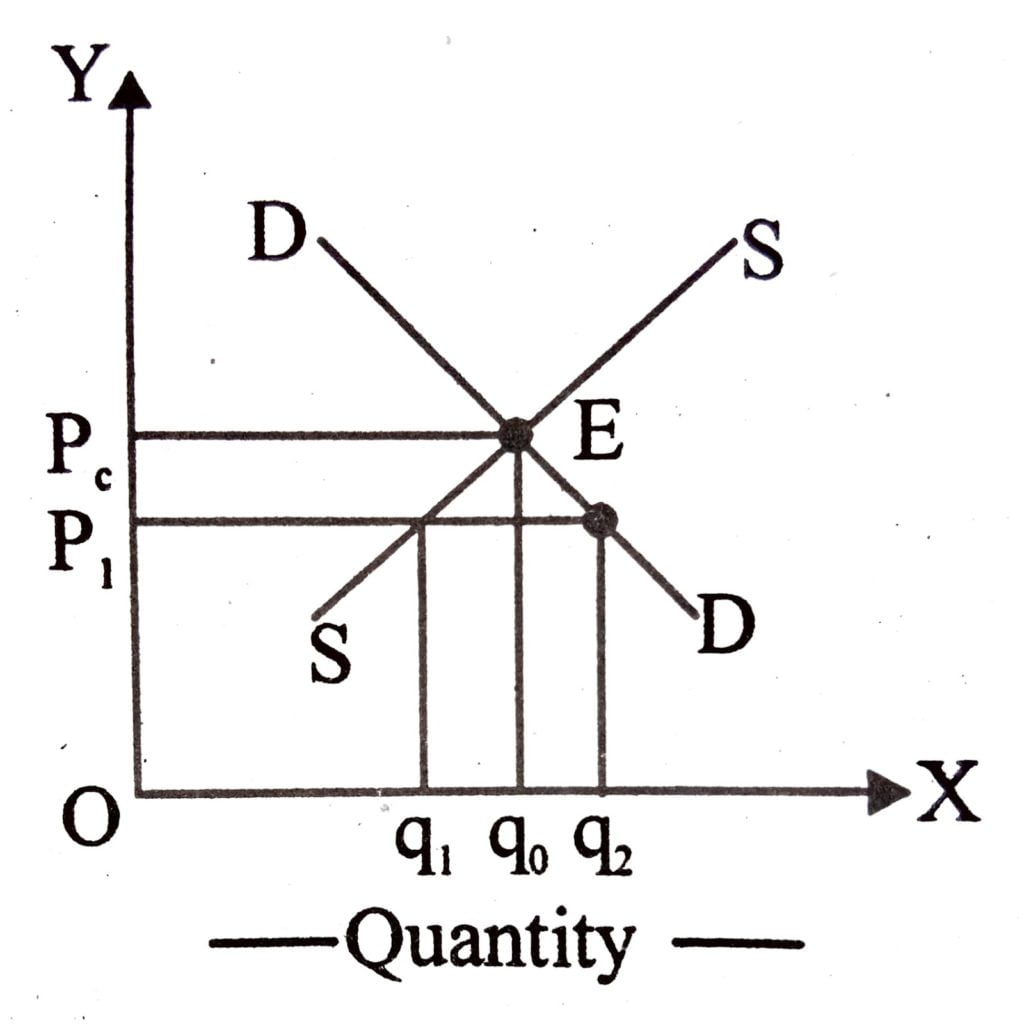
The effect of price ceiling on market equilibrium is explained with the example of rice. In the figure below, market supply curve SS and the market demand curve DD for rice. The equilibrium price and quantity of rice are P,lₑ and qₒ respectively. When the government fixes the maximum price of rice at P₁ which is below the equilibrium price (pₑ) the producers will produce and supply less quantity (q₁) of the commodity. Consumers on the other hand, demand more of the commodity i.e.q2. Thus quantity demanded exceeds the quantity supplied by q₁q₂ amount. This means that everyone’s demand at this maximum price is not met or satisfied. Some consumers gain consumers who can purchase the commodity at the lower price are better off, but those consumers who can not purchase the commodity at all are worse off. Those consumers who purchase the
commodity may also face the quantity deterioration. As the producers already have more buyers than can be actually served, seller may resort to a lower quantity of a commodity. They don’t need to offer a higher quantity rice to attract buyers.
Rationing and black market are the adverse consequences of price ceiling.
18. “Imposition of price ceiling below the equilibrium price leads to an excess demand.” Explain with diagram.
Ans: “Imposition of price ceiling below the equilibriums price leads to an excess demand. This means that everyone’s demand at this maximum price is not matter satisfied. Consumers who can purchase the commodity at the lower price are better off, but those consumers who cannot purchase the commodity at all are worse off. The consumers, who purchase the commodity may also face the quality deterioration. As the producers already have more buyers than can be actually served, sellers may resort to a lower quality of a commodity.
In the diagram SS market supply curve and DD market demand curve. The equilibrium price is pₑ and equilibrium quantity is q₀. When government fixes the maximum price for the product (for example we take rice) at P₁ which is below the equilibrium quantity price (pₑ) the producer will produce and supply less quantity (q₁) of the modity. Consumers on the other hand, demand more of the commodity i.e.q₂ Thus imposition of price ceiling below the equilibrium price lead parallel s an excess demand is q₁q₂
19. “Imposition of price floor above the equilibrium price leads a to an excess supply.” Explain with diagram.
Ans: Sometimes, the government fixes the prices of several goods higher than their equilibrium prices to protect the interest of certain categories of producers. For example in India, the government fixes up the minimum support price for several agricultural products, like wheat, paddy, jawar, bajra, sugar cane etc. In case of excess supply, farmers to these commodity need not to sell at price lower than the minimum prices fixed by the government. The surplus quantity will be purchased by the government. If the government does not procure the excess supply, competition among its sellers would bring down the price to the level of equilibrium price.
In the figure floor price is P₁ which is higher than the equilibrium price P.At this higher price quantity supplied q, exceeds the quantity demand (q₁) by q₁q₂ amount. The equilibrium price and quantity is p and q₀.
20. What is change in demand ? State any three factor that can cause shift in the demand curve.
Ans: A term used in economics to describe that there has been a change, or shift in, a market’s total demand. This is represented graphically in a price vs. quantity plane, and is a result of more/less entrants into the market, and the changing of consumer preferences. The shift can either be parallel or nonparallel.
A parallel shift in demand means that there is no change in the elasticity of demand for the given market, but a nonparallel shift means there has ce lead been a change in elasticity.
The reason why the demand curve slope downwards are explain below:
(a) Law of diminishing marginal utility : According to this law, as a consumer, in a given time, increase the consumption of a thing, the utility from each successive unit goes on diminishing. A consumer gets maximum satisfaction, when the price of a commodity is equal to its marginal utility. As more units are bought, their marginal utility diminishes.
(b) Income effect : Income effect is the effect on the change in the quantity demanded, when the real income of buyer changes as a result of the change in the price of commodity alone. Change in the price of a commodity causes a change in the real income of the consumer. With fall in price, real income increases. The increased real income is used to buy more units of the commodity. Thus, demand extends with increase in real income. Conversely, rise in price leads to fall in real income and hence, contraction of demand.
(c) Substitution effect : Substitution effect refers to substitution of one commodity for the other, when it becomes relatively cheaper. As a result of substitution effect, a consumer in order to get maximum satisfaction, will buy more units of that commodity, whose price has fallen in relation to the substitute commodity.

Hi, I’m Dev Kirtonia, Founder & CEO of Dev Library. A website that provides all SCERT, NCERT 3 to 12, and BA, B.com, B.Sc, and Computer Science with Post Graduate Notes & Suggestions, Novel, eBooks, Biography, Quotes, Study Materials, and more.
